0940
Creating a radiomic signature for H3K27M mutation in midline glioma on multimodal MRI
Manali Balasaheb Jadhav1, Richa Singh Chauhan2, Priyanka Tupe Waghmare3, Archit Rajan4, Abhilasha Indoria2, Jitender Saini5, Vani Santosh6, Madhura Ingalhalikar4, and Subhas Konar7
1Symbiosis Center for Medical Image Analysis, Pune, India, 2Radiology, National Institute of Mental Health and Neuroscieces, Bengaluru, India, 3Symbiosis Institute on Technology, Pune, India, 4Symbiosis Centre for Medical Image Analysis, Pune, India, 5Radiology, National Institute of Mental Health and Neuroscieces, Pune, India, 6Neuropathology, National Institute of Mental Health and Neuroscieces, Bengaluru, India, 7Neurosurgery, National Institute of Mental Health and Neuroscieces, Bengaluru, India
1Symbiosis Center for Medical Image Analysis, Pune, India, 2Radiology, National Institute of Mental Health and Neuroscieces, Bengaluru, India, 3Symbiosis Institute on Technology, Pune, India, 4Symbiosis Centre for Medical Image Analysis, Pune, India, 5Radiology, National Institute of Mental Health and Neuroscieces, Pune, India, 6Neuropathology, National Institute of Mental Health and Neuroscieces, Bengaluru, India, 7Neurosurgery, National Institute of Mental Health and Neuroscieces, Bengaluru, India
Synopsis
H3K27M mutation in diffuse midline glioma is an independent predictor of overall survival however has a very poor prognosis. Identification of the mutation using conventional radiological analysis is complicated while the deep location of the tumors in the brain makes biopsy challenging with substantial risk of morbidity. To alleviate these issues, our work employs radiomics based machine learning framework to predict the H3K27M mutation from multi-modal MRI on 46 subjects. Results revealed 91% cross validation accuracy illustrating its future potential in clinical use.
Introduction
H3K27M mutation in diffuse midline glioma is characterized by a K27M mutation in either H3F3A or HIST1H3B/C [1]. The mutation is highly predictive of the overall survival of the patient regardless of the age and tumor location [2]. Nonetheless, detecting the mutational status is challenging on multi-modal MRI as visual features do not facilitate enough diagnostic power. Additionally, the deep locations of these tumor such as thalamus, brainstem etc. biopsy can be challenging with substantial risk of morbidity [3]. It is therefore crucial to innovate non-invasive image based markers for prognosis that can lead to early treatment planning and consequently better outcomes. To this end, our work proposes to apply phenotypic regional quantitative radiomics from multi-modal MR images. Radiomics have a unique capability to illustrate microstructural and tissue level alterations and when employed a machine learning framework can facilitate the prediction of the H3K27M mutation.Methods
After the approval from the ethical committee of the institute, retrospective MRI data of 46 patients detected with midline glioma was collected among which histone H3K27M mutation was present (i.e. mutant) in 23 patients (Avg. age= 29.9±17, M: F= 8:15) and absent (i.e. wildtype) in 23 patients (Avg. age= 30.3±16.2, M: F= 14:9). Immuno-histochemical staining was performed using the Ventana Benchmark automated staining system (Ventana Benchmark-XT) to detect the histone H3K27M mutation. The antibody used for identifying the H3K27M mutation was H3K27me3 (Millipore, 07-449; 1:100) (H3.3K27Mme3, Medaysis, RM192, 1:100). The MRI data used for this study had four modalities T1 weighted contrast enhanced (T1CE), FLAIR, T2 weighted and DWI generated ADC maps. All the subjects were scanned on Philips and Siemens scanners with T1 weighted (1) T1ce: 1.5T-TR/TE=1800-2200/2.6-2.9ms; 3T-TR/TE=1900-2200/2.3-2.4ms in 1x1mm resolution (2) FLAIR:1.5T- TR/TE=7500-9000/8.2-9.7ms;3T-TR/TE=9000/8.1-9.4ms in plane resolution=5x5mm (3) T2:1.5T- TR/TE=4900-6700/89-99ms and 3T- TR/TE=5200-6700/80-99ms in 5x5mm resolution (4) ADC: TR/TE2700-4200/79.3-109.0ms with slice thickness of 4mm. Pre-processing included following steps: conversion of DICOM images to NIFTI format, registration of all the modalities to T1CE using rigid transformation and brain extraction using FSL_BET. This was followed by automated segmentation of the brain extracted brain MRI images and they were segmented into contrast enhanced tumor, edema and necrosis using a U-net proposed by Isensee et al [4]. The segmentations were then manually corrected using ITK-SNAP [5]. Radiomic features were extracted using PyRadiomics 2.2.0 library [6]. A total of 1548 features that included intensity and statistical features such as, Gray-Level Co-occurrence Matrix (GLCM), Gray-Level Dependence Matrix (GLDM), Gray-level Run Length Matrix (GLRLM), Gray Level Size Zone Matrix (GLSZM) and Neighboring Gray Tone Difference Matrix (NGTDM) were extracted (129 features from 3 regions – enhancement, edema and necrosis for 4 modalities –T1CE, FLAIR, T2 and ADC = 129*3*4 =1548 features). First level feature selection as performed using a standard t-test and top 130 features were retained. Ten-fold random forest based classification was performed on min-max normalized features. Second level feature reduction was performed by selecting 10 best features based on ANOVA F-values within the training set (in the 10-fold validation). Random forest model was applied with the following specifications: random_estimators=5000, min_samples_leaf=5, min_samples_split=10, random_state=4, oob_score=True, max_features='log2', max_samples=0.7 implemented in Scikit learn [7] Figure 1 illustrates the schematic diagram for the complete process.Results
Figure 2 provides brief demographics of the patients. The average 10-fold cross validation accuracy was 91% and the precision, recall and f1-score are given in Figure 3. The top 10 features were extracted and are plotted for the two groups in Figure 4. These features included GLSZM and first order features from edema region on T2 and FLAIR images and GLCM and first order features from T1CE necrosis and enhancement.Discussion
Our study illustrates the viability of abstracting phenotypic quantitative textural and intensity features which have a unique capability to illustrate microstructural and tissue level alterations, employed into a multivariate machine learning framework to identify midline glioma with H3K27M mutation. We employ multiple MRI modalities and illustrate that features from T2-weighted edema, T1CE enhancement and necrosis are crucial in the classification. Identifying H3K27M status non-invasively from the first MRI scan with such superior accuracy provides evidence that such techniques can be translated to clinical workflow for prognosis and can support consequent tailored treatment planning and therapeutic intervention for improved outcomes. Further validation on larger datasets as well as prospective validation is vital.Acknowledgements
No acknowledgement found.References
1. Louis, D. N., Perry, A., Reifenberger, G., Von Deimling, A., Figarella-Branger, D., Cavenee, W. K., ... & Ellison, D. W. (2016). The 2016 World Health Organization classification of tumors of the central nervous system: a summary. Acta neuropathologica, 131(6), 803-820. 2. Karremann, M., Gielen, G. H., Hoffmann, M., Wiese, M., Colditz, N., Warmuth-Metz, M., ... & Gessi, M. (2018). Diffuse high-grade gliomas with H3 K27M mutations carry a dismal prognosis independent of tumor location. Neuro-oncology, 20(1), 123-131. 3. Enomoto, T., Aoki, M., Hamasaki, M., Abe, H., Nonaka, M., Inoue, T., & Nabeshima, K. (2019). Midline glioma in adults: clinicopathological, genetic, and epigenetic analysis. Neurologia medico-chirurgica, oa-2019. 4. Isensee, F., Kickingereder, P., Wick, W., Bendszus, M., & Maier-Hein, K. H. (2018, September). No new-net. In International MICCAI Brainlesion Workshop (pp. 234-244). Springer, Cham. 5. Yushkevich, P. A., Piven, J., Hazlett, H. C., Smith, R. G., Ho, S., Gee, J. C., & Gerig, G. (2006). User-guided 3D active contour segmentation of anatomical structures: significantly improved efficiency and reliability. Neuroimage, 31(3), 1116-1128. 6. Herz, C., et al., DCMQI: An Open Source Library for Standardized Communication of Quantitative Image Analysis Results Using DICOM. Cancer research, 2017. 77(21): p. e87-e90. 7. Buitinck, L., Louppe, G., Blondel, M., Pedregosa, F., Mueller, A., Grisel, O., ... & Layton, R. (2013). API design for machine learning software: experiences from the scikit-learn project. arXiv preprint arXiv:1309.0238.Figures
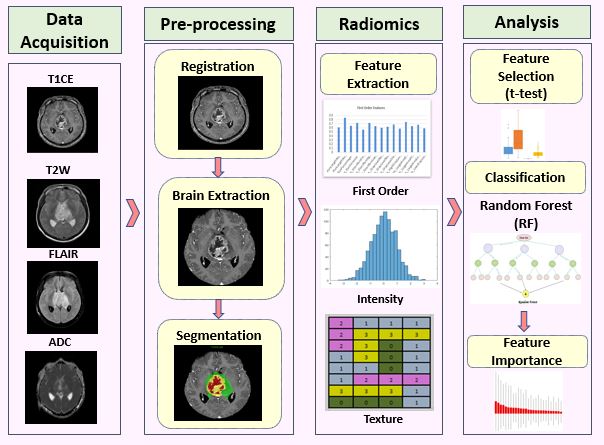
Figure 1:
Processing pipeline for radiomics analysis and classification for histone
H3K27M mutation
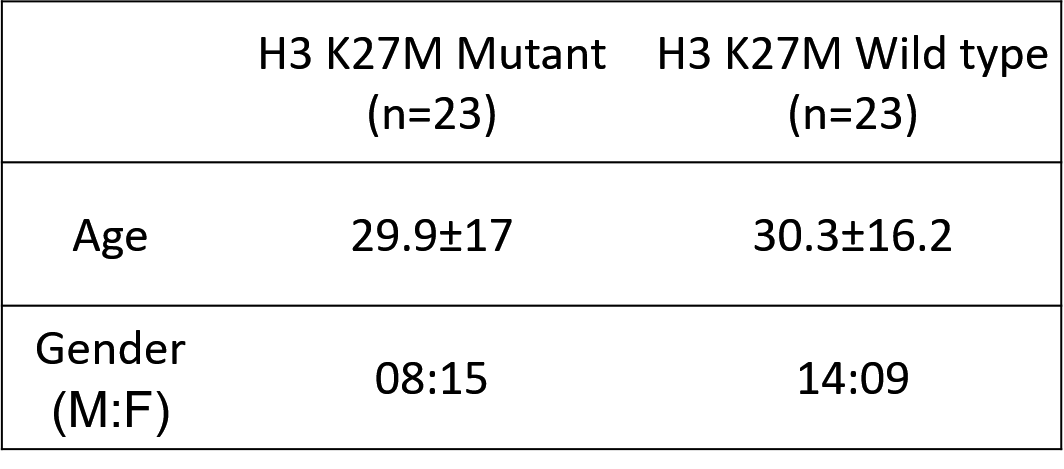
Figure 2: Demographics of the patients with midline gliomas

Figure 3: Classification results based on T1
radiomics
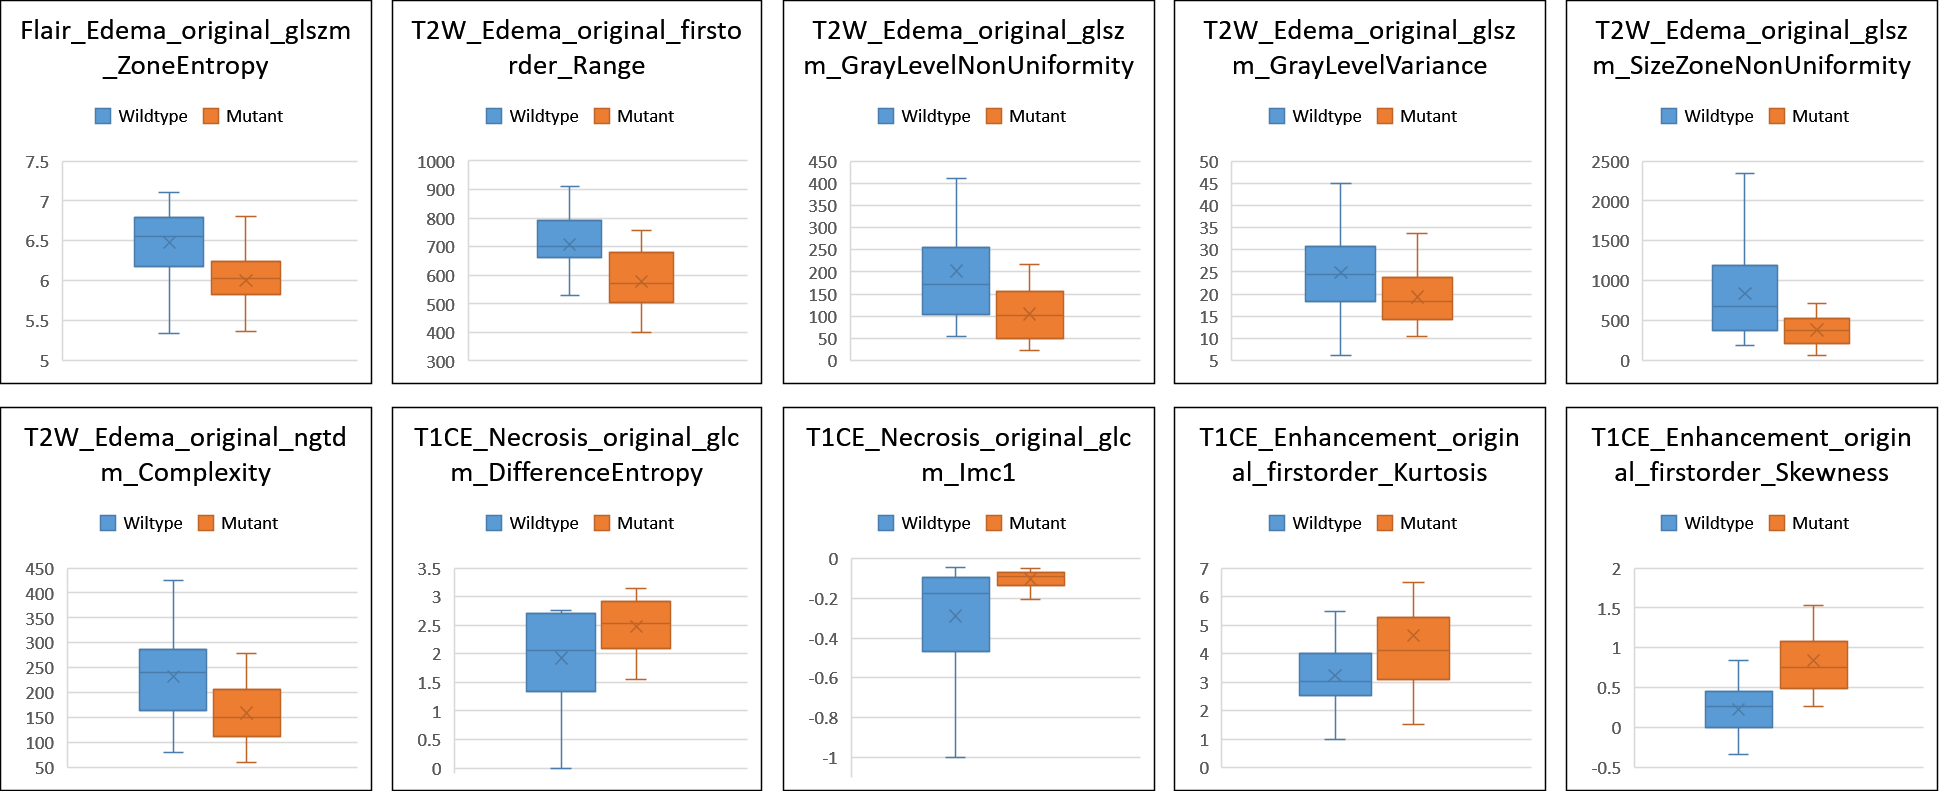
Figure 4: Box plot for top 10 most important features obtained using random forest classifier