0939
Radiomics Based Classification of Ependymoma and High Grade Glioma Using Multimodal MRI1Symbiosis International University, Pune, India, 2National Institute of Mental Health and Neurosciences, Bangalore, India
Synopsis
Adult Supratentorial Extraventricular Ependymoma (STEE) are rare neoplasms that are often misdiagnosed as high-grade gliomas (HGG) due to their similar radiological manifestation on MRI. However, the pathogenesis and treatment plan of ependymoma differs significantly from gliomas, and hence an early and accurate diagnosis is crucial. We propose a novel machine learning based diagnostic model that can accurately distinguish adult STEE from HGG subtypes using quantitative radiomic signatures from a multi-model MRI data. First order and texture based radiomic features, particularly from FLAIR, T2 and ADC, can capture intricate pathological variations and aid in accurate and differential diagnosis of STEE tumors.
Introduction:
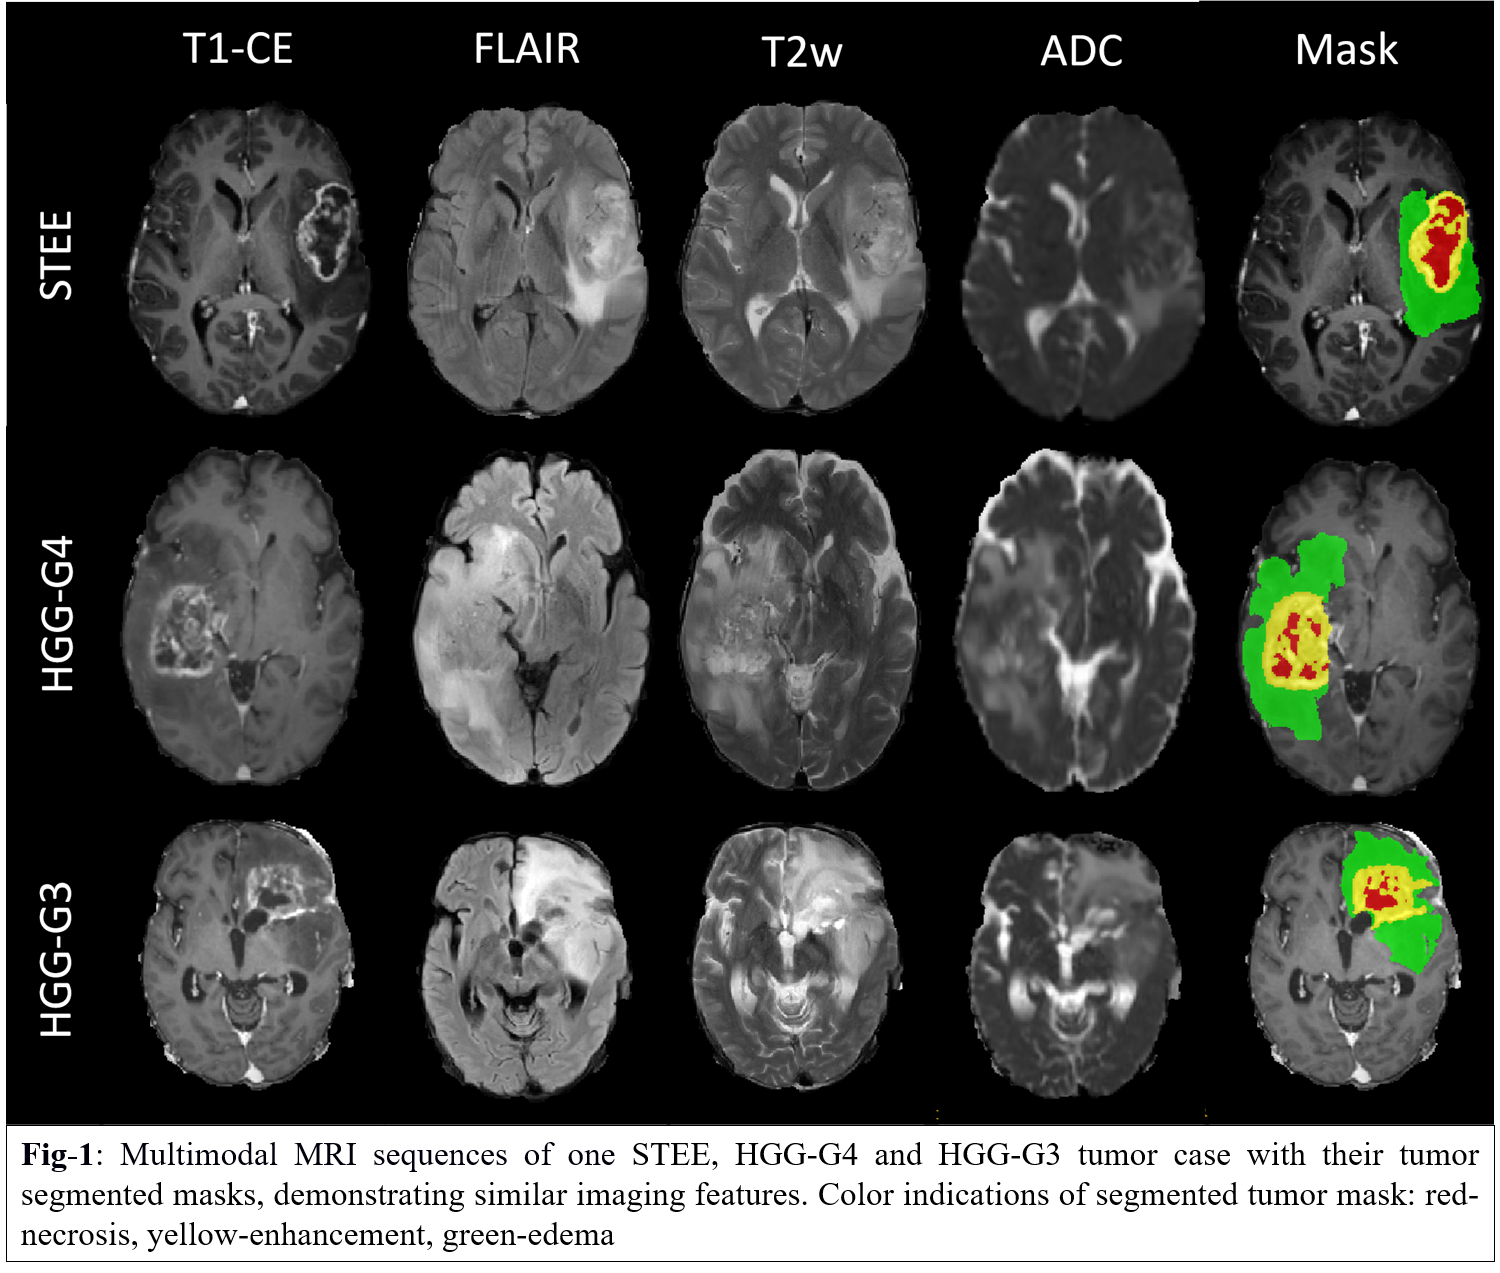
Supratentorial ependymoma are relatively rare neoplasms which constitute around 3-5% of adult intracranial tumors and present a wide range of histopathological spectrum[1]. Radiological distinction of supratentorial extra-ventricular ependymoma (STEE) is complicated as they mimic with high grade gliomas (HGG) on a magnetic resonance image (MRI) [2, 3]as shown in Fig-1. However, the underlying pathology, treatment approach and its intensity differ significantly between tumors [4-7]. Therefore, it is crucial to accurately predict the tumor type for a better prognosis, optimized treatment planning and a better outcome. Radiomics is a quantitative technique that can extract intricate imaging-based features such as intensity, geometry, statistics, shapes, patterns and texture-based properties that are usually beyond human visual perception[8]. Recent studies have demonstrated the potential of multimodal MRI based radiomic features in characterizing tumor phenotypes and identifying intra-tumoral tissue heterogeneity for accurate diagnosing of different tumor subtypes[9-11]. This study aims at characterizing predictive radiomics based imaging signatures of STEE from multimodal MRI setup that can aid in better prognosis and effective treatment planning.Methods:
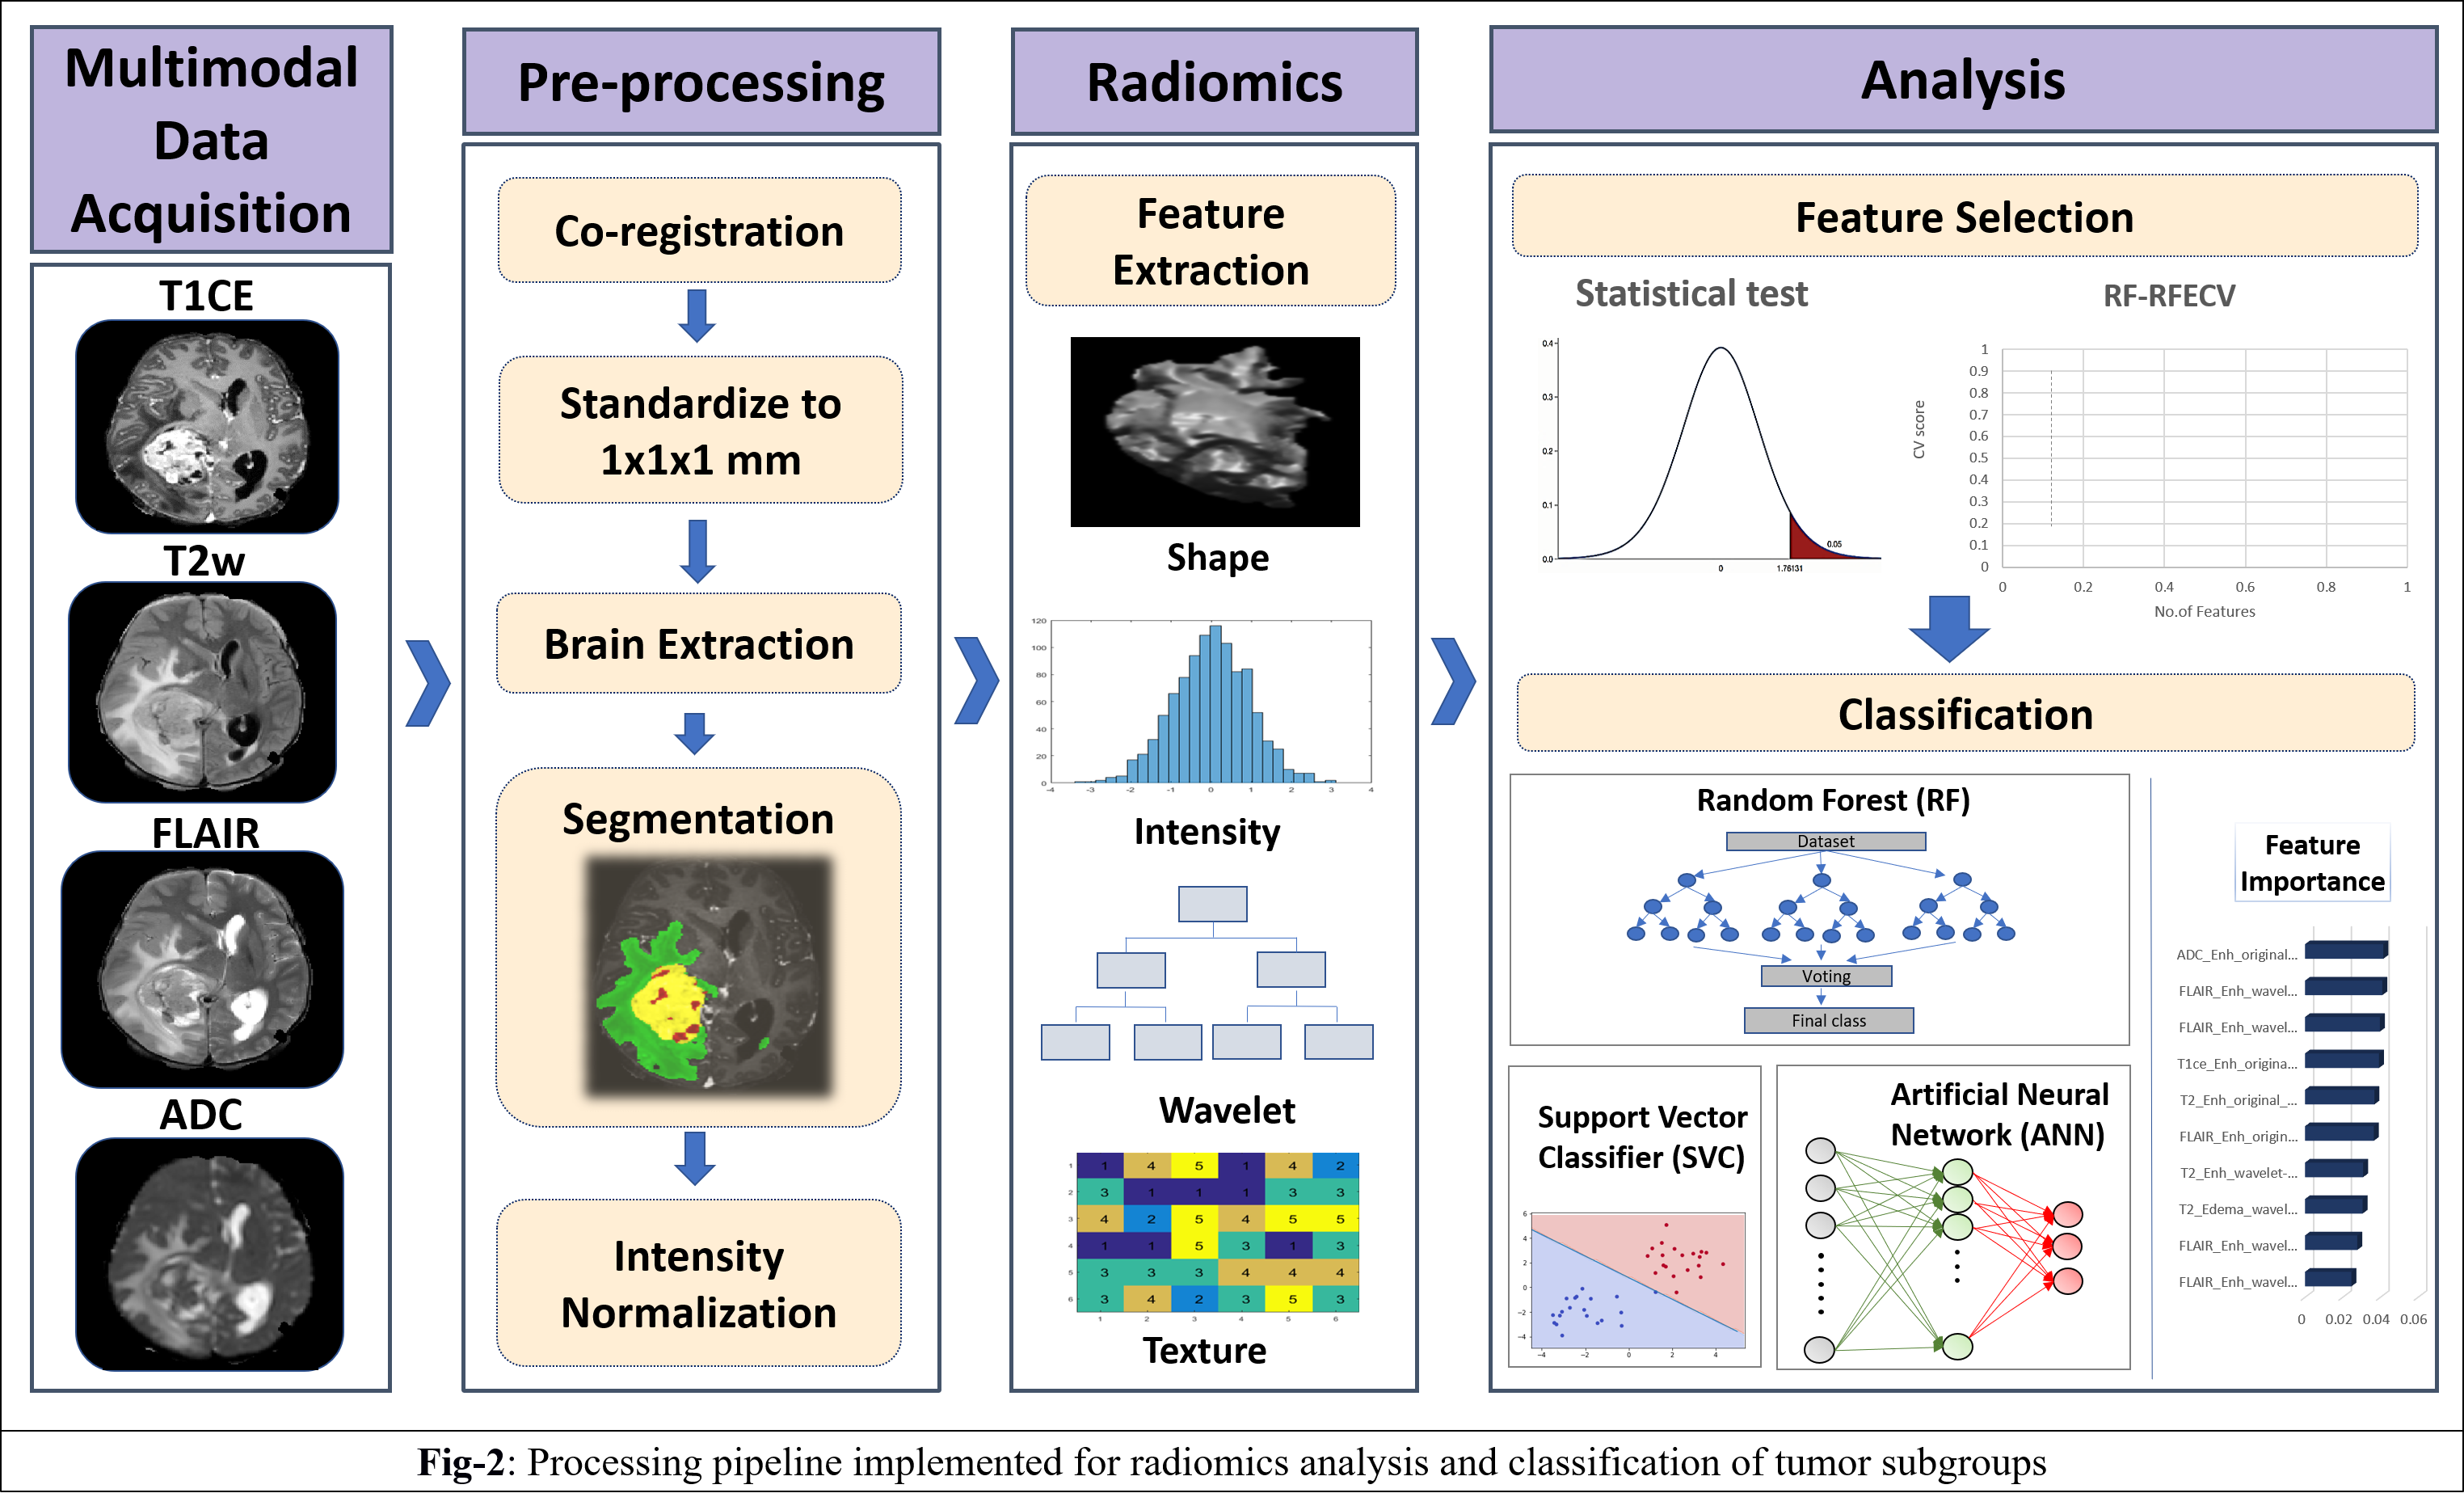
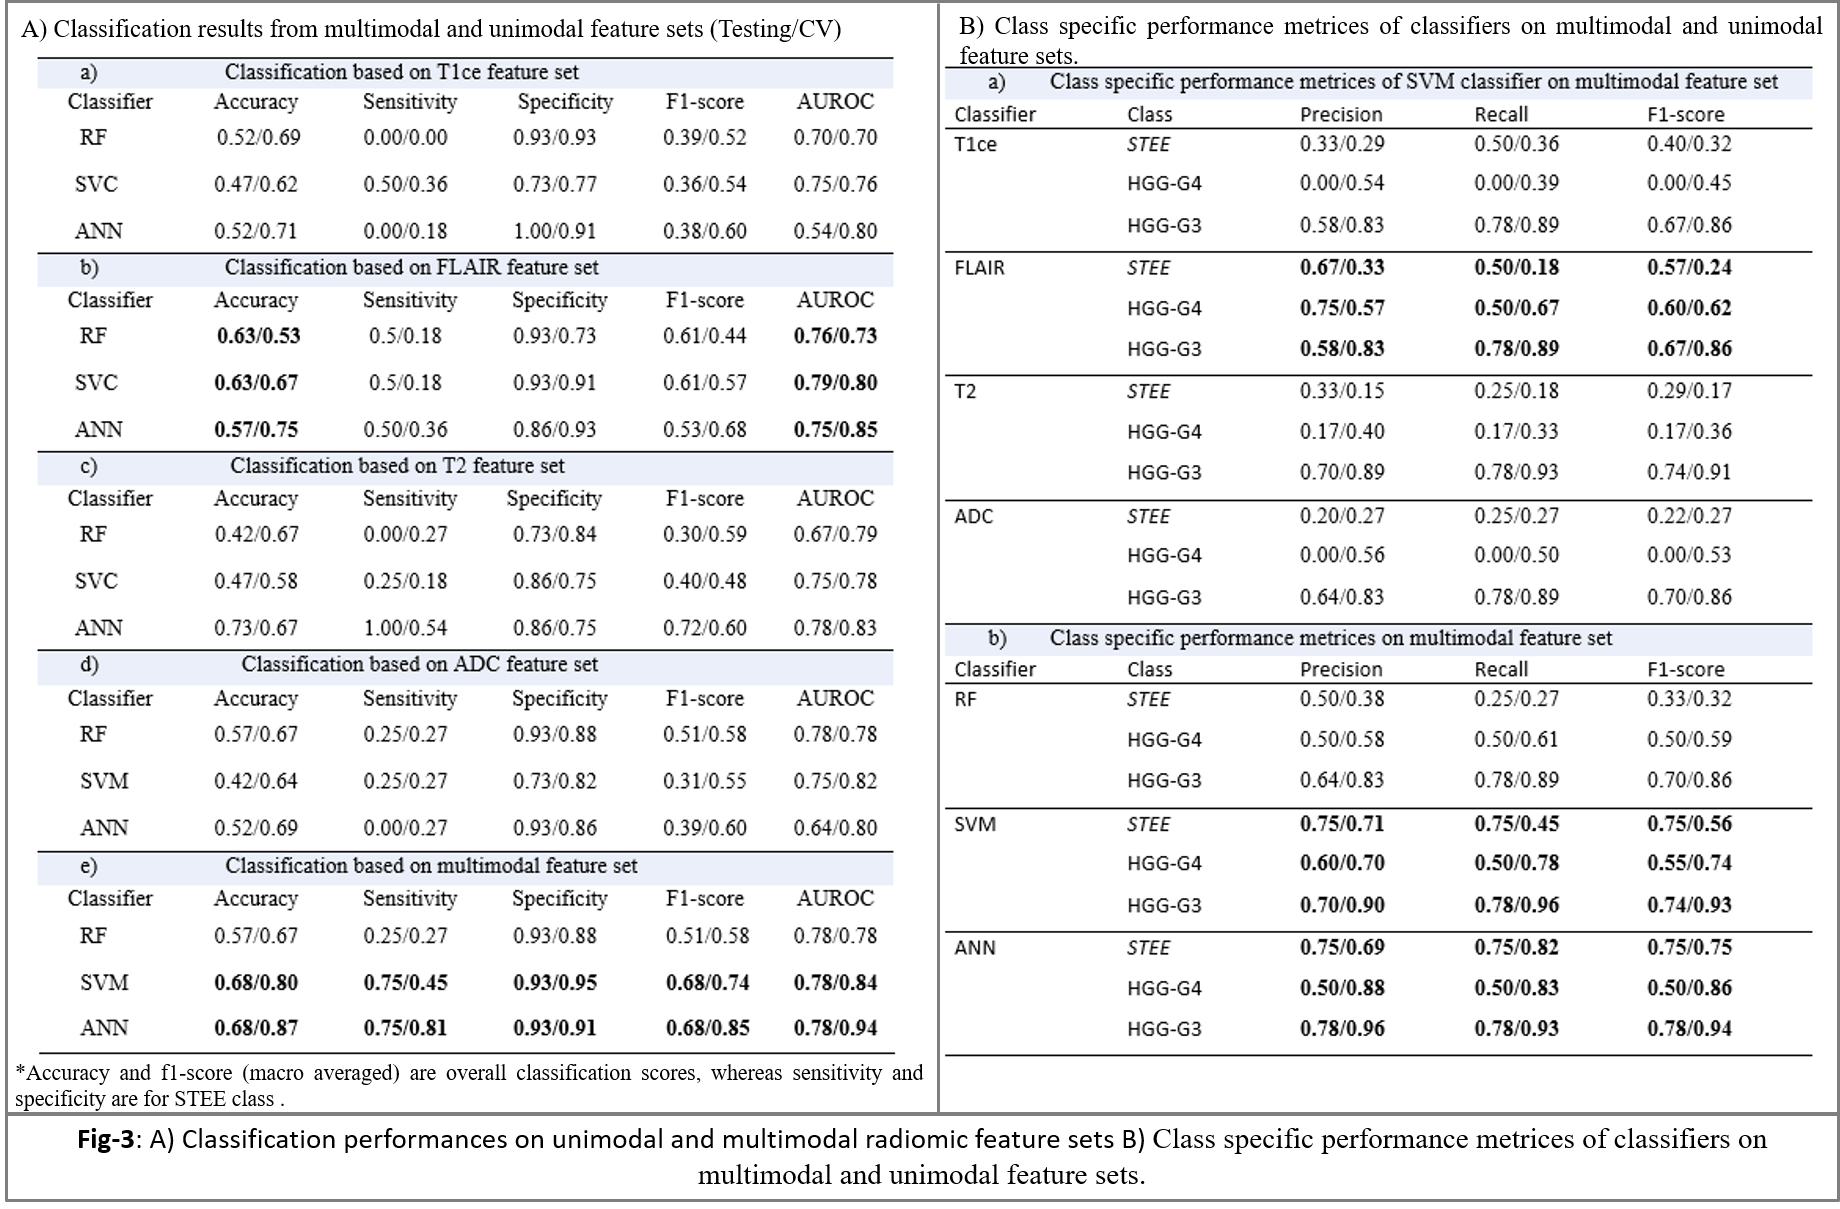
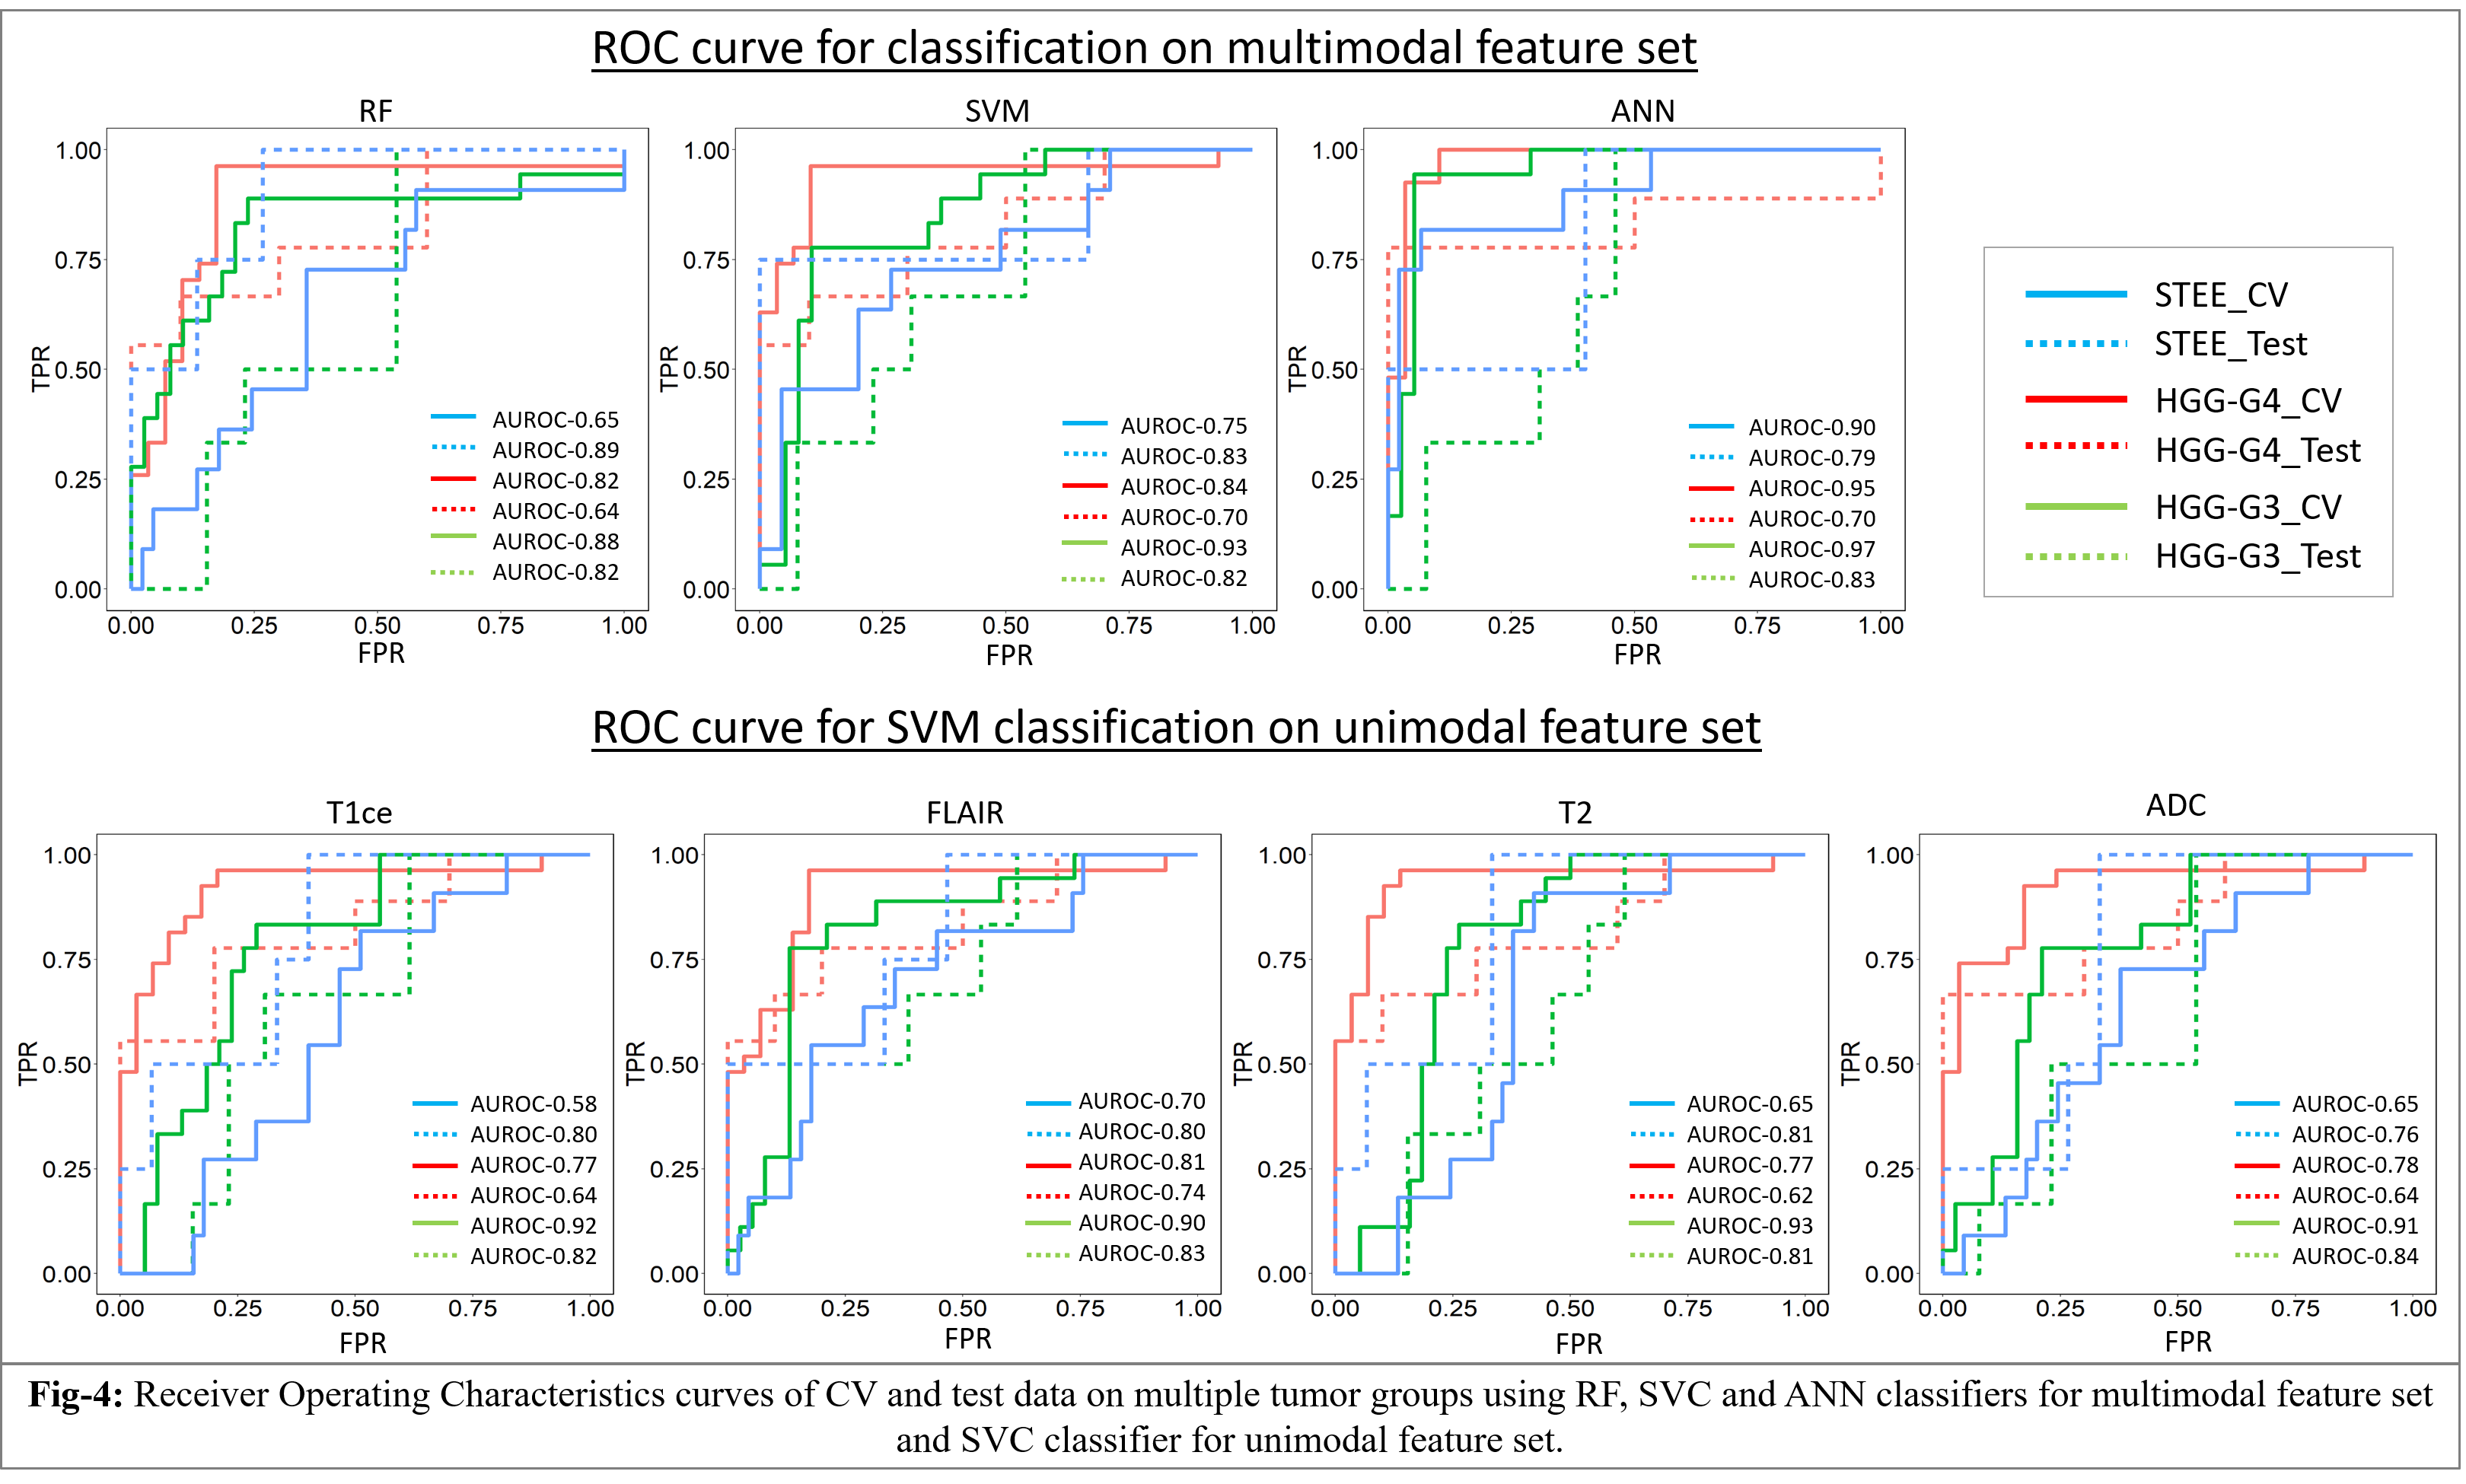
: Our clinical cohort consisted of three tumor groups- STEE (n=15, age = 27.2 ± 11.73 yrs, M: F = 8:7), HGG-G4 patients (n=24, age = 48.8 ± 15.76 yrs, M: F = 11:13) and HGG-G3 (n=36, age = 39.30 ± 11.64 yrs, M:F = 22:14), diagnosed by histopathological examination of the resected tissue. All patients were scanned on 3T MRI scanners, 77% scans were on Philips Achieva MRI and others on Siemens Skyra MRI. Gadolinium enhanced T1ce scans were obtained using Philips TFE sequence: TR/TE = 8.0/3.7ms and Siemens T1 MPRAGE sequence: TR/TE = 1800-2200/2.3-2.6ms, voxel size=1x1x1mm. T2 weighted images were acquired with TR/TE ranging from 3600-6000/80-99ms and voxel size-0.5x0.5 mm. FLAIR images were acquired using TR/TE/TI of 11000/125/2800 with voxel size- 0.5x0.5mm. ADC maps were generated from DWI sequence. Fig-2 shows analysis pipeline, pre-processing steps of MRI images included: co-registration of all modalities to T1ce using six degree rigid body transformation, resampling and transforming images to MNI space for a common origin, brain extraction using FSL-BET, followed by segmentation of enhancing tumor, edema, and necrosis masks using a deep learning model (DeepMedic)[12], their manual correction and intensity normalization. Radiomic features like shape, statistical measures, Gray-Level Co-occurrence Matrix (GLCM), Gray-Level Dependent Matrix (GLDM), Gray Level Run Length Matrix (GLRLM), Gray Level Size Zone Matrix (GLSZM) and Neighbouring Gray Tone Difference Matrix (NGTDM) were computed using PyRadiomics 2.2.0 library[13], from original and filtered images. For each subject, 11274 total features were computed from all modalities using edema and enhancement masks for classification. Dataset was split into 75-25% train (n=56) and test set (n=19), radiomic features were normalised using min-max normalization. Feature selection was done on radiomic features from each modality separately using a two-stage strategy on the train set. In 1st stage features were selected using ANOVA F-test (p-value=1xe-06, max 50 features) and were taken forward in 2nd stage which performed Random Forest based Recursive Feature Elimination with Cross Validation (RF-RFECV)[14, 15] such that atleast 10 important features were selected per modality. Multiclass classification of STEE and HGG subtypes was done using selected unimodal feature sets and a multimodal feature set by combining all modality features. Multiple classification algorithms such as RF, Support Vector Classifier (SVC) and Artificial neural network (ANN) were implemented on both feature sets. All classification models were trained on train set of 56 subjects and tested on 19 subjects. Training data was augmented using borderline Synthetic Minority Oversampling Technique (SMOTE) [16]. RF model was designed using 10K trees, maximum depth = 2, maximum of square root of input features per tree and ‘Gini’ criterion as the loss. SVC was implemented using a linear kernel and c=1. Three-layer ANN was implemented using 5 hidden units per layer, learning rate=0.005, binary cross entropy loss function and Adam optimizer. Leave One Out Type Cross Validation (LOOCV) was done on train set to validate each classifier model. Classification performance of models were compared using macro averaged accuracy, F1-score and AUROC (Area Under Receiver Operating Curve), whereas class specific performance was evaluated using precision, recall, F1-score and AUROC. Most discriminative features involved in classification were obtained using SVC coefficients for each pair of classes for unimodal as well as multimodal feature sets.Results:
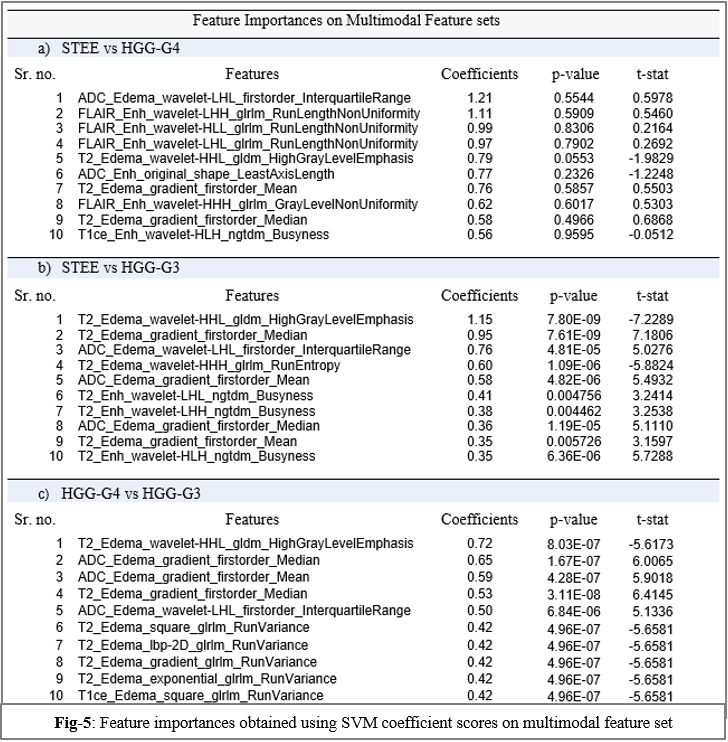
The optimum no. of features selected per modality for classification were: T1ce-10, FLAIR-10, T2-22, ADC-11. Multimodal features demonstrated higher classification performance over unimodal feature set in discriminating STEE and HGG subtypes as shown in Fig-3 and Fig-4. Radiomic features from FLAIR modality consistently provided high classification performance in delineating all tumor groups, particularly texture features were most important in discriminating STEE from HGG-G4, as shown in Fig-5, whereas first order features from T2 and ADC consistently ranked higher in differentiating multiple tumor groups.Conclusion:
Radiological manifestations of STEEs are complicated and can undoubtedly be mis-diagnosed as HGGs due to their similar imaging attributes. To this end, multimodal radiomic features, particularly from FLAIR, T2 and ADC modalities collectively provide better classification accuracy over unimodal radiomic features. Coalescence of quantitative radiomics and multimodal MRI can potentially capture intricate and complementary information and thus aid in establishing predictive phenotypic signatures of STEE.Acknowledgements
No acknowledgement found.References
1.Gilbert, M.R., Ruda, R., & Soffietti, R. , Ependymomas in adults. Current neurology and neuroscience reports, 2010. 10(3): p. 240-247.
2.Leng, X., et al., Magnetic resonance imaging findings of extraventricular anaplastic ependymoma: A report of 11 cases. Oncol Lett, 2016. 12(3): p. 2048-2054.
3.Shintaku, M. and K. Hashimoto, Anaplastic ependymoma simulating glioblastoma in the cerebrum of an adult. Brain Tumor Pathol, 2012. 29(1): p. 31-6.
4.Watts, C., Surgical management of high-grade glioma: a standard of care. CNS oncology, 2012. 1(2): p. 181-92.
5.Stupp, R., et al., Radiotherapy plus concomitant and adjuvant temozolomide for glioblastoma. N Engl J Med, 2005. 352(10): p. 987-96.
6.Wang, M., et al., Supratentorial extraventricular ependymomas: A retrospective study focused on long-term outcomes and prognostic factors. Clin Neurol Neurosurg, 2018. 165: p. 1-6.
7.Ruda, R., et al., EANO guidelines for the diagnosis and treatment of ependymal tumors. Neuro Oncol, 2018. 20(4): p. 445-456.
8.Zhou, M., et al., Radiomics in Brain Tumor: Image Assessment, Quantitative Feature Descriptors, and Machine-Learning Approaches. AJNR Am J Neuroradiol, 2018. 39(2): p. 208-216.
9.Fink, J.R., et al., Multimodality Brain Tumor Imaging: MR Imaging, PET, and PET/MR Imaging. J Nucl Med, 2015. 56(10): p. 1554-61.
10.Tsitsia, V., et al., Multimodality-multiparametric brain tumors evaluation. Hell J Nucl Med, 2017. 20(1): p. 57-61.
11.Housni, A. and S. Boujraf, Multimodal magnetic resonance imaging in the diagnosis and therapeutical follow-up of brain tumors. Neurosciences (Riyadh), 2013. 18(1): p. 3-10.
12.Konstantinos Kamnitsas, L.C., Christian Ledig, Daniel Rueckert, and Ben Glocker,, Multi-Scale 3D CNNs for segmentation of brain Lesions in multi-modal MRI. proceeding of ISLES challenge, MICCAI 2015, 2015.
13.Herz, C., et al., , DCMQI: an Open Source Library for Standardized Communication of Quantitative Image Analysis Results Using DICOM. Cancer research, 2017. 77(21): p. e87-e90.
14.Chen, Q., et al., Decision Variants for the Automatic Determination of Optimal Feature Subset in RF-RFE. Genes (Basel), 2018. 9(6).
15.Gregorutti, B., Bertrand Michel, and Philippe Saint-Pierre. , Correlation and variable importance in random forests. Statistics and Computing, 2017. 27(3): p. 659-678.
16.Chawla, N.V., Bowyer, K. W., Hall, L. O., & Kegelmeyer, W. P. , SMOTE: synthetic minority over-sampling technique. Journal of artificial intelligence research, 2002. 16: p. 321-357.
Figures