0936
Commonality and complexity of systemic metabolic dysregulation caused by cancer and cancer-induced cachexia1Div. of Cancer Imaging Research, The Russell H. Morgan Dept of Radiology and Radiological Science, The Johns Hopkins University School of Medicine, Baltimore, MD, United States, 2Sidney Kimmel Comprehensive Cancer Center, The Johns Hopkins University School of Medicine, Baltimore, MD, United States, 3Radiation Oncology and Molecular Radiation Sciences, The Johns Hopkins University School of Medicine, Baltimore, MD, United States
Synopsis
In addition to anorexia, fat and muscle tissue wasting, psychological distress, lower tolerance to chemotherapy, and a poor quality of life, cachexia causes profound metabolic dysregulation in cancer patients that affects multiple organs. Here, for the first time, we have characterized metabolic changes in the spleen, liver, pancreas, lung, heart and kidney induced by pancreatic cancer xenografts to expand our understanding of the metabolic dysregulation caused by cachexia. These results highlight the systemic changes in metabolism that occur with cancer and with cancer induced cachexia that may lead to the development of early biomarkers as well to metabolic treatment strategies.
Introduction
Cancer induced cachexia is a multifactorial syndrome that results in unexplained weight loss in cancer patients. Cachexia occurs with high frequency in pancreatic cancer patients, resulting in morbidity and mortality, a low tolerance to chemotherapy, and overall treatment failure [1-3]. Cachectic patients experience a wide range of symptoms affecting the function of organs, such as muscle, liver, brain, and heart, causing significant morbidity [4]. Cachexia induced metabolic changes in body organs have not been previously investigated. Here, for the first time, we have characterized metabolic changes in spleen, liver, pancreas, lung, heart and kidney induced by pancreatic cancer xenografts to understand the metabolic dysregulation caused by cachexia.Methods
The non-cachexia inducing human pancreatic cancer cell line, Panc1, was established from a primary pancreatic ductal adenocarcinoma from a 56-year-old male patient and was obtained from ATCC. The cachexia inducing human pancreatic cancer cell line, Pa04C, provided by Dr. Maitra at the Johns Hopkins University School of Medicine, was isolated from a lung metastasis in a 59-year-old male patient with stage IV pancreatic adenocarcinoma [5]. Six to eight week old severe combined immunodeficient (SCID) male mice were used in these studies. Panc1 or Pa04C cells (2 × 10⁶ cells) in 50 μL of Hanks solution were injected into the right flank of mice. Control, cachectic and non-cachectic groups consisted of 10, 10 and 9 mice per group respectively. Mice with comparable Pa04C and Panc1 tumor volumes were sacrificed once tumors were ~ 500 mm3. Spleens, livers, pancreas, lungs, hearts and kidneys from tumor bearing mice, and normal mice of similar age, were harvested, freeze clamped and stored at -80°C for 1H MRS analysis. Snap frozen organs were powdered under liquid nitrogen, weighed, and dual phase extraction was performed, as described previously [5]. The aqueous phase was collected, evaporated under a stream of nitrogen, and lyophilized to remove the remaining water. Samples were reconstituted in 650 μl of 1x phosphate buffered D2O (90% D2O, 10% H2O, pH = 7.4) containing trimethylsilylpropionic acid (TSP), vortexed, centrifuged at 500g for 5 min at 4o C, and supernatants were subjected to 1H MRS analysis. Briefly, all 1H MR spectra were acquired at room temperature on a Bruker Avance III 750 MHz (17.6 T) MR spectrometer equipped with a 5 mm probe. All spectral acquisition, processing and quantification were performed using TOPSPIN 3.5 software. Areas under the peaks were integrated and normalized with respect to TSP as well as to the tissue weights used for dual phase extraction. Statistical analysis was performed using an unpaired one-tailed Students t-test.Results & Discussion
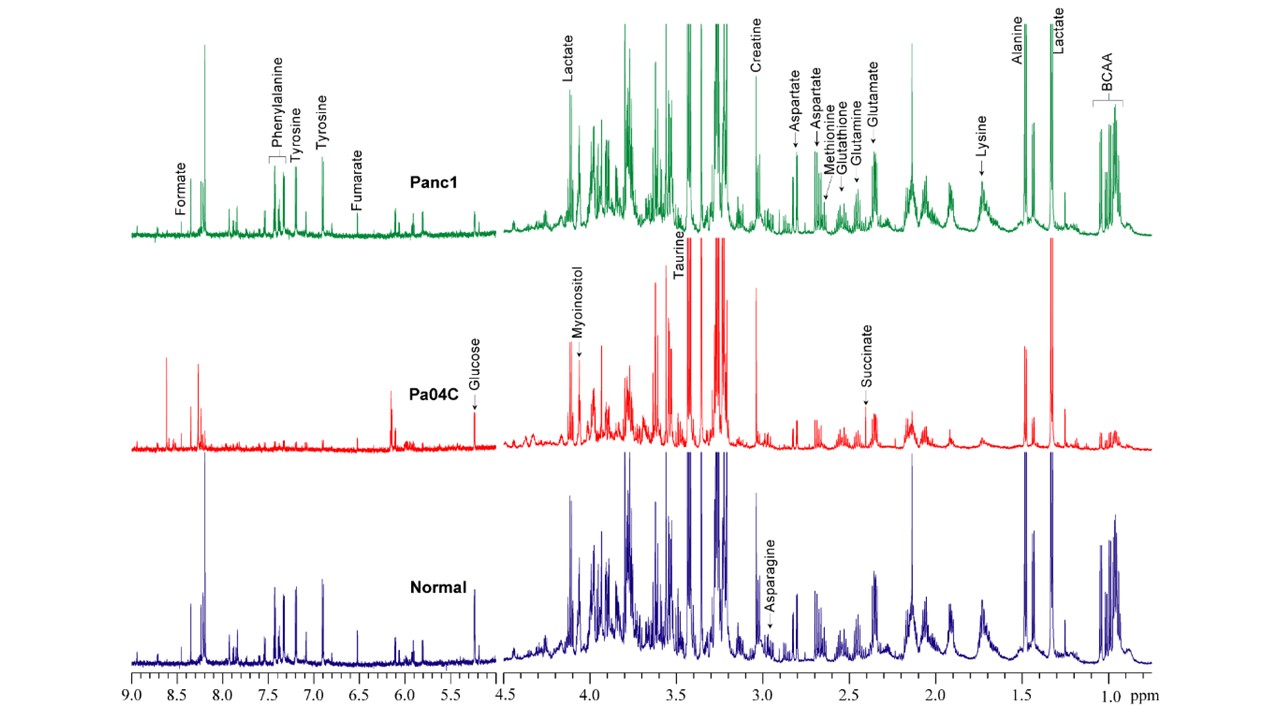
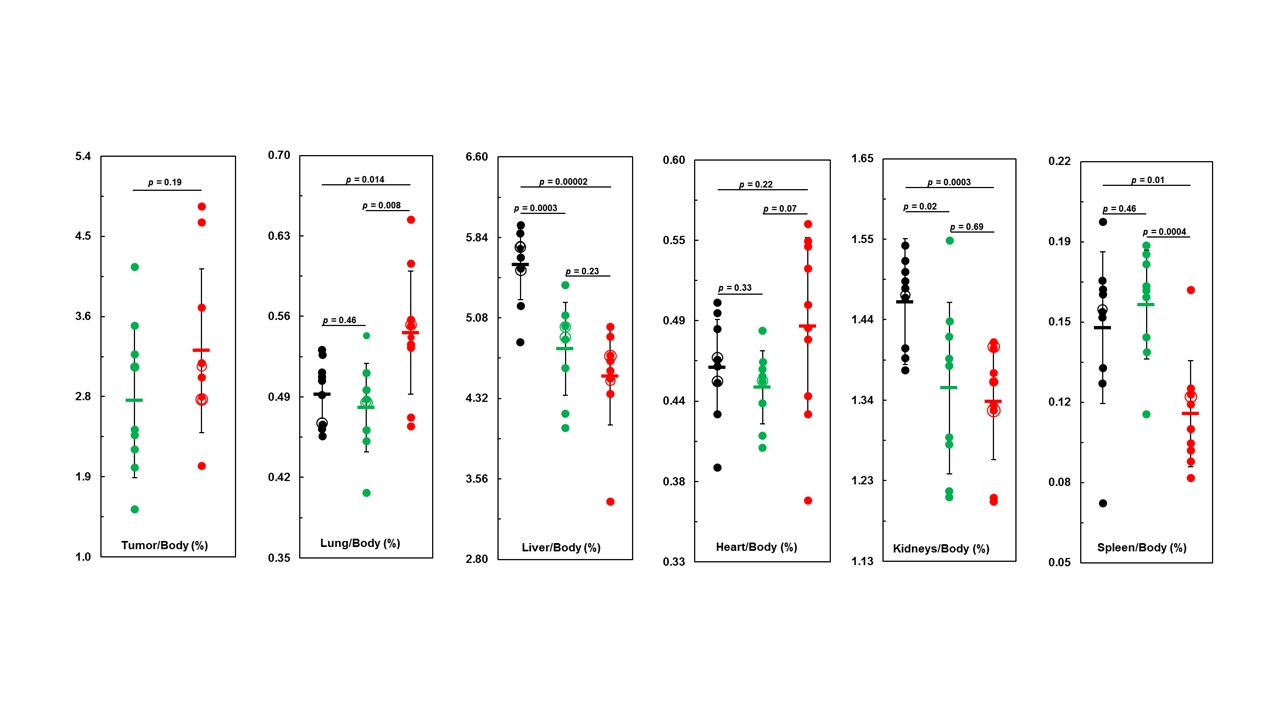
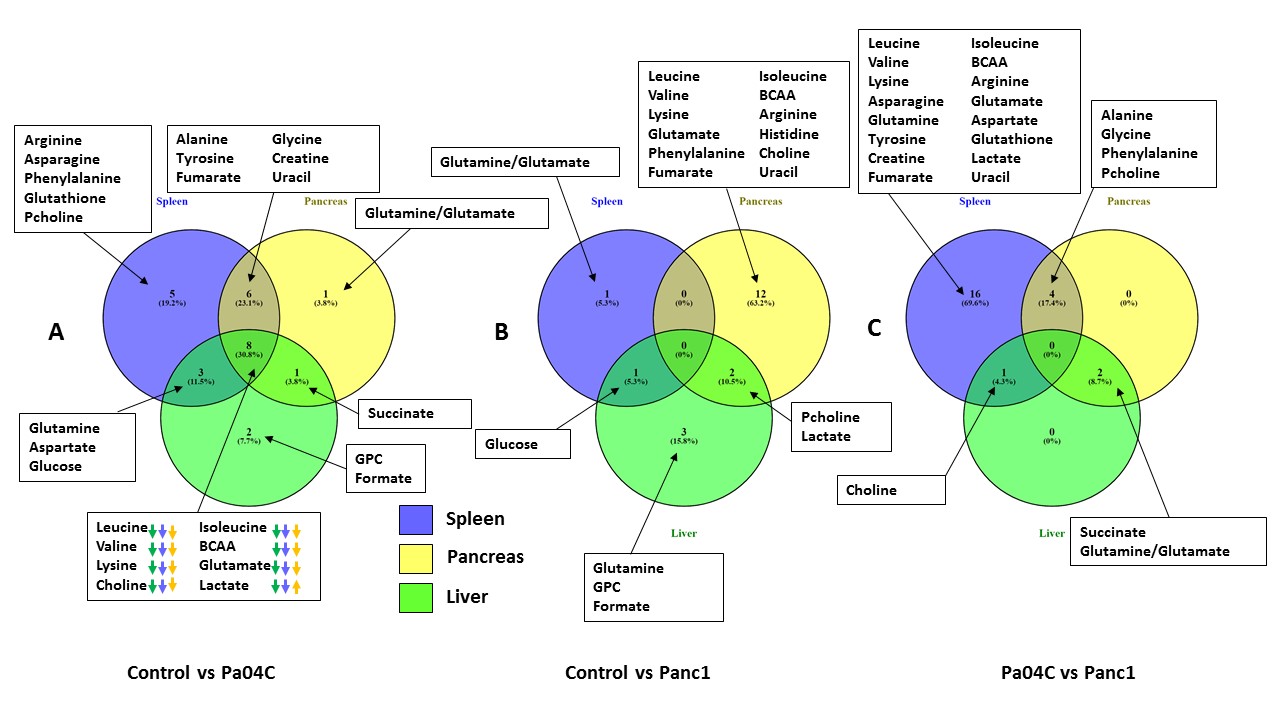
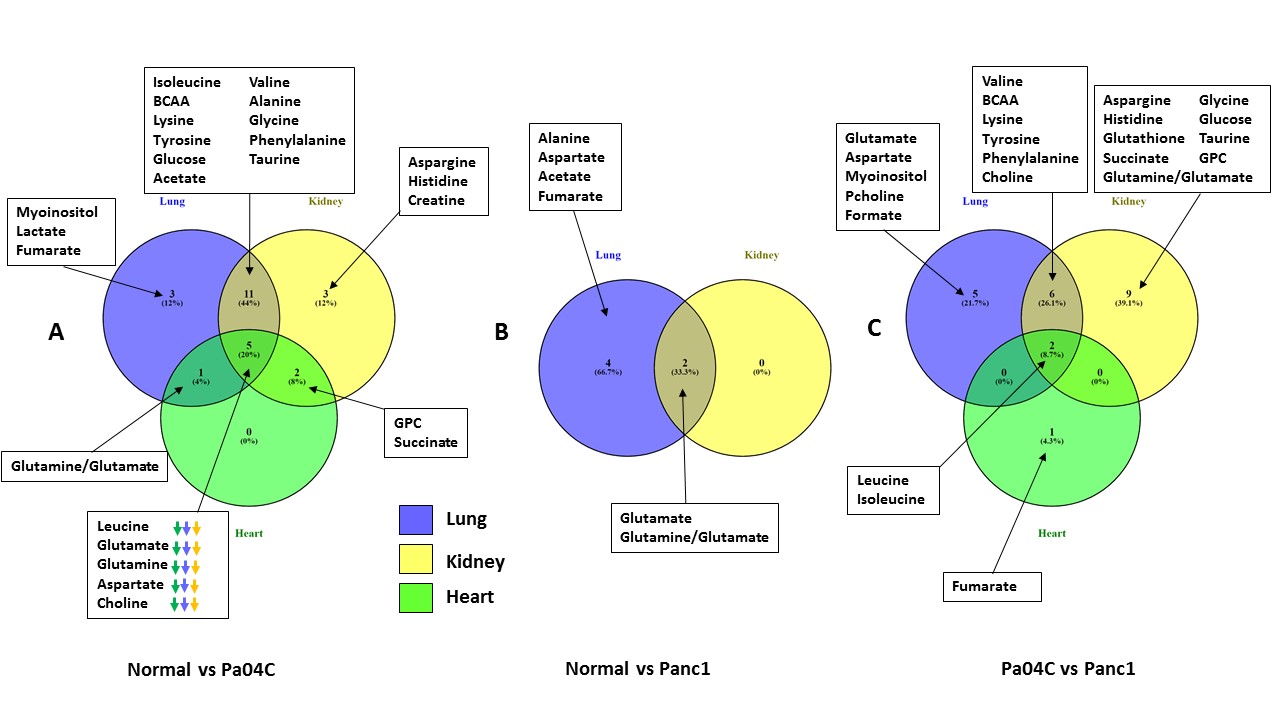
Representative high-resolution 1H MR spectra obtained from the spleens of normal mice, and from spleens of mice with Panc1 or Pa04C tumors, are shown in Figure 1. Cachexia-inducing Pa04C tumors induced significant weight loss in mice compared to Panc1 tumor bearing mice or normal mice as previously observed [6]. Weights of all the organs were significantly lower in cachexia inducing Pa04C tumor bearing mice (Figure 2). Non-cachexia inducing Panc1 tumors induced organ weight loss but to a lesser extent than Pa04C tumors, and not in the spleen. Quantitative analyses of small molecules like amino acids, organic acids, choline compounds, glucose, lactate were performed from the water phase extracts of all organs. Two separate Venn diagrams (Figures 3 and 4) were created to summarize the commonality and directionality of metabolic changes in organs from normal mice compared to Pa04C tumor bearing cachectic and Panc1 tumor bearing non-cachectic mice. All organs, including the heart, exhibited significant changes in metabolism with cachexia. The highest number of metabolite changes that were common to the spleen, pancreas and liver, and to the lung, kidney and heart were observed in the Pa04C versus normal organ comparisons. Glutamate, choline and leucine decreased in all the organs in Pa04C tumor bearing mice compared to organs from normal mice. Non-cachexia inducing Panc1 tumors also induced metabolic changes in organs, although not as pronounced. Our data clearly identified the adverse effects of pancreatic cancer‐induced cachexia on organ weight and metabolism, and highlighted the commonality as well as the complexity of systemic metabolic changes that can be induced by cancers.Acknowledgements
This work was supported by NIH R35CA209960 and R01CA193365.References
1. Fearon KC, Baracos VE: Cachexia in pancreatic cancer: new treatment options and measures of success. HPB (Oxford) 2010, 12(5):323-324.
2. Ozola Zalite I, Zykus R, Francisco Gonzalez M, Saygili F, Pukitis A, Gaujoux S, Charnley RM, Lyadov V: Influence of cachexia and sarcopenia on survival in pancreatic ductal adenocarcinoma: A systematic review. Pancreatology : official journal of the International Association of Pancreatology 2015, 15(1):19-24.
3. Argiles JM, Busquets S, Stemmler B, Lopez-Soriano FJ: Cancer cachexia: understanding the molecular basis. Nature reviews Cancer 2014, 14(11):754-762.
4. Inui A: Cancer anorexia-cachexia syndrome: current issues in research and management. CA Cancer J Clin 2002, 52(2):72-91.
5. Winnard PT, Jr., Bharti SK, Penet MF, Marik R, Mironchik Y, Wildes F, Maitra A, Bhujwalla ZM: Detection of Pancreatic Cancer-Induced Cachexia Using a Fluorescent Myoblast Reporter System and Analysis of Metabolite Abundance. Cancer Res 2016, 76(6):1441-1450.
6. Winnard Jr PT, Bharti SK, Sharma RK, Krishnamachary B, Mironchik Y, Penet M-F, Goggins MG, Maitra A, Kamel I, Horton KM et al: Brain metabolites in cholinergic and glutamatergic pathways are altered by pancreatic cancer cachexia. Journal of Cachexia, Sarcopenia and Muscle, n/a(n/a).
Figures