0934
Evaluating the utility of DCE-MRI in differentiating brain tumours using the extended Tofts and the Shutter Speed Model1Department of Molecular and Clinical Cancer Medicine, University of Liverpool, Liverpool, United Kingdom, 2Department of Neuroradiology, The Walton Centre NHS Foundation Trust, Liverpool, United Kingdom, 3Department of Neurosurgery, The Walton Centre NHS Foundation Trust, Liverpool, United Kingdom
Synopsis
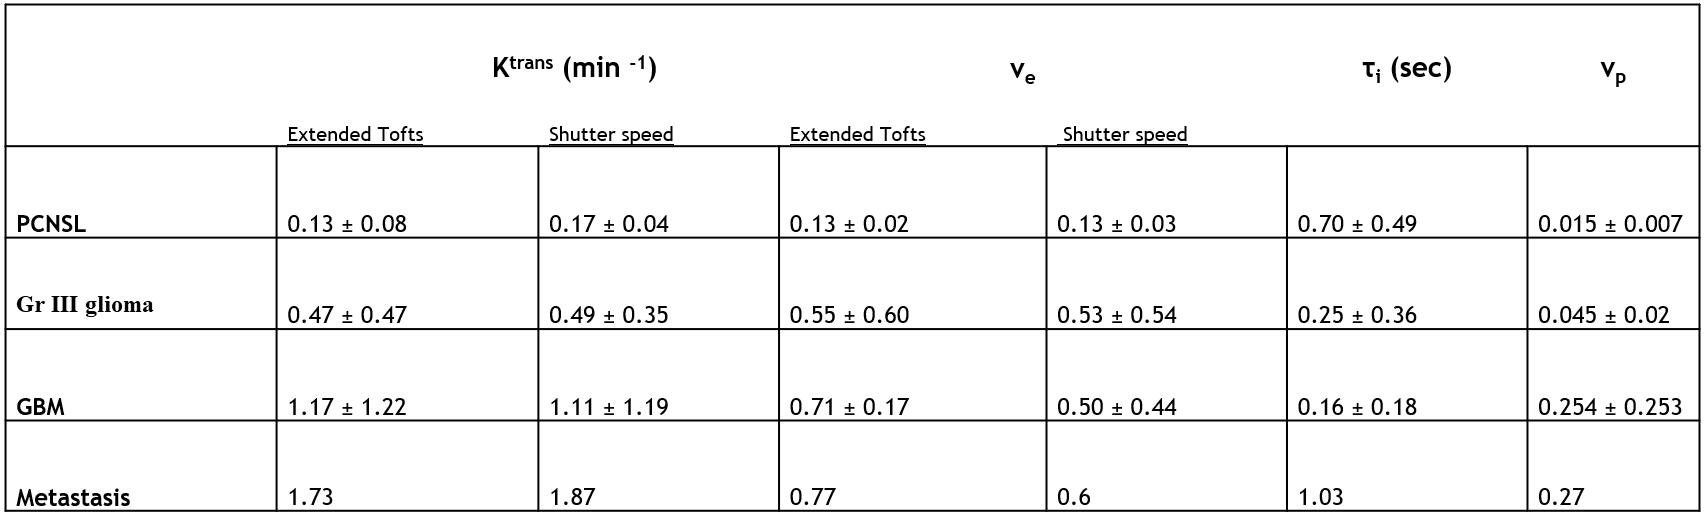
We demonstrate the potential utility of DCE-MRI derived pharmacokinetic parameters in differentiating brain tumour types using the extended Tofts and the Shutter Speed Model. Results show an increasing pattern in Ktrans, ve, vp estimates in GBM and metastasis compared to primary central nervous system lymphoma (PCNSL). The τi estimate in GBM was the lowest, while it was highest in PCNSL.
Introduction
The extended Tofts model1 is extensively used for pharmacokinetic modeling of DCE MRI data in tumours but does not account for the water exchange between the intra- and extracellular compartments. The Shutter Speed Model (SSM)2, on the other hand accounts for the water exchange and provides an additional parameter, the mean intracellular water molecule lifetime (τi), which has been suggested to reflect mitochondrial metabolism3 and has been shown to be a prognostic marker of overall survival in head and neck tumours4. Whilst surgery is the first line of treatment for most brain tumours, primary central nervous system lymphoma (PCNSL) can be treated with chemotherapy alone (but histological confirmation is required prior to treatment) and metastatic tumour patients have a different management strategy. Standard conventional imaging cannot reliably differentiate between these pathologies, and hence we evaluated the utility of differentiating tumour types using the extended Tofts and SSM derived DCE-MRI parameters.Methods
9 patients with brain tumours (PCNSL=4, Gr III glioma =2, Glioblastoma (GBM)=2 and Metastasis =1) were scanned on a 3 T Siemens Skyra scanner using: (1) a series of four 3D T1 VIBE sequence at multiple flip angles to measure T1, (2) a dynamic 3D T1 VIBE sequence to record the kinetics of the contrast agent. For the multiple flip angles study, a matrix of 192x192 with 80% sampling, FOV of 250 mm2, TR/TE = 5/1.78 ms, flip angles = 2, 7, 12, 15 degrees and 20 axial slices of 3.5 mm thickness were used. In the dynamic acquisition, TR/TE = 5/1.78 ms, 80 % sampling, and a 15 degree flip angle was used. Temporal resolution was 2.03 s per volume. T1 maps were generated by fitting the pixel-wise image intensities at the different flip angles using a non-linear least-square fitting based on Levenberg-Marquardt algorithm. The ROI for tumour region and arterial input function (AIF) was selected and segmented by an expert neuro-radiologist. DCE-MRI data was processed off-line using an in-house developed program written in Matlab. For parametric model analysis and parameter extraction, Ktrans, ve and vp were derived from extended Tofts model and Ktrans, ve, τi from SSM using non-linear least-square fitting based on Levenberg-Marquardt algorithm. For fitting the models, the initial values for the parameters were selected based on literature values5,6. A bi-exponential model fitting of the arterial input function was performed prior to kinetic model analysis.Results and Discussion
The model fitting is shown in Fig 1A and 1B in PCNSL, 1C and 1D in GBM using extended Tofts and shutter speed respectively, indicating a good fitting by both models. Fig 2(A-D) displays representative DCE-MRI images from a case each of PCNSLs, Gr III glioma, GBM and metastasis and parametric map (Ktrans) estimated using extended Tofts model. The box plots in Fig 2(E-G) and mean and standard deviation values of the parameters (Ktrans, ve and vp) reported in Table 1, show an increasing pattern from PCNSL to metastasis. These results were in contrast to previous studies, where significant increase in Ktrans, ve values were observed in PCNSL compared to GBM7,8. However, these values were not significantly different in our study probably due to the small sample size. A similar pattern, compared to extended Tofts, was observed in the SSM derived Ktrans and ve values as shown in box plots in Fig 3A, 3B and reported in Table 1. The τi value in GBM was the lowest, while it was highest in PCNSL as seen in box plots in Fig 3C and values reported in Table 1. A higher τi value was noted in metastasis case, but this is based on just one patient. The higher Ktrans values in GBM and metastatic tumours as well as Gr III gliomas, which are heterogenous and demonstrate increased permeability in comparison to the more homogenous PCNSL. In addition, the higher τi values in PCNSL compared to higher grade tumours probably reflects higher mitochondrial metabolism, and increased oxygen availability as well as perfusion, which may explain better chemosensitivity in PCNSL in comparison to GBM. The highest τi in the metastasis cannot readily be explained, more patients are required to evaluate this further.Conclusion
The results from this preliminary study demonstrate the potential utility of DCE-MRI derived pharmacokinetic parameters in differentiating brain tumour types.Acknowledgements
No acknowledgement found.References
- Tofts PS., et al. J Magn Reson Imaging, 1999. 10: p. 223-232.
- Yankeelov TE., et al. Magn Reson Med, 2003. 50: p. 1151-1169.
- Springer CS Jr., et al. NMR Biomed, 2014. 27: p. 760-773.
- Chawla S., et al. Am. J. Neuroradiol, 2018. 39: p. 138-144.
- Inglese M., et al. Neuroradiology, 2019. 61: p. 1375-1386.
- Li X., et al. Magn Reson Med, 2005. 54: p. 1351-1359.
- Xi YB., et al. Eur J Radiol, 2019. 112: p. 59-64.
- Lu S., et al. J Comput Assist Tomogr, 2017. 41: p. 898-903.
Figures
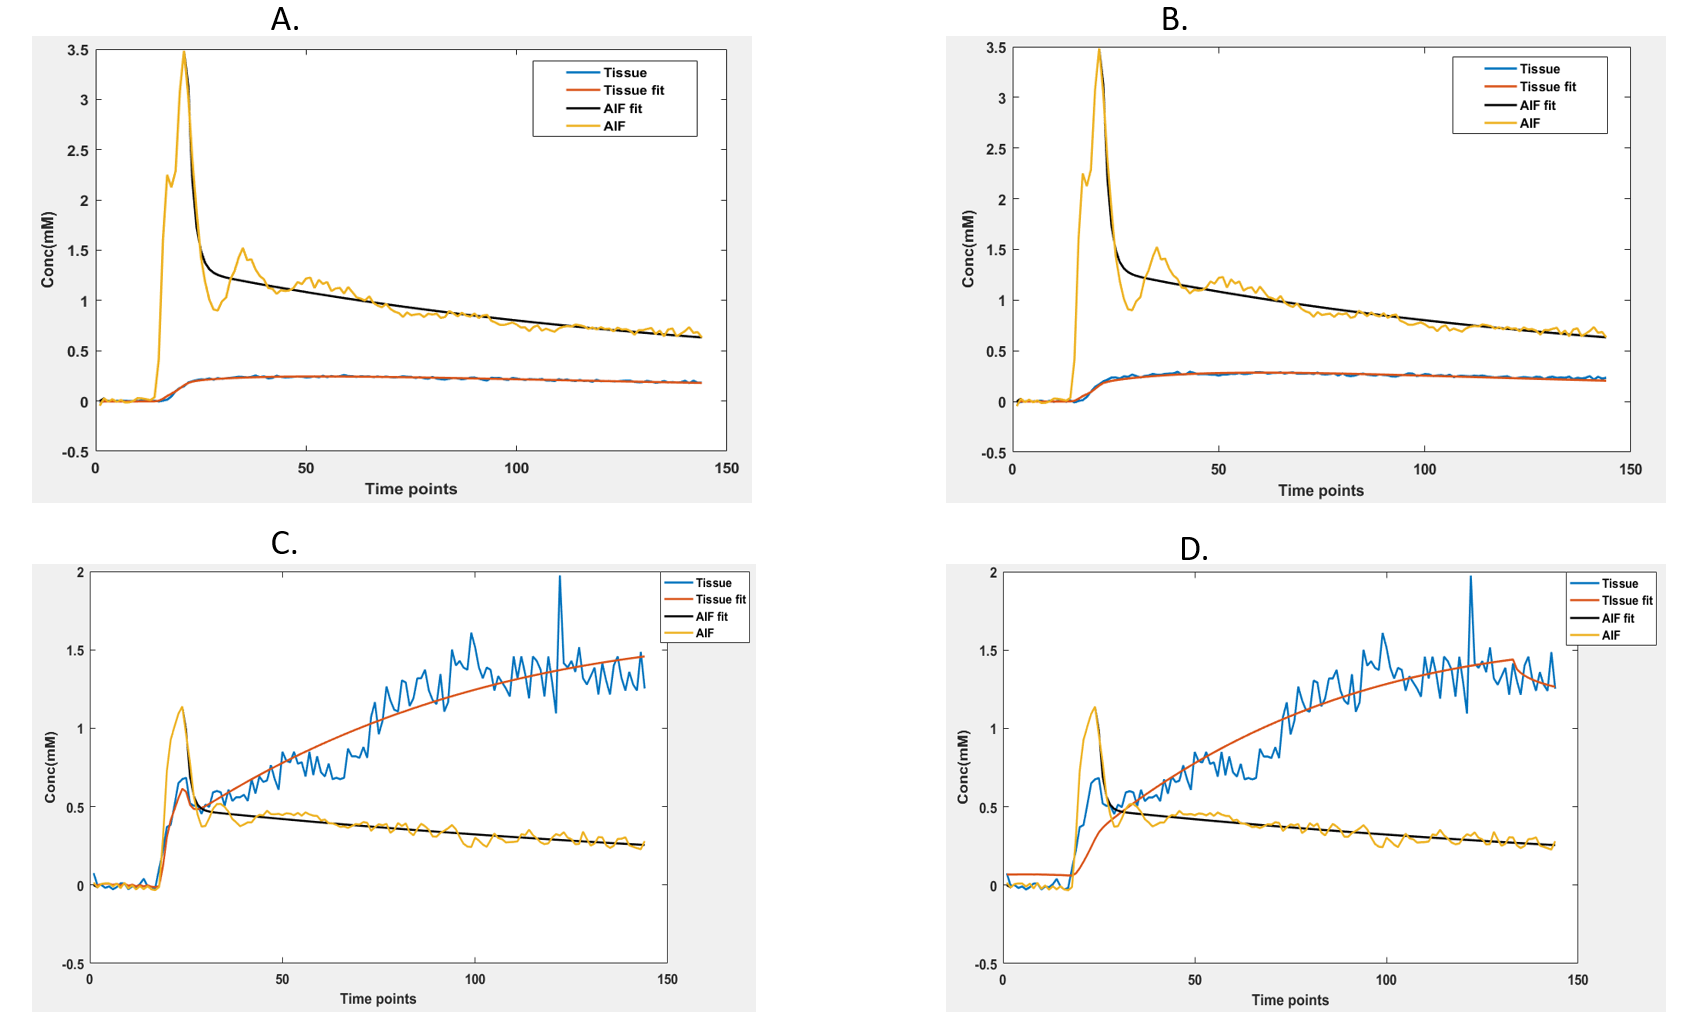
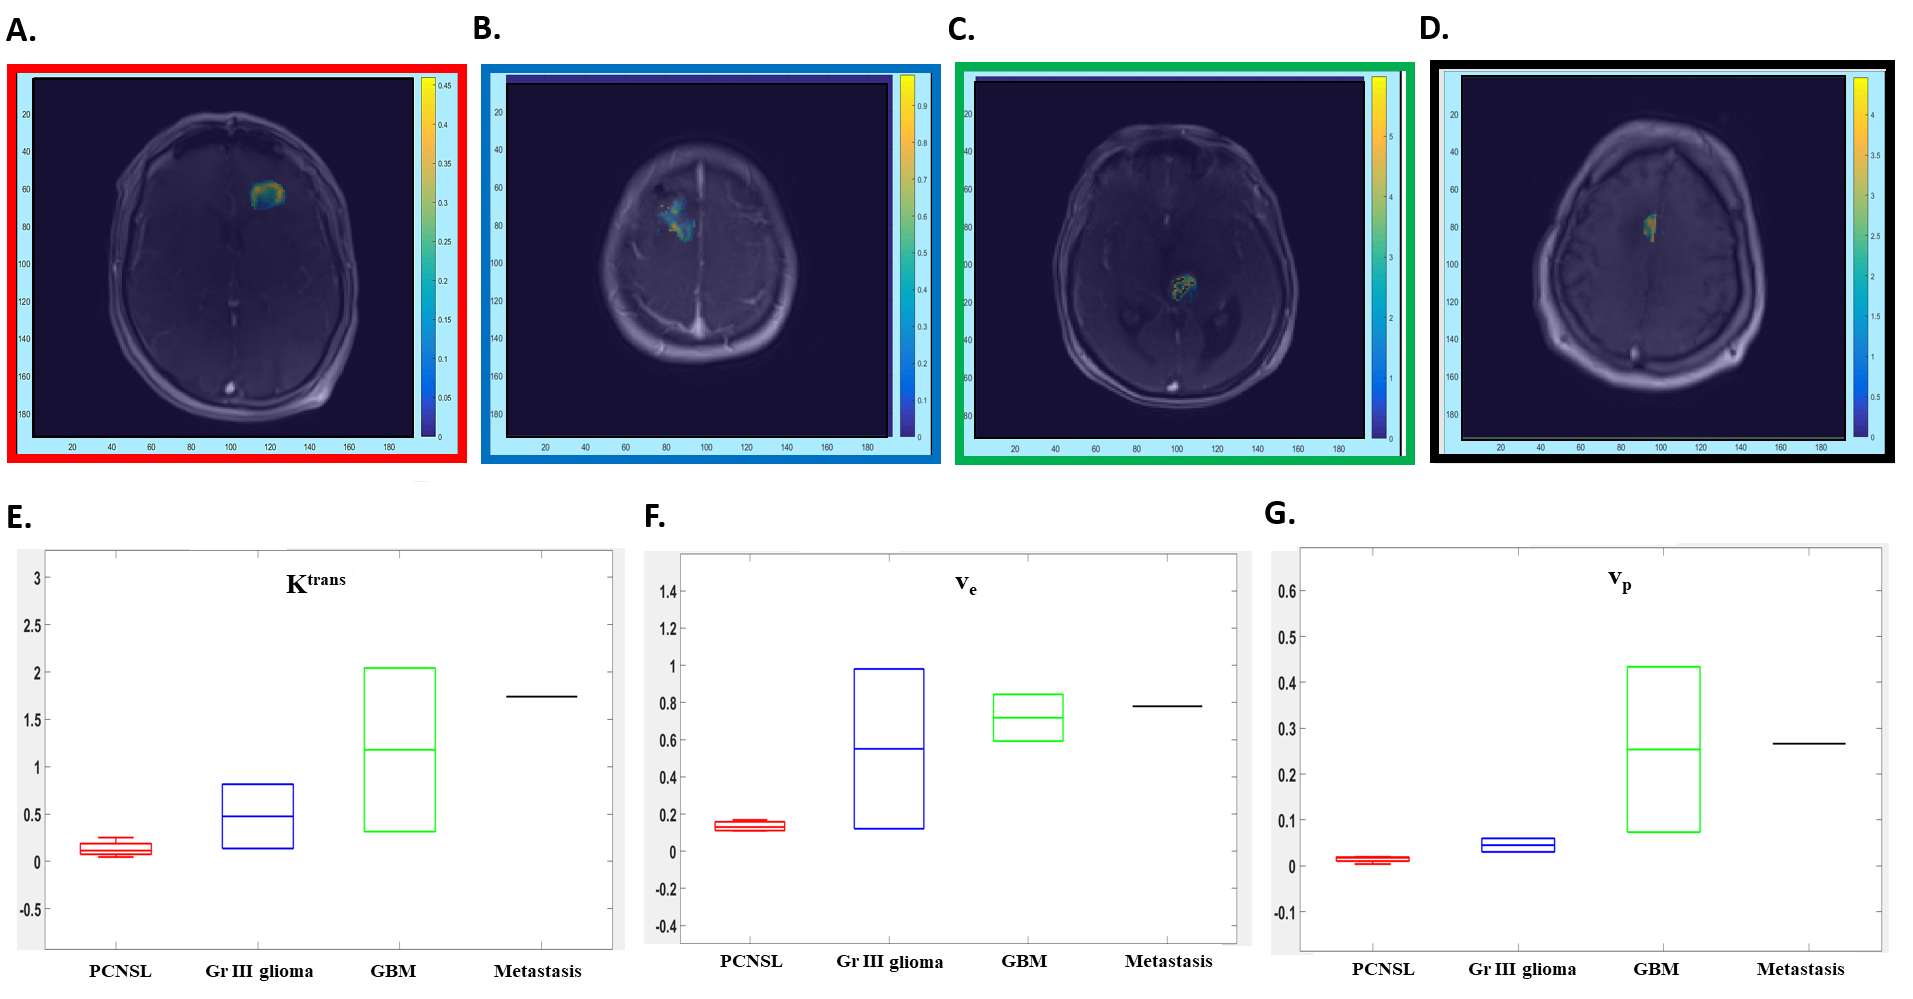
Fig 2: Ktrans maps from the extended Tofts model from a patient with PCNSL (A), Gr III Glioma (B), GBM (C) and Metastasis (D). Box plots demonstrating the Ktrans (min-1, E), ve (F) and vp (G) values using extended Tofts model demonstrate highest values in metastasis, while PCNSL patients demonstrate lower values.
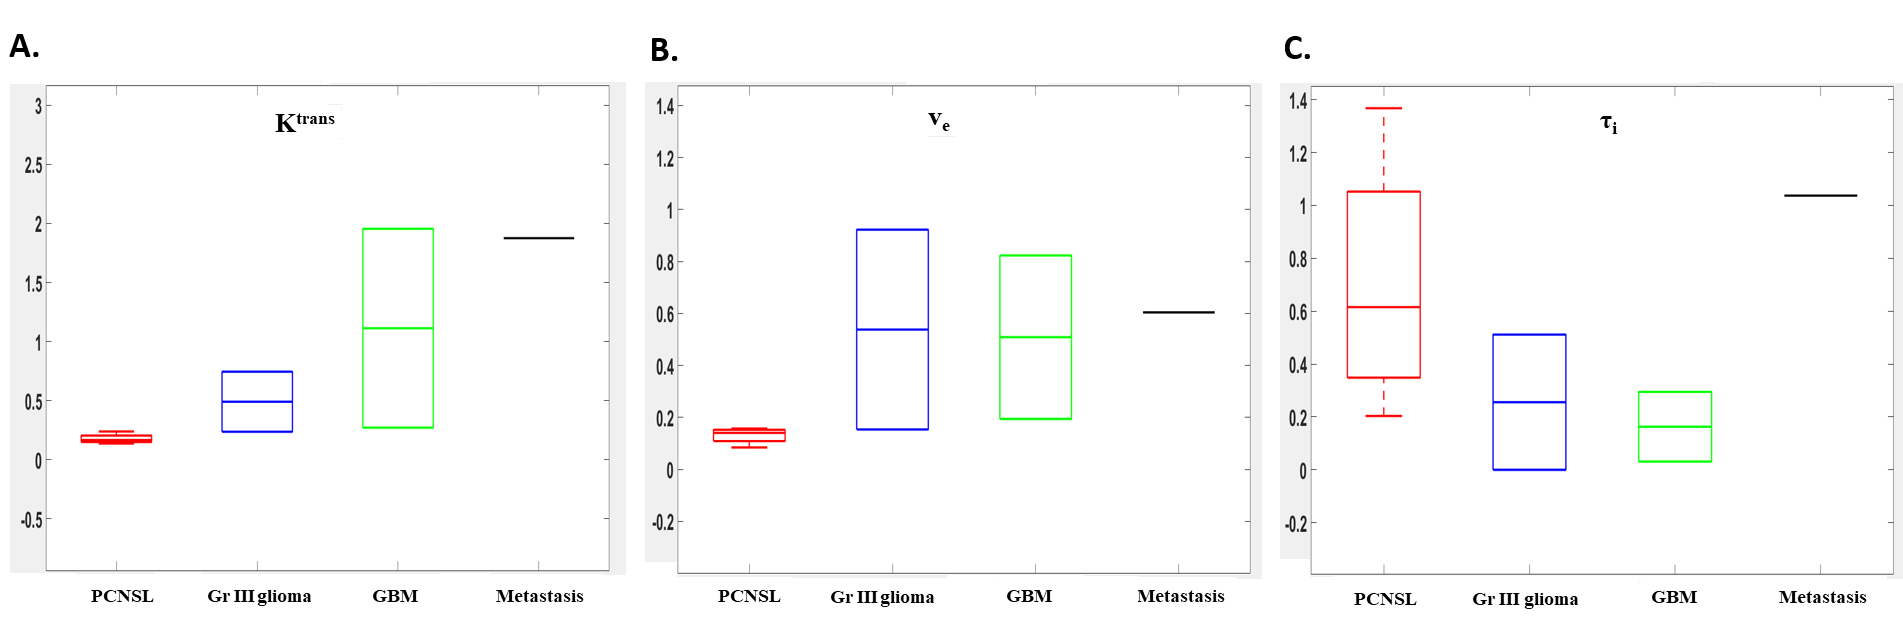
Fig 3: Box plots demonstrating the Ktrans (min-1, A), ve (B) values using shutter speed model demonstrate highest values in metastasis, while PCNSL patients demonstrate lower values. τi (sec, C) values were highest in PCNSL, while GBM patients demonstrate lower values.