0932
Glioma Genetic Diagnosis Software for Detection of IDH and TERTp Mutations based on 1H MR Spectroscopy and Mass Spectrometry1Institute of Biomedical Engineering, Bogazici University, İstanbul, Turkey, 2Electrical and Electronics Engineering, Bogazici University, Istanbul, Turkey, 3Center for Neuroradiological Applications and Reseach, Acibadem Mehmet Ali Aydinlar University, Istanbul, Turkey, 4Department of Medical Biochemistry, Acibadem Mehmet Ali Aydinlar University, Istanbul, Turkey, 5Department of Medical Pathology, Acibadem Mehmet Ali Aydinlar University, Istanbul, Turkey, 6Department of Medical Engineering, Acibadem Mehmet Ali Aydinlar University, Istanbul, Turkey, 7Department of Molecular Biology and Genetics, Acibadem Mehmet Ali Aydinlar University, Istanbul, Turkey, 8Department of Neurosurgery, Acibadem Mehmet Ali Aydinlar University, Istanbul, Turkey, 9Department of Radiology, Acıbadem Mehmet Ali Aydinlar University, Istanbul, Turkey
Synopsis
Glioma Genetic Diagnosis Software, a clinical decision support tool for non-invasive detection of isocitrate dehydrogenase (IDH) and telomerase reverse transcriptase promoter (TERTp) mutations in gliomas using proton magnetic resonance spectroscopy (1H-MRS) and liquid chromatography-mass spectrometry (LC-MS/MS), was developed in this study. The machine-learning models were trained with the data of 237 gliomas. IDH mutation was identified with 87.04% and of 92.70% accuracies, and TERTp mutation in IDH wildtype gliomas was identified with 87.53% and 85.96% accuracies, using 1H-MRS and MS, respectively. The software provides data visualization and enables the users to train their own models.
Introduction
Genetic alterations of gliomas, especially isocitrate dehydrogenase (IDH) and telomerase reverse transcriptase promoter (TERTp) mutations, result in different clinical behavior and survival rates [1-3]. Several studies have proposed to predict these alterations non-invasively using proton magnetic resonance spectroscopy (1H-MRS) and showed that some metabolite concentrations, such as, 2-hydroxyglutarate (2HG), glycine (Glyc), glutathione (GSH), choline (Cho), and glutamine-glutamate complex (Glx), provide information about IDH and TERTp mutations in gliomas [4-7]. This study aims to develop a machine-learning-based clinical decision support tool for non-invasive detection of glioma molecular subtypes based on IDH and TERTp mutations using the metabolite concentrations measured by 1H-MRS and liquid chromatography-mass spectrometry (LC-MS/MS).Methods
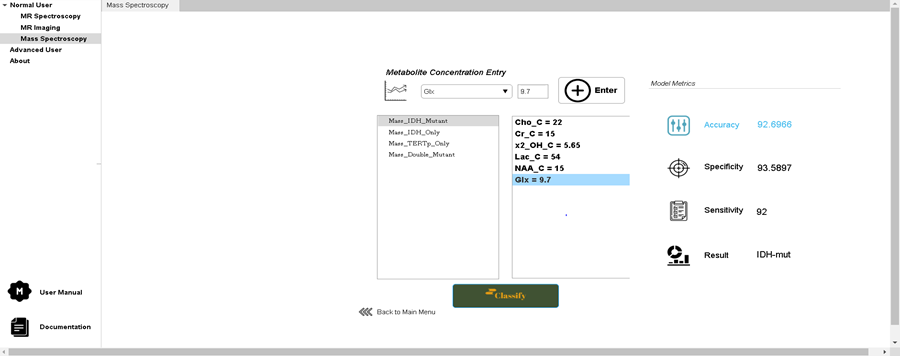
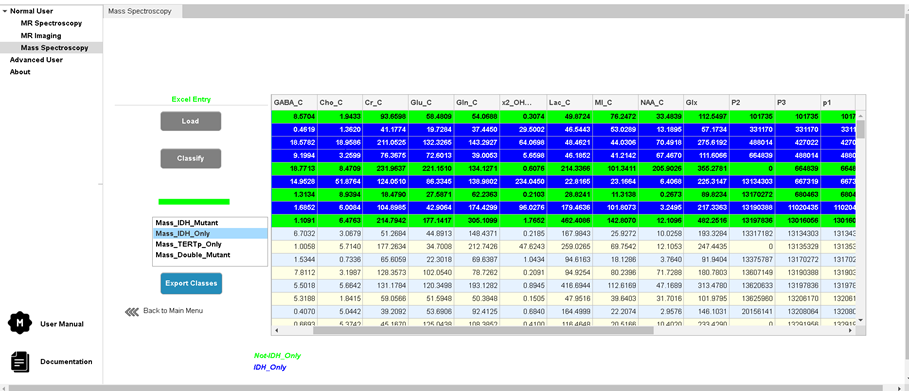
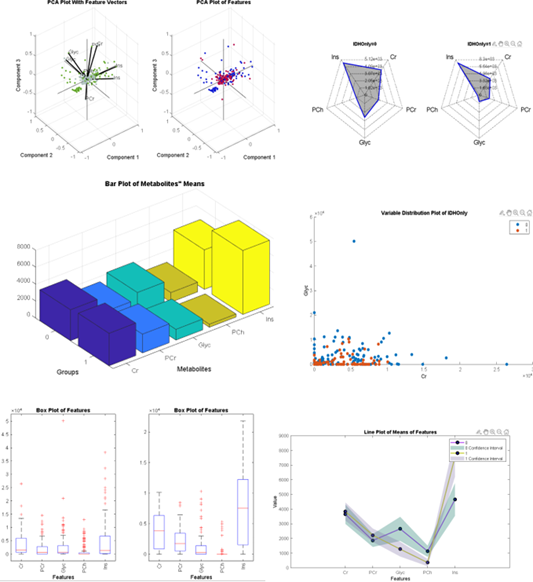
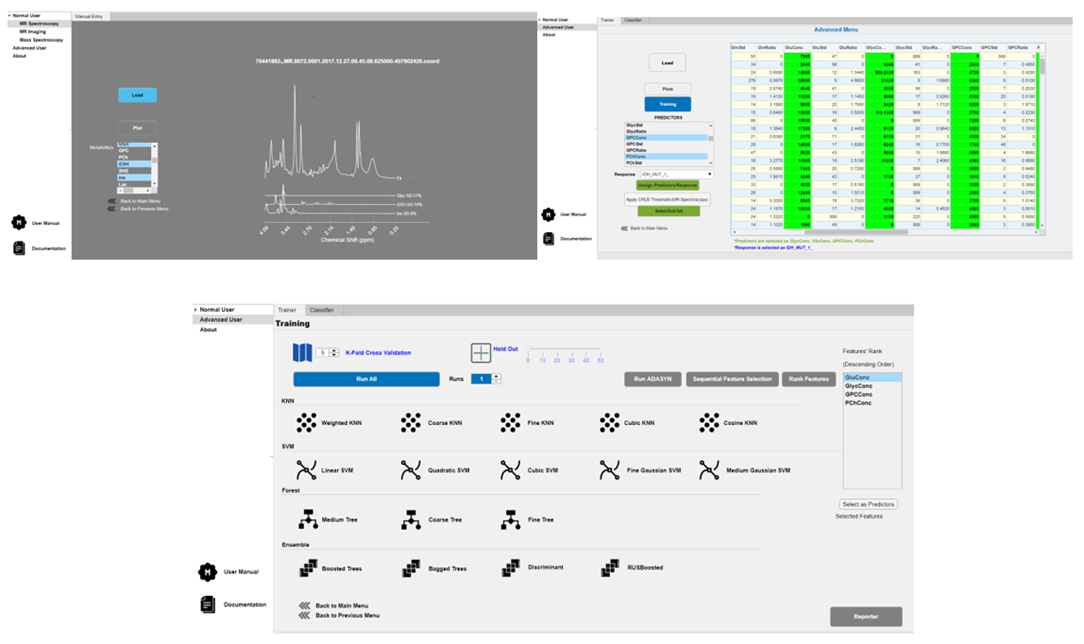
Glioma Genetic Diagnosis Software was designed using MATLAB 2020a (The MathWorks Inc. Natick, MA) comprising of two main sections: ‘Normal User’ and ‘Advanced User’. Within the Normal User part, there are two modules: the MRS and MS module. While five embedded machine-learning models were trained with metabolite peak concentrations or their ratios to total creatine in the MRS module, four embedded machine-learning models were trained with metabolite peak concentrations in the MS module. When training the default models, adaptive synthetic sampling (ADASYN) [8] was used to overcome imbalanced dataset problem when necessary. Both of the modules allow the users to classify their datasets based on IDH and TERTp mutations using these default models. The users could load their data to the modules either by ‘Manual Entry’(Figure 1) or ‘Excel Entry’(Figure 2). There is also ‘LCModel Entry’ in the MRS module which reads the analysis outputs created by LCModel. After loading the input data, six different types of visualizations are provided: variable plot, radar plot, bar plot, box plot, line plot, and 2D/3D PCA plot (Figure 3). Figure properties such as title, colors, fonts, etc. can be manipulated and the figures can be exported with up to 600 DPI. The Advanced User mode was designed for users to generate their own models using custom datasets provided as Excel™ files. Advanced user module has feature selection, classification with seventeen well-known machine learning algorithms, synthetic data generation with ADASYN, and multiple execution functionality (Figure 4). User-developed models can be saved for further use. The tool was compiled as a standalone application using MATLAB 2020a (The MathWorks Inc., Natick, MA), and can run on three major operating systems: Windows, Linux, and Mac. Glioma Genetic Diagnosis Software was tested on retrospective 1H-MRS and MS data of 237 glioma patients (142M/95F, mean age: 44.68±14.11 years, range: 20-84 years). The patients were scanned before surgery at a 3T Siemens Prisma scanner (Erlangen, Germany) using a 32-channel head coil. 1H-MRS data were acquired from the solid tumor region excluding necrosis, edema, and hemorrhage using a Point Resolved Spectroscopy (PRESS) sequence (TR/TE=2000/30 ms, voxel size=1-8 cm3). TERTp and IDH1 or IDH2 (IDH1/2) mutations in the tissue were determined by either minisequencing or Sanger sequencing. LCModel spectral fitting program [9] was used for quantification of eighteen different metabolite concentrations, including creatine (Cr), Cho, glutamate (Glu), N-acetyl aspartate (NAA), myo-inositol (mIns), 2HG, and lactate (Lac). These metabolites were also determined with Triple Quadrupole MS applied on the surgical specimen of 178 patients from this cohort. The results were used to train machine-learning models using the software, and performance metrics were evaluated for determining the presence of IDH (IDH-mut) and TERTp (TERTp-mut) mutations, and predicting patients who were IDH-mut but TERTp wildtype (IDH-only), TERTp-mut but IDH wildtype (TERTp-only), and double mutant.Results
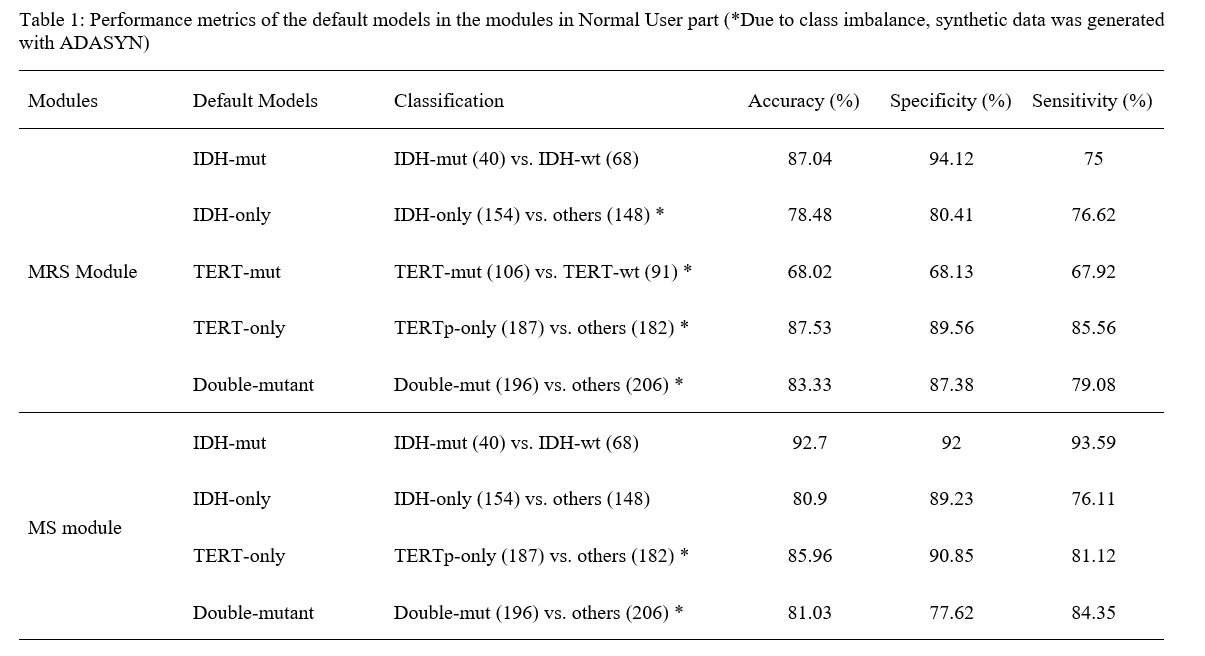
Table 1 shows the performance results of the default models for the 1H-MRS and MS data from the Normal User option. Among the 1H-MRS models, the IDH mutation detection model resulted in an accuracy of 87.04%, while the accuracy of the IDH-only model was 78.48%. TERTp-mut and TERT-only models achieved 68.02% and 87.53% accuracies, respectively. The double-mutant model resulted in an accuracy of 83.33%. Among the MS models, the IDH-mut model resulted in the highest accuracy of 92.70%, while the accuracy of the IDH-only model was 80.90%. For MS data, TERT-only and double-mutant models resulted in 85.96% and 81.03% accuracies, respectively.Discussion and Conclusion
A clinical decision support tool, named Glioma Genetic Diagnosis Software, for non-invasive detection of IDH and TERTp mutations in gliomas using 1H-MRS and LC-MS/MS data, is presented in this study. The input data types will be extended for enabling the use of spectral fitting programs other than LCModel. The Glioma Genetic Diagnosis Software will be distributed at the end of 2020, with improvements in future versions guided by user’s feedback.Acknowledgements
This project was funded by TUBITAK 1003 project 216S432.References
1.Eckel-Passow, J.E., et al., Glioma Groups Based on 1p/19q, IDH, and TERT Promoter Mutations in Tumors. N Engl J Med, 2015. 372(26): p. 2499-508.
2.Ogura, R., et al., Immunohistochemical profiles of IDH1, MGMT and P53: practical significance for prognostication of patients with diffuse gliomas. Neuropathology, 2015. 35(4): p. 324-35.
3.Takano, S., et al., Immunohistochemistry on IDH 1/2, ATRX, p53 and Ki-67 substitute molecular genetic testing and predict patient prognosis in grade III adult diffuse gliomas. Brain Tumor Pathol, 2016. 33(2): p. 107-16.
4.Ozturk-Isik, E., et al., Identification of IDH and TERTp mutation status using 1H‐MRS in 112 hemispheric diffuse gliomas. Journal of Magnetic Resonance Imaging, 2019. 51.
5.Andronesi, O.C., et al., Detection of 2-hydroxyglutarate in IDH-mutated glioma patients by in vivo spectral-editing and 2D correlation magnetic resonance spectroscopy. Sci Transl Med, 2012. 4(116): p. 116ra4.
6.Choi, C., et al., 2-hydroxyglutarate detection by magnetic resonance spectroscopy in IDH-mutated patients with gliomas. Nat Med, 2012. 18(4): p. 624-9.
7.Nagashima, H., et al., Diagnostic value of glutamate with 2-hydroxyglutarate in magnetic resonance spectroscopy for IDH1 mutant glioma. Neuro Oncol, 2016. 18(11): p. 1559-1568.
8.Haibo, H., et al. ADASYN: Adaptive synthetic sampling approach for imbalanced learning. in Conference Proceedings of 2008 IEEE International Joint Conference on Neural Networks (IEEE World Congress on Computational Intelligence). 2008. p. 1322-1328.
9.Provencher, S.W., Automatic quantitation of localized in vivo 1H spectra with LCModel. NMR Biomed, 2001. 14(4): p. 260-4.
Figures