0931
Metabolomic Characterization of renal cell carcinoma patient-derived xenografts and derived Tissue Slice Cultures1Department of Radiology and Biomedical Imaging, University of California, San Francisco, San Francisco, CA, United States, 2Department of Urology, Stanford University, Stanford, CA, United States
Synopsis
NMR based stable isotope resolved metabolomics was used for the metabolic characterization of renal cell carcinoma (RCC) patient-derived xenografts (PDXs) and their derived tissue slice cultures (TSCs). Targeted metabolomics and [U-13C] glucose-labeling studies indicate metabolic heterogeneity among PDXs of various pathologic and clinical stages. Both PDXs and TSCs exhibit high glycolytic rate and low TCA activity characteristic of RCC. However, there is variability in glycolytic rate and TCA activity among different PDXs and their corresponding TSCs.
Purpose
Renal cell carcinoma (RCC) is the most common type of kidney cancer and one of the top 10 malignancies in the United States1. Predictive preclinical models of RCC are needed for improving the diagnosis, prognosis and treatment management of RCC. Dysregulated metabolism is strongly implicated in the development and progression of RCC2, however, the metabolic profile of preclinical models has not been investigated thoroughly. Thus, the present study focused on metabolic profiling of patients derived preclinical RCC models including patient-derived xenografts (PDXs) and tissue slice cultures (TSCs) using NMR based stable isotope resolved metabolomics.Methods
PDX model: Four RCC PDXs (PDX054, PDX047, PDX068 and PDX072) were established from a fresh sample of a clear cell RCC primary tumor implanted under the subrenal capsule of RAG2-/-γC-/- mice. PDX tumors were grown to ~0.8 cc for [U-13C] glucose labeling studies (n=3). For labeling, [U-13C] glucose was injected into the tail vein of host mice every 15 minutes for a total labeling time of 45 minutes3. Tumor tissue was collected and flash-frozen in liquid nitrogen.TSCs: Second generation PDX tumors were precision-cut into thin (300-micron thick, 8-mm diameter) slices using Krumdieck slicer and were cultured in an atmospheric incubator (20% oxygen) in specialized medium overnight for at least 12 hrs prior to 13C-glucose labeling4. For labeling, TSCs were cultured in specialized medium supplemented with 25 mM [1,6-13C2] glucose for 2 hrs and then flash-frozen.
Metabolite Extraction: Metabolites were extracted using cold methanol:water:chloroform5 and the aqueous fraction was isolated, lyophilized, and resuspended in D2O with TSP.
NMR: NMR spectra were acquired on an 800 MHz Bruker Avance I equipped with a 5-mm triple resonance TXI cryo-probe. 1H presaturation with 13C decouling: α=90, TD=24k, SW=15 ppm, TR=12 seconds, AQ=0.5 seconds, NS=32. Water signal was suppressed using a presaturation pulse. 1H-13C HSQC: A phase- sensitive 2D HSQC (hsqcgpph) with no 13C decoupling during acquisition was used with the following parameters: TD=2048x4096, SW=6x120 ppm, TR=1.5 seconds, AQ = 0.297 seconds, NS=2.
Metabolite Quantification: Steady state concentrations of 26 metabolites were quantified from 13C-decoupled 1H presaturation spectra of 13C-labeled tissue extracts using Chenomx NMR Suite 7.5 software. The concentration of 13C-labeled metabolites was quantified from 1H-13C HSQC using TopSpin (version 3.5). Fractional enrichment (FE) was quantified as [13C-labeled metabolite] HSQC/[total metabolite]{13C}1H.
Chemometric analysis was performed on the steady state concentration of metabolites using the MetaboAnalyst 4.0 web server. 13C Isotopomer modeling of [U-13C] glucose-labeled tissues were performed using tcaCALC software (download available at http://www.invivometabolism.org/tca.html).
Results
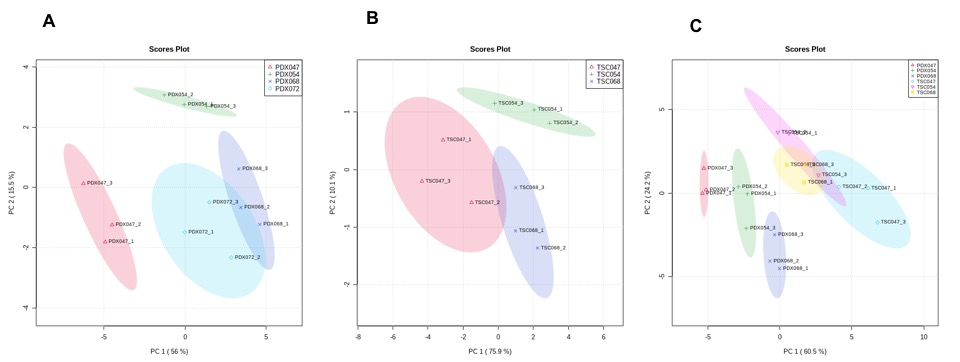
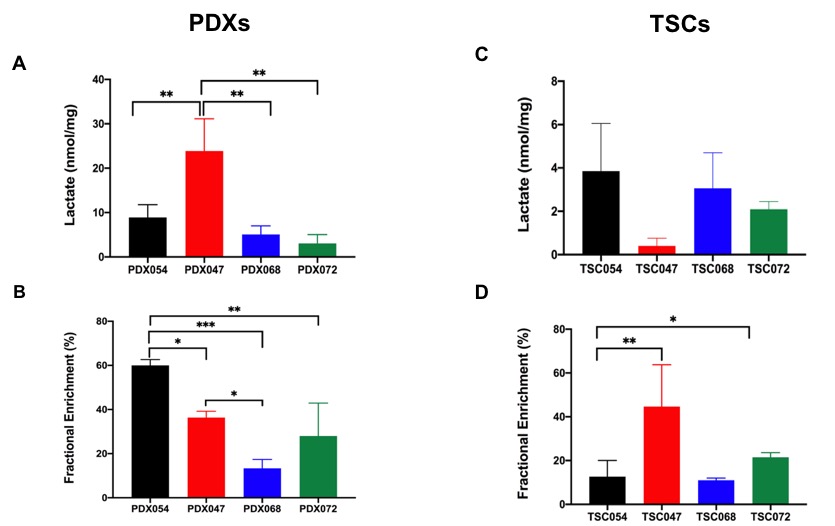
The unsupervised Principal Component Analysis (PCA) plot showed distinct clustering among individual PDXs (R2 = 0.95 and Q2=0.90, Figure1A) and TSCs (R2 = 0.96 and Q2=0.87, Figure1B). These results indicated PDXs and TSCs of different pathological and clinical stages have distinct metabolic profile. Further, PCA score plot showed clear discrimination of PDXs from TSCs suggesting that the metabolic profile of the TSCs are different from their corresponding PDXs (Figure 1C).Figure 2 shows comparison of steady state lactate concentration and lactate FE among PDXs and TSCs. Although the steady state lactate concentration is similar across PDXs, except PDX047, the glycolytic rate determined by FE was significantly different among the PDXs (Figure 2A,2B). Steady state lactate concentration and FE are more similar among TSCs except for the FE of TSC054 which is significantly different from TSC047 and TSC072 (Figure 2C,2D).
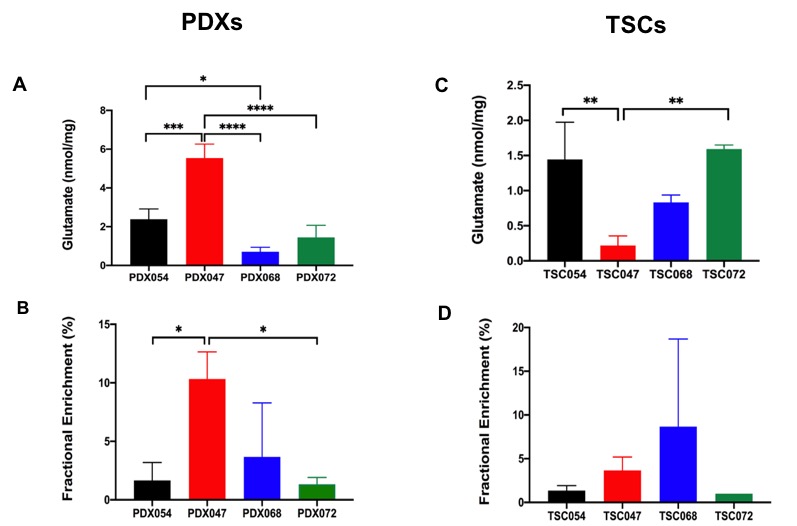
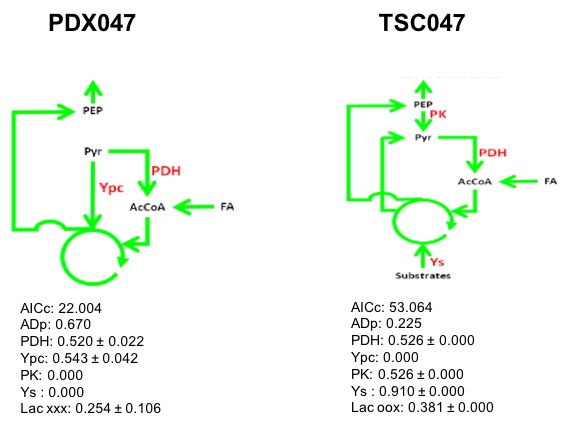
We also compared the steady state glutamate concentration and glutamate FE in PDXs and TSCs. Generally, both the glutamate steady state level and FE were similar among PDXs and TSCs except that PDX047 which was higher than other PDXs, while TSC047 was lower than other TSCs (Figure 3). Further, 13C isotopomer modeling was performed on PDX047 and TSC047 labeled with [U-13C] glucose using tcaCALC. The tcaCALC model fit illustrated that the glucose flux through TCA cycle is different between PDX047 and TSC047 (Figure 4).
Discussion & Conclusion
NMR based stable isotope resolved metabolomics was used to characterize the metabolic profile of patient-derived RCC preclinical models (PDXs and TSCs) that had previously not been characterized nor directly compared with one another. Targeted metabolomics results indicated metabolic heterogeneity among PDXs of various pathologic and clinical stages. The [U-13C] glucose-labeling studies showed that the majority of glucose is converted to lactate via glycolysis and very little glucose is converted to glutamate via TCA cycle in RCC. However, there is variability in glycolytic rate and TCA activity among different PDXs and their corresponding TSCs. Future studies will determine the microenvironmental and biochemical changes to better understand the metabolic differences between PDXs and TSCs.Acknowledgements
This work has been supported by the NIH P41EB013598 and NIH U01CA217456 grants.References
[1] R. L. Siegel, K.D. Miller and A. Jemal, A. Cancer statistics, 2019. CA: A Cancer Journal for Clinicians,2019, 69, 7–34 (2019).
[2] H.I. Wettersten, A.A. Hakimi, D. Morin, C. Bianchi, M.E. Johnstone, D.R. Donohoe, J.F. Trott, O.A. Aboud, S. Stirdivant, B. Neri, R. Wolfert, B. Stewart, R. Perego, J.J.Hsieh, R.H. Weiss, Cancer Research, 2015,75, 2541–2552.
[3] N. Lane, J. Yan and T. W. M. Fan, Bio-protocol, 2015, 5.
[4] R. Sriram, M. Van Criekinge, J. D. Santos, K. R. Keshari, D. M. Wilson, D. Peehl, J. Kurhanewicz and Z. J. Wang, Tomography, 2016, 2, 35–42.
[5] K. Glunde, Z. M. Bhujwalla and S. M. Ronen, Nature Reviews Cancer, 2011, 11, 835–848.
Figures