0928
MRS based biomarkers of IDH1 mutant glioma response to the BAY-1436032 IDH inhibitor1Department of Radiology and Biomedical Imaging, University of California, San Francisco, San Francisco, CA, United States, 2Department of Neurological Surgery, University of California San Francisco, San Francisco, CA, United States, 3Brain Tumor Research Center, University of California San Francisco, San Francisco, CA, United States
Synopsis
Mutant IDH1 inhibitor treatment is currently in clinical trials for glioma patients. However, to date, treatment does not result in tumor shrinkage. Therefore, in vivo biomarkers are needed to assess early therapeutic response. Here we treated mutant IDH1-expressing cells with the emerging inhibitor BAY-1436032. Using 1H MRS we found a significant decrease in 2-hydroxyglutarate that was accompanied by an increase in glutamate and phosphocholine, and using 13C MRS we detected a significant increase in glutamate produced from hyperpolarized [1-13C]α-ketoglutarate.
Introduction
Gliomas are the most prevalent type of brain tumor in the central nervous system, accounting for 78 % of malignant brain tumors. Mutations in the cytosolic enzyme isocitrate dehydrogenase 1 (IDH1) are a common feature of primary low-grade gliomas, catalyzing the conversion of α-ketoglutarate (αKG) to the oncometabolite 2-hydroxyglutarate (2HG). Several mutant IDH inhibitors are currently in clinical trials, including the pan-mutant-IDH1 inhibitor BAY-1436032 which has been shown to increase the survival of mutant IDH1 astrocytoma in mice.1 However, to date, clinical trials have not detected clear tumor shrinkage following mutant IDH inhibition pointing to a clear need for complementary non-invasive biomarkers to assess drug delivery and potential therapeutic response. The goal of this study was therefore to determine the 1H and hyperpolarized 13C magnetic resonance spectroscopy (MRS)-based biomarkers that can serve as indicators of mutant IDH1 low-grade glioma response to treatment with BAY-1436032.Methods
Normal human astrocytes (NHA) genetically engineered to express mutant IDH1 were cultured as previously described.2 Cells were treated either with their IC50 value of BAY-1436032 (1 μM; N=4) or DMSO (0.2%; N=4) every 24 hours for 72 hours. Control and treated cells were extracted using the dual-phase extraction method. 1H MRS (1D water pre-saturation ZGPR sequence, flip angle = 90°, TR = 3s, NEX = 256) spectra were acquired on a 500 MHz spectrometer (Avance, Bruker). [1-13C]αKG was prepared as described previously,3 hyperpolarized using a Hypersense (Oxford, UK) polarizer, and 500 μl injected into the lysed cells (~1.8 x 10⁸ cells) in a 5 mm NMR tube. Immediate after injection of the hyperpolarized [1-13C]αKG, dynamic sets of hyperpolarized 13C spectra were acquired using a 500 MHz spectrometer (INOVA, Agilent Technologies) with the following parameters: FA = 13°, TR = 3s, NEX = 100. Metabolite peaks were manually integrated and quantified using MNOVA (ver. 7.0, Mestrelab Research). Integrals were normalized to TSP and cell number for the 1H MRS and to [1-13C]αKG and to cell number for the hyperpolarized 13C MRS. Statistical significance of differences was determined using a Student’s t-test.Results
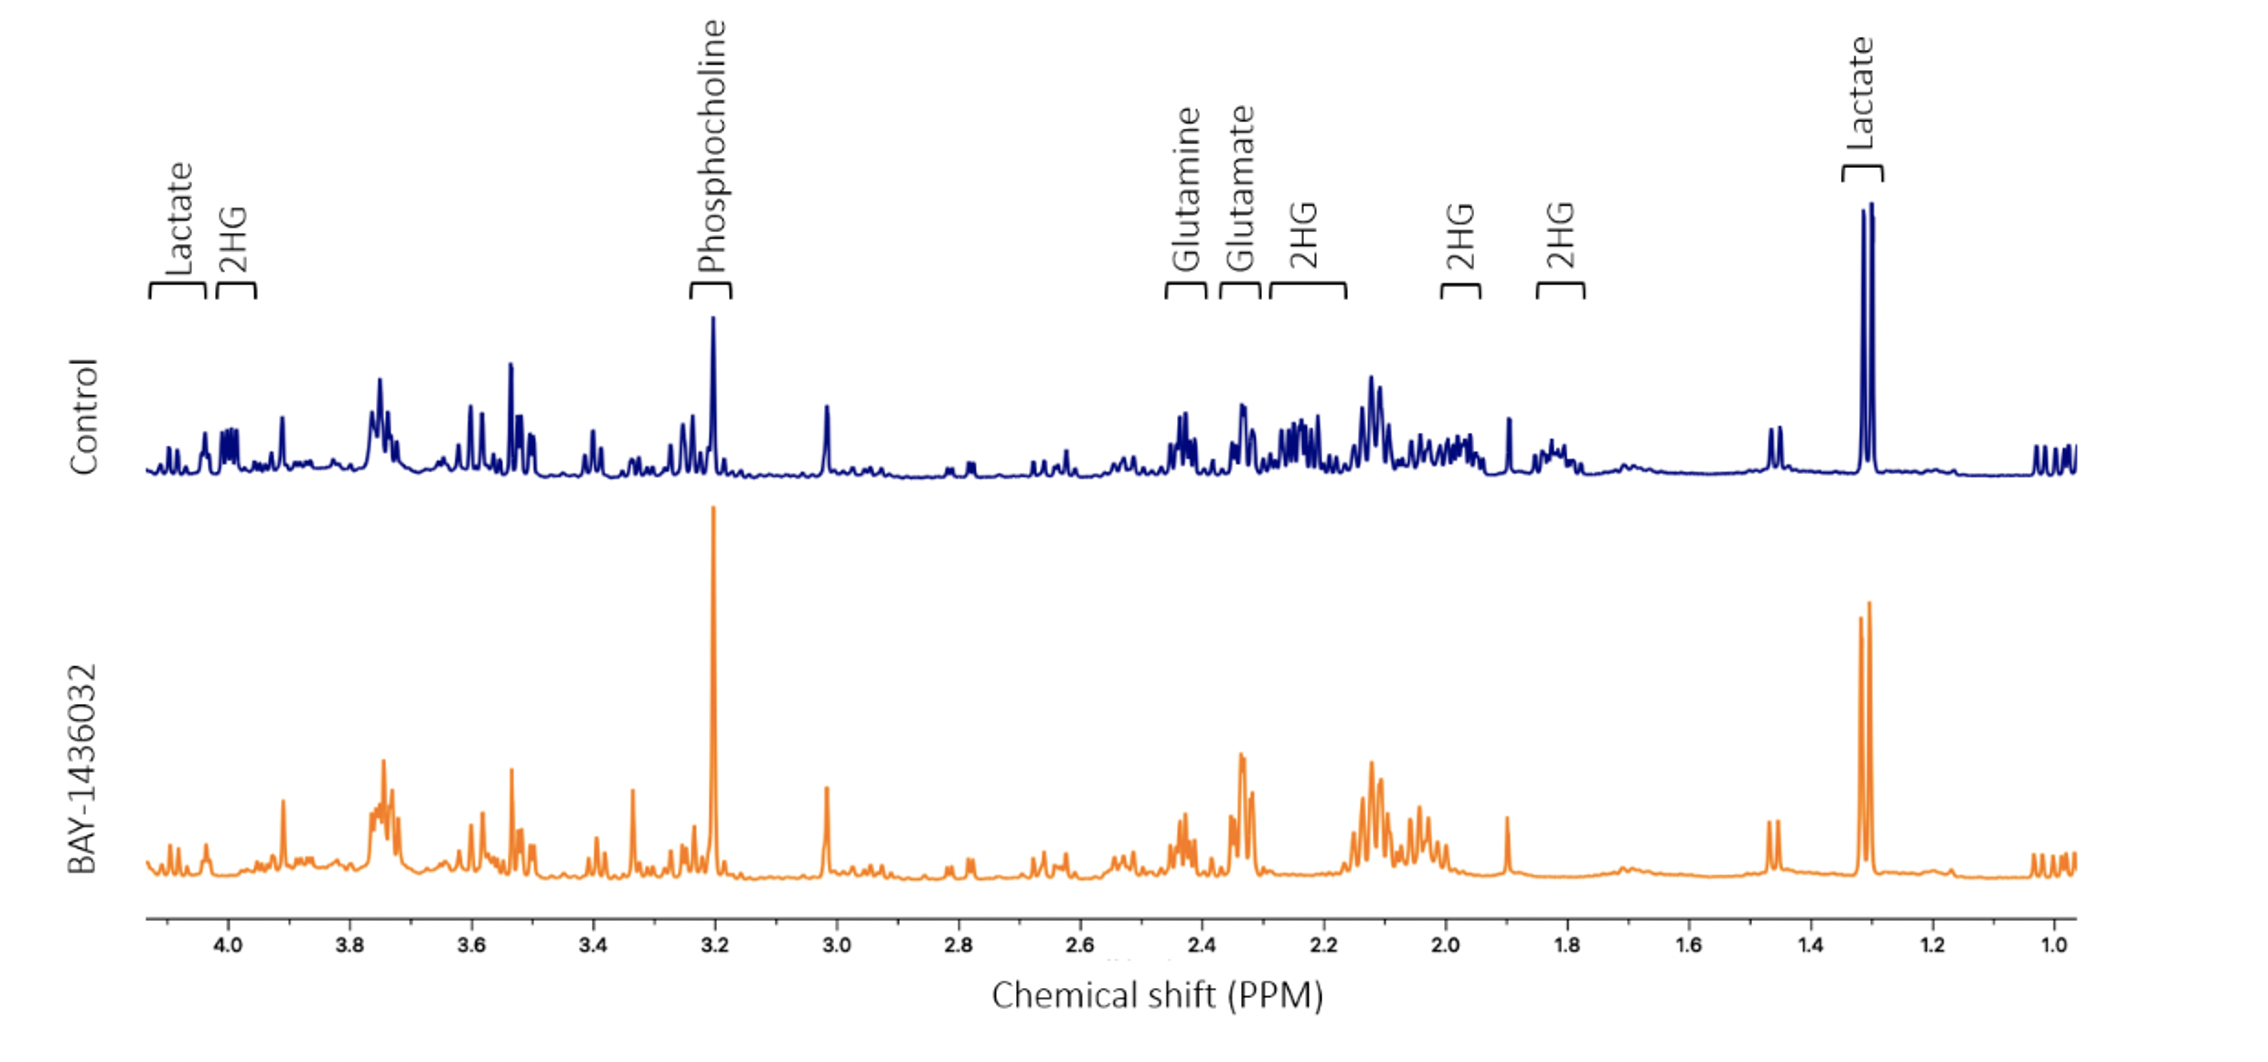
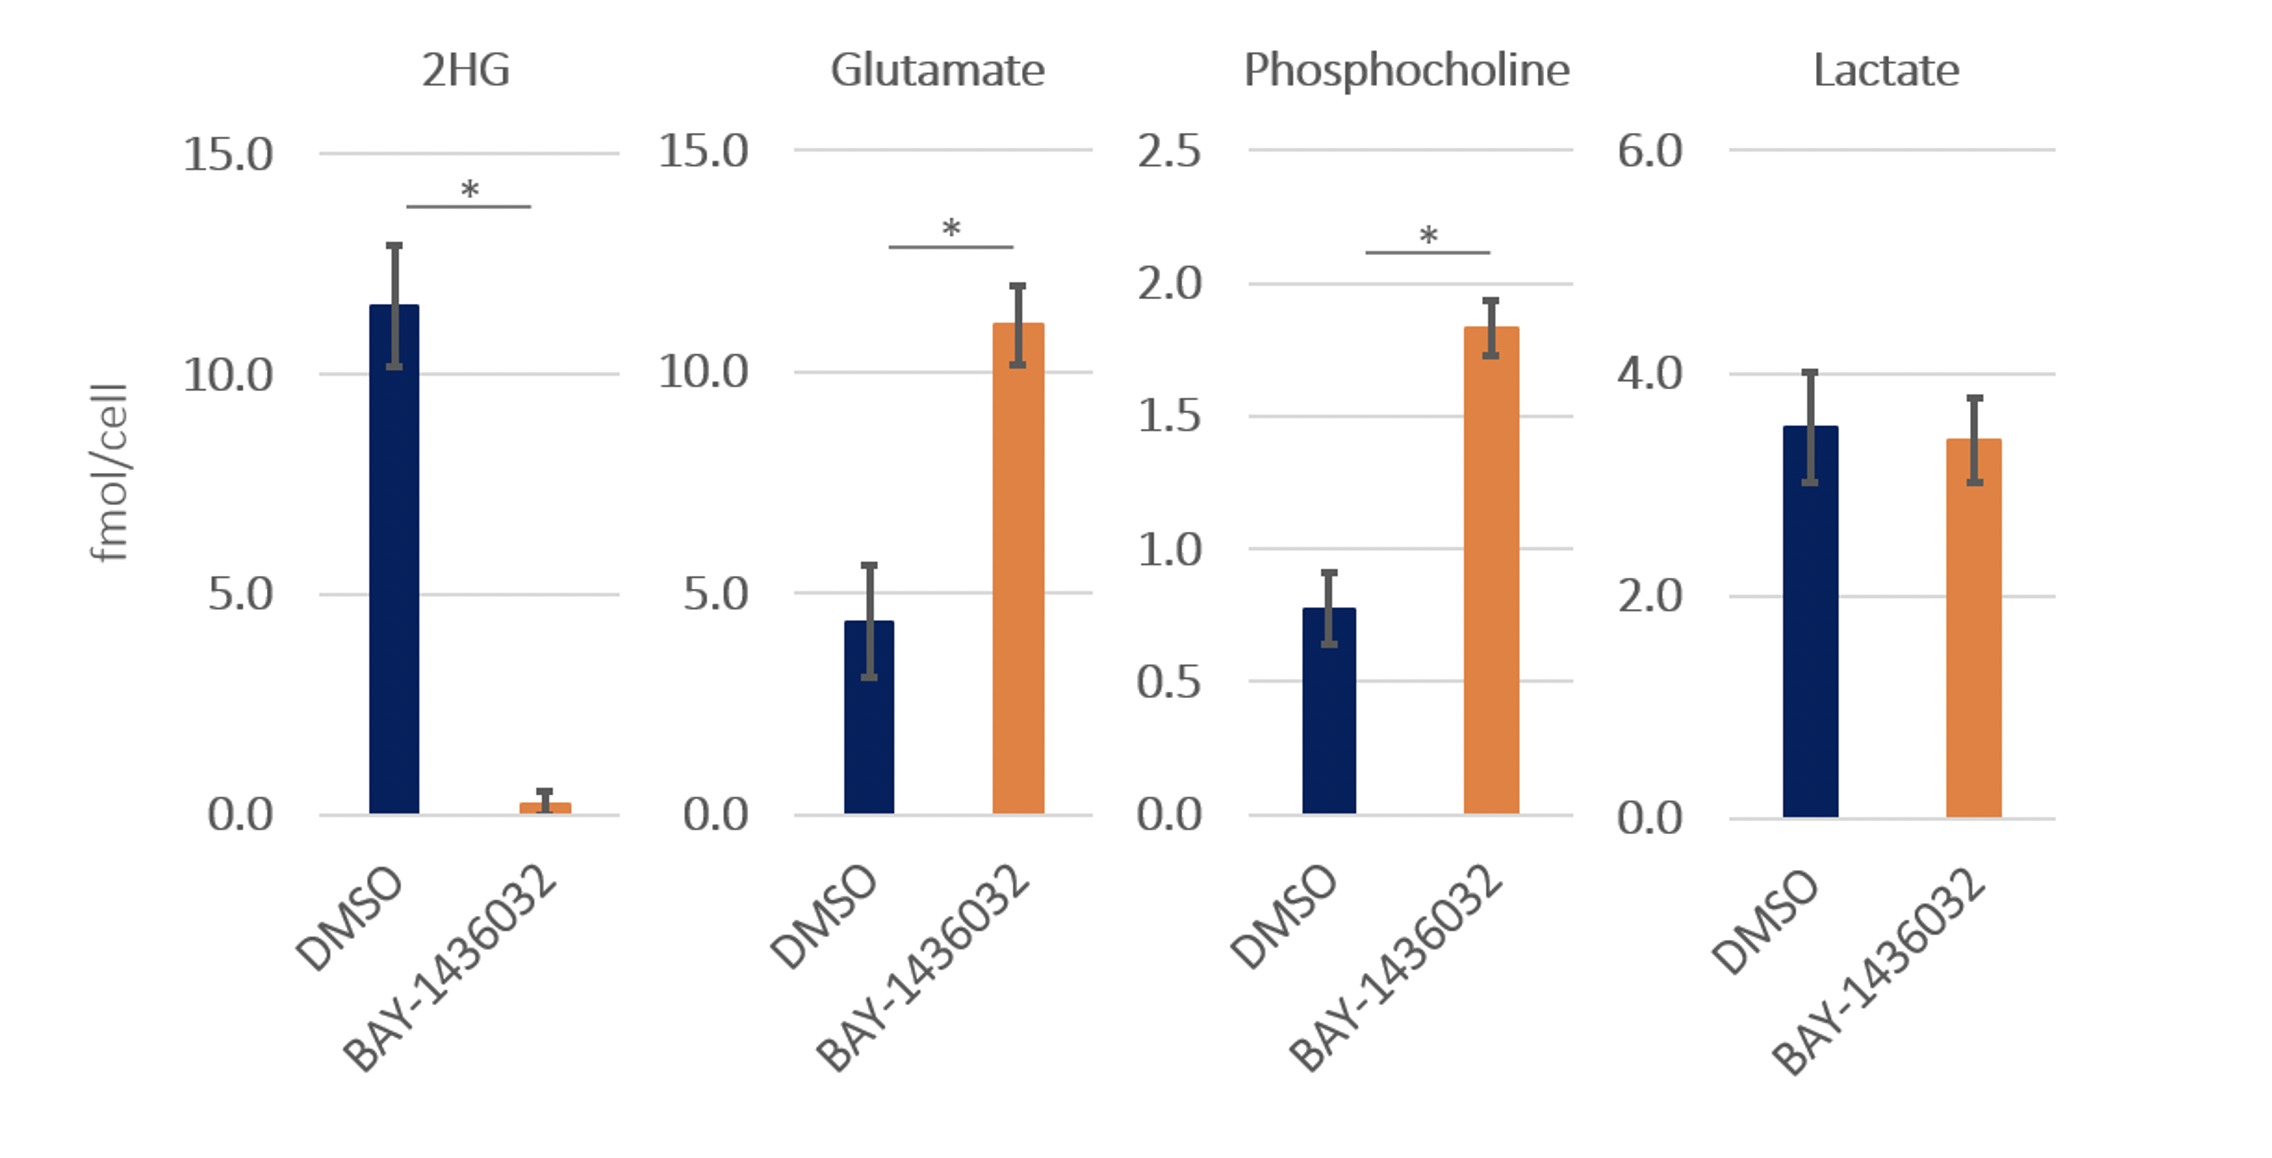
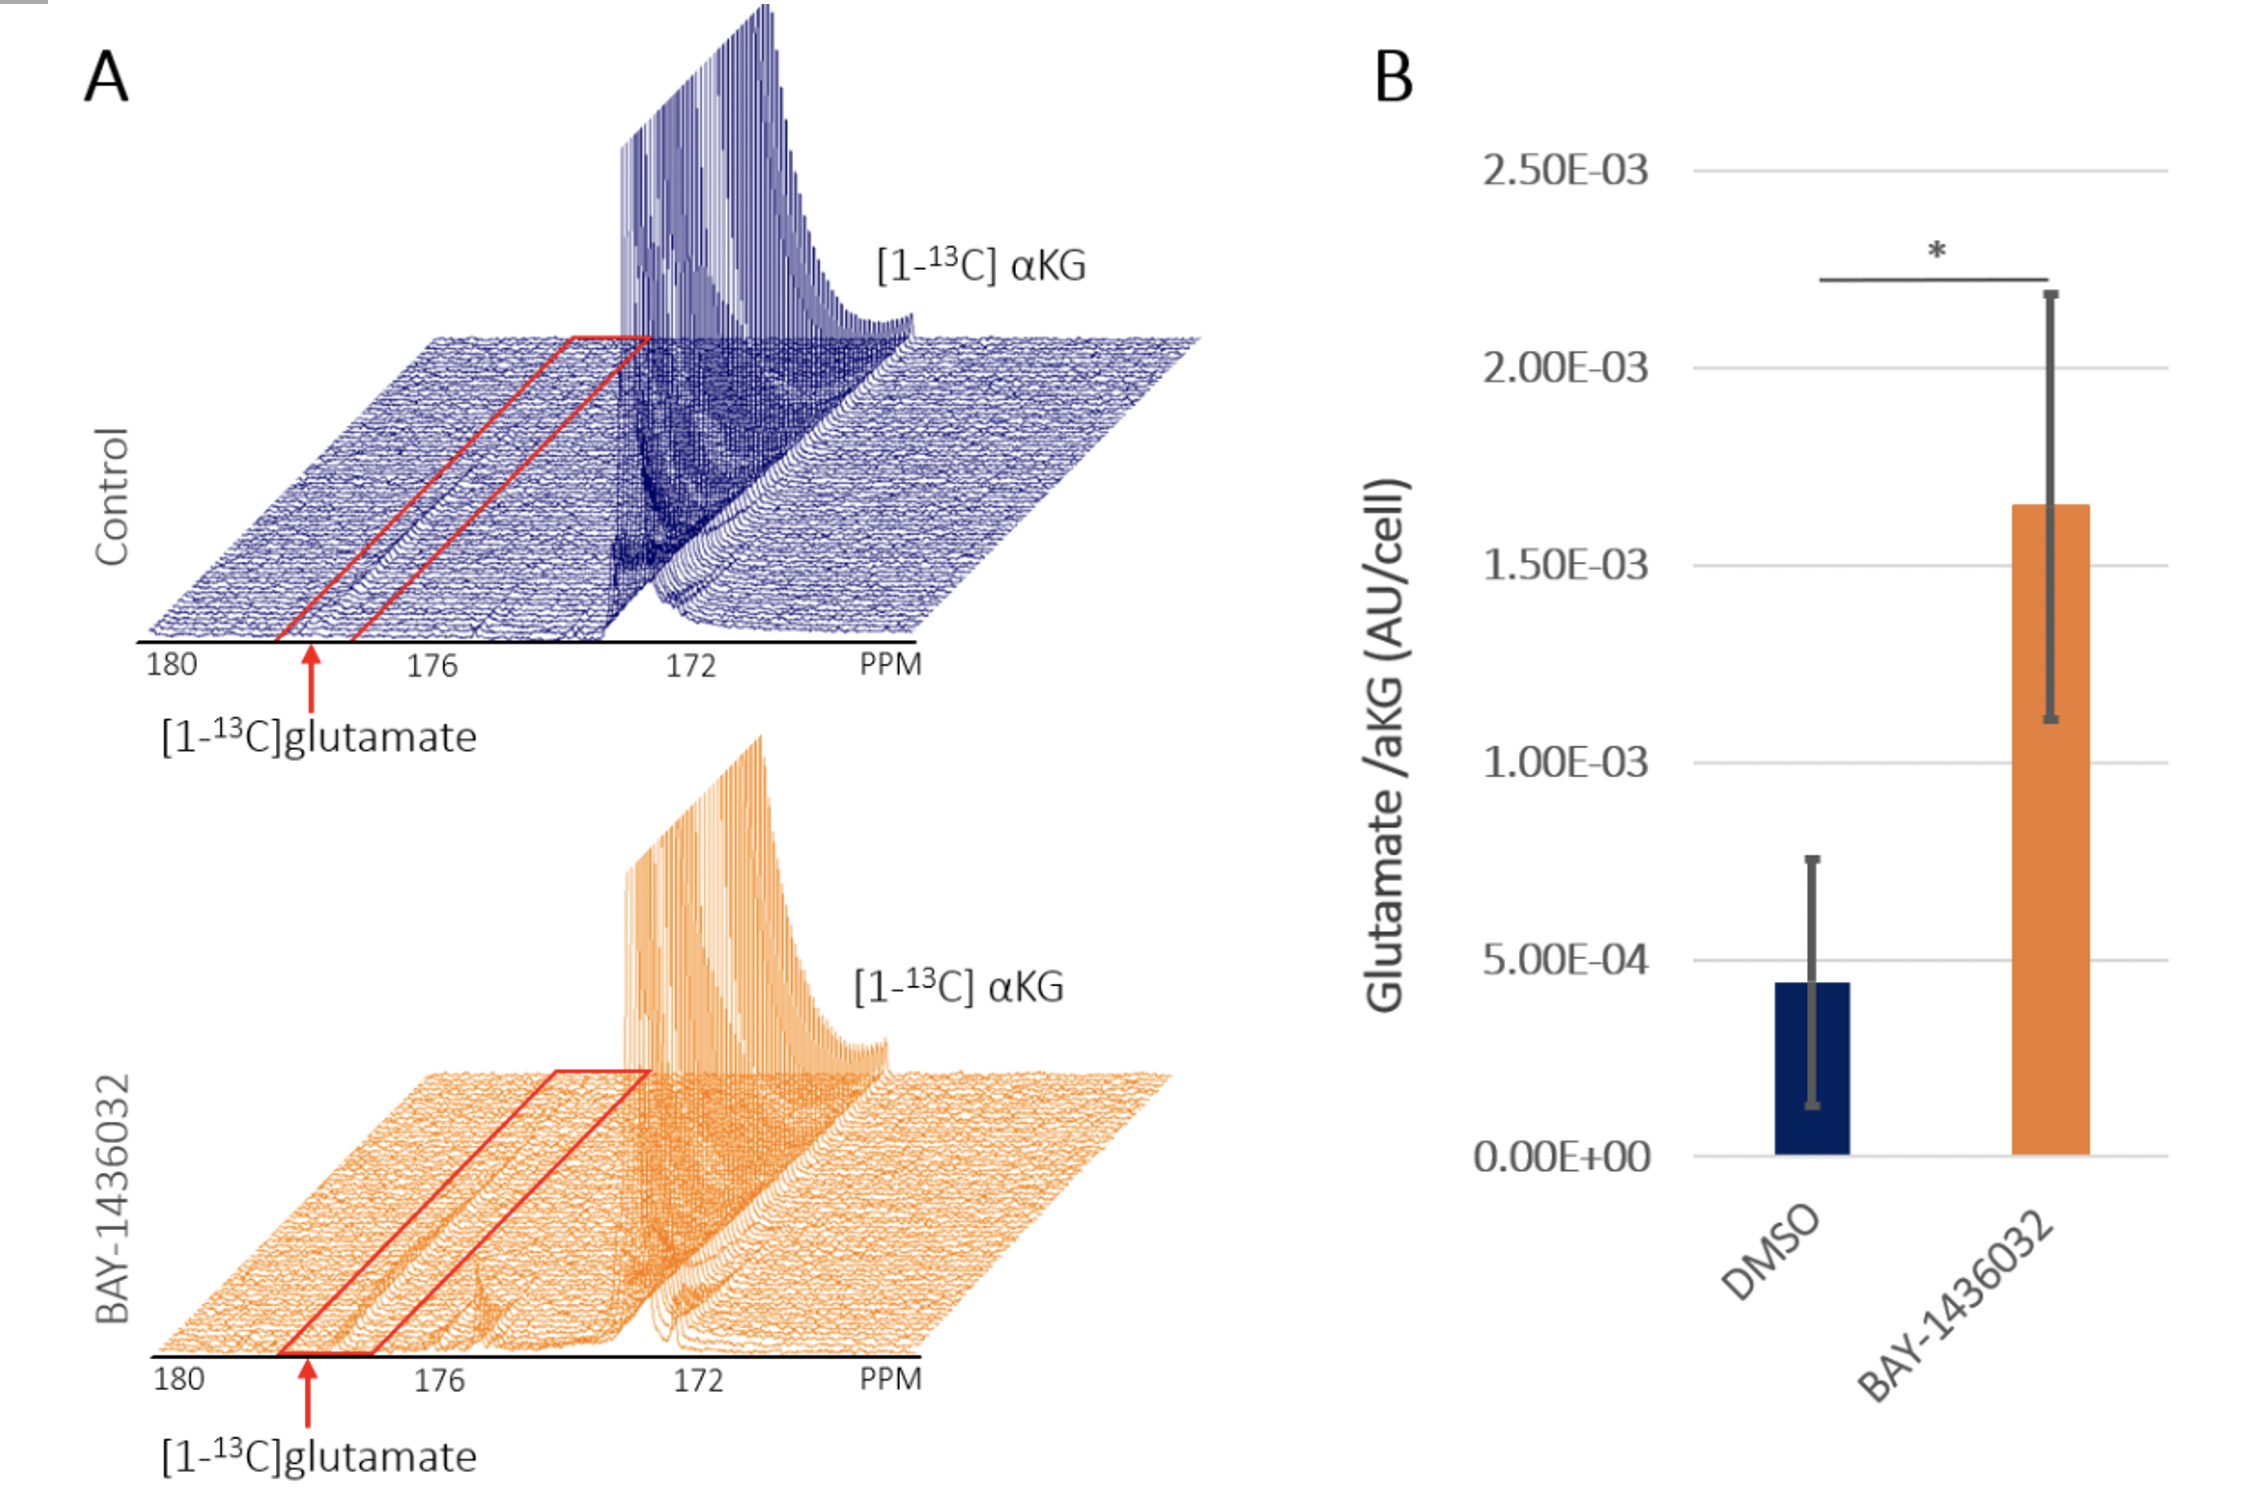
BAY-1436032 did not affect cell proliferation as illustrated by the absence of any significant difference in cell numbers between control and BAY-1436032-treated cells. Figure 1 compares representative 1H MRS spectra between control and treated cell extracts. As expected, we observed a significant decrease in 2HG, consistent with mutant IDH1 inhibition. In addition, we observed a significant increase in glutamate and phosphocholine. Other metabolites including lactate, which was shown to be altered when comparing mutant and wildtype IDH1 cells, showed comparable metabolic concentrations between the two groups (see Figure 2). Injection of the hyperpolarized [1-13C]αKG into the cell lysate showed a dynamic conversion from the hyperpolarized [1-13C]αKG to glutamate (Figure 3A). Furthermore, we found that hyperpolarized glutamate production was significantly increased in the BAY-1436032 treated cells compared to controls (Figure 3B).Discussion
In this study, we identified potential 1H MRS-detectable biomarkers of response to the mutant IDH1 inhibitor BAY-1436032 in glioma. As expected, significantly decreased 2HG levels were observed in the treated group. Moreover, we also found a significant increase in glutamate and phosphocholine levels after treatment. A significantly increased flux from hyperpolarized [1-13C]αKG to glutamate was also observed in the treated group. These findings are consistent with our previous study,3 which investigated the MRS-detectable consequences of two other mutant IDH inhibitors: AG120 and AG881. Collectively, our work identifies translatable MRS based metabolic biomarkers of mutant IDH1 inhibition.Acknowledgements
This work was supported by NIH R01CA172845, NIH R01CA197254, UCSF LOGLIO collective, NICO project, NIH P30CA082103 HDFCCC cancer imaging resources (CIR), and NIH P41EB013598 Hyperpolarized MRI Technology Resource Center Grant.References
1. Pusch S, Krausert S, Fischer V, et al. Pan-mutant IDH1 inhibitor BAY 1436032 for effective treatment of IDH1 mutant astrocytoma in vivo. Acta neuropathologica. 2017;133(4):629-644.
2. Chaumeil MM, Larson PE, Yoshihara HA, et al. Non-invasive in vivo assessment of IDH1 mutational status in glioma. Nature communications. 2013;4(1):1-12.
3. Molloy AR, Najac C, Viswanath P, et al. MR-detectable metabolic biomarkers of response to mutant IDH inhibition in low-grade glioma. Theranostics. 2020;10(19):8757-8770.
Figures