0927
Comparison of Tumour pH Environment and Glycolysis Measurements in a C6 Rat Model of Glioma1Lawson Imaging, Lawson Health Research Institute, London, ON, Canada, 2Medical Biophysics, Western University, London, ON, Canada, 3Molecular Imaging, Western University, London, ON, Canada, 4Physics and Astronomy, Western University, London, ON, Canada, 5Robart Research Institute, London, ON, Canada, 6Medical Imaging, Western University, London, ON, Canada, 7Lawson Health Research Institute, London, ON, Canada, 8Anatomy and Cell Biology, Western University, London, ON, Canada
Synopsis
There is an intrinsic relationship between tumour glycolysis and its pH environment. CEST MRI enables the detection of tumour pH in both intra- (pHi) and extracellular (pHe) spaces with AACID and acidoCEST methods. Kinetic analysis of dynamic FDG-PET can provide an accurate measurement of tumour glycolysis. This study demonstrates the capability of simultaneous measurements of pHi and pHe using CEST MRI, providing a more complete picture of the tumour pH environment, and explores the intrinsic relationship between tumour glycolysis and its pH environment.
Introduction
Glioblastoma is one of the most aggressive brain tumours and patients diagnosed with glioma have a median survival time of 12-15 months [1]. One of the hallmarks of glioma is the reliance on glycolytic metabolism, even with adequate oxygen supply [2]. A large amount of lactate acid and H+ protons are produced from glycolysis, resulting in a more acidic tumour environment. Injection of glucose could lead to a drop in tumour pH environment due to the reliance on glycolysis [3]. There is an intrinsic relationship between tumour glycolysis and its pH environment. Chemical exchange saturation transfer (CEST) MRI is sensitive to pH and can be used in vivo to detect intracellular pH (pHi) with amine and amide concentration independent detection (AACID) [4], and extracellular (pHe) with acidoCEST using iopamidol (Isovue) [5]. Glucose metabolism can be evaluated using kinetic modeling of dynamic positron emission tomography (PET) data obtained from 18F-fluorodeoxyglucose (FDG), a glucose analogue which is phosphorylated in the cell but does not go through the subsequent steps of glycolysis. In this study, we compared CEST measurements of AACID and acidoCEST to FDG-PET to explore the relationship between the tumour pH environment and glycolytic metabolism.Methods
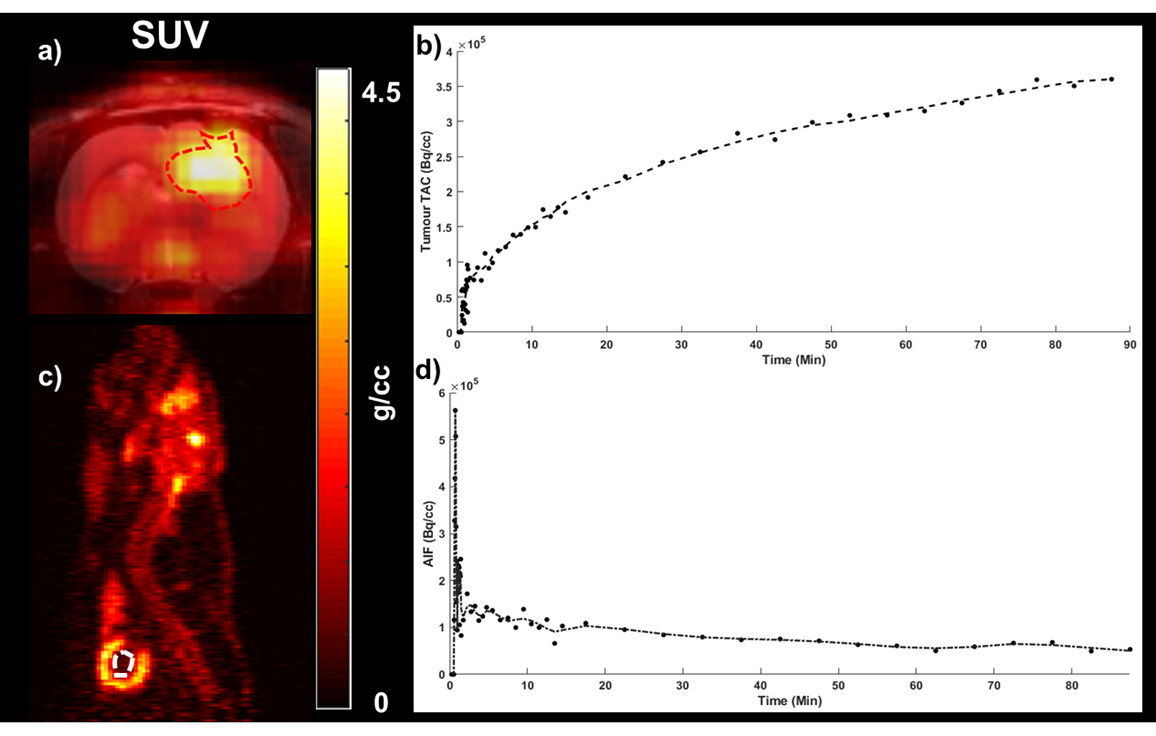
All animal experiments followed approved local animal ethics protocols. 106 C6 glioma cells were implanted in the brains of Wistar rats (n=11) using stereotactic surgery. Tumours were monitored actively using MRI (Siemens Biograph mMR) starting from Day 7 after the surgery. Tumour and peri-tumour glucose metabolism were represented by the Patlak influx constant (Ki) derived from PET kinetic analysis (as shown in Figure 1) of dynamic PET data (Siemens Inveon) acquired for 90 minutes after a bolus of FDG (30 ± 2 MBq) 11 days post-surgery. CEST measurements were acquired the following day. A 60-minute constant infusion of 300 mgI/ml of Isovue was started prior to CEST acquisition at a dose of 0.75 gI/kg. CEST spectra were acquired on a 9.4 T Bruker MRI using a continuous wave presaturation pulse preceding a series of echo-planar images. One CEST spectra was acquired pre-glucose infusion followed by a second CEST spectra acquired after a bolus of glucose solution (0.3 g/kg). The effect of glucose infusion on tumour and peri-tumour pHi were evaluated using amine and amide concentration-independent detection (AACID). AACID maps were generated by using the ratio between the CEST signal for the amine proton at 3.5 ppm and the amide proton at 2.75 ppm pre- and post-glucose injection. ∆AACID was calculated as the difference in AACID value between post- and pre-glucose injection. The effect of glucose infusion on tumour and peri-tumour pHe were evaluated using acidoCEST. Maps of acidoCEST were derived using the ratio between CEST signal of two amide protons on Iopamidol at 4.2 and 5.6 ppm pre- and post-glucose injection. ∆acidoCEST was calculated as the difference in acidoCEST value between post- and pre-glucose injection. The correlations between PET measurements of Ki and CEST measurements of AACID and acidoCEST were evaluated using Pearson’s correlation.Results
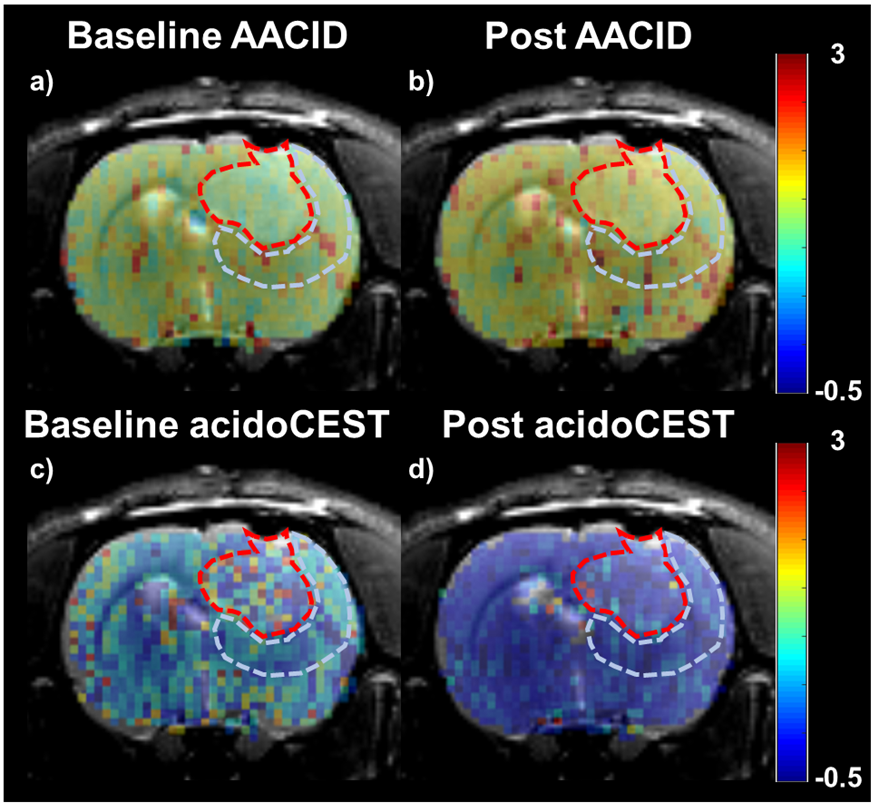
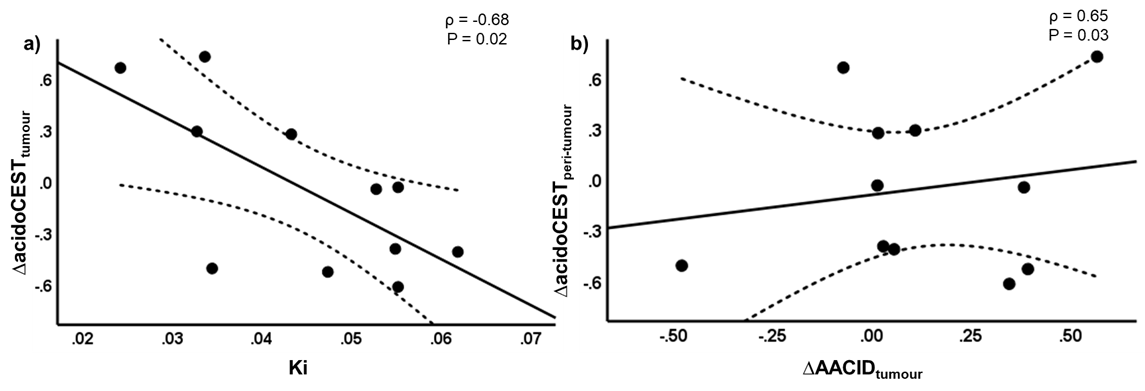
An increase in average tumour and peri-tumour AACID values (Figure 2a and 2b); and a decrease in tumour and peri-tumour acidoCEST value (Figure 2c and 2d) after glucose injection were observed. Significant correlations were found between baseline tumour AACID and peri-tumour acidoCEST (ρ = -0.79, P = 0.004); tumour and peri-tumour ∆AACID (ρ = 0.78, P = 0.005); and tumour ∆AACID and peri-tumour ∆acidoCEST (ρ = 0.65, P = 0.03) as shown in Figure 3b. Tumour glycolysis measurement of Ki is significantly correlated with ∆acidoCEST (ρ = -0.68, P = 0.02) as shown in Figure 3a. No significant correlation was found between Ki and AACID values at the tumour (ρ = -0.53, P = 0.09) and peri-tumour (ρ = -0.54, P = 0.09) regions.Disscussion
The AACID value is inversely proportional to pHi [4], whereas the acidoCEST value is directly proportional to pHe [5]. Glucose-induced changes in tumour and peri-tumour pHi and pHe were detected using CEST, and tumour ∆AACID was directly proportional with both peri-tumour ∆AACID and ∆acidoCEST. This suggests that the glucose injection affects both tumour and peri-tumour pHi consistently and changes in pHi accordingly, whereas tumour pHi and peri-tumour pHe are regulated in reverse. An inversely proportional relationship was demonstrated between Ki and tumour ∆acidoCEST. This suggests that higher tumour glycolytic activity would lead to a decrease in tumour pHe, which agrees with a similar study by Longo et al. [6]. Baseline tumour AACID and peritumour acidoCEST displayed an inversely proportional relationship (higher AACID value, lower pHi), that is associated with lower peri-tumour acidoCEST value or pHe. Currently, precise pH conversion between AACID and acidoCEST values, and information about the pH gradient across the intra- and extracellular space is missing – this will be evaluated in the future with additional calibration measurements and modeling.Conclusion
This study demonstrated the capability of simultaneous measurements of pHi and pHe using CEST MRI and provided a more complete picture of tumour pH environment. Ki demonstrated the intrinsic relationship between tumour glycolysis with tumour pHe.Acknowledgements
Natural Sciences and Engineering Research Council.
Government of Ontario.
Lawson Health Research Institute.
Department of Molecular Imaging, Western University.
References
[1] Wen PY, Kesari S. Malignant gliomas in adults. N Engl J Med. 2008; 359: 492–507.
[2] Warburg O, Über den Stoffwechsel der Carcinomzelle. Klinische Wochenschrift, 1925; 4: 534–536.
[3] Volk T, Jähde E, Fortmeyer HP, Glüsenkamp KH and Rajewsky MF. pH in human tumour xenografts: effect of intravenous administration of glucose. Br. J. Cancer, 1993; 68: 492-500.
[4] McVicar N, Li AX, Gonçalves DF, Bellyou M, Meakin SO, Prado MAM, Bartha R. Quatatitive Tissue pH Measurement during Cerebral Ischemia using Amine and Amide concentration-independent Detection (AACID) with MRI. NMR Biomed 2015; 28:566 –575.
[5] Chen LQ, Howison CM, Jeffery JJ, Robey IF, Kuo PH, Pagel MD, Evaluation of Extracellular pH within in vivo Tumours using acidoCEST MRI, Magn. Reson. Med., 2014; 72: 1408-1417.
[6] Longo DL, Bartoli A, Consolino L, Bardini P, Arena F, Schwaiger M, Aime S. In vivo imaging of tumor metabolism and acidosis by combing PET and MRI-CEST pH imaging, Cancer Res. 2016; 76(22): 6463-6470.
Figures