0920
Multimodal molecular imaging assessment of changes in tumor microenvironment in response to combination of Evofosfamide and GEM1National Cancer Institute, Bethesda, MD, United States
Synopsis
Combination of evofosfamide and chemotherapy suppress tumor growth than using these drugs alone. The purpose of this study is to detect physiologic changes in tumor-bearing mouse model in response to combination of evofosfamide and gemcitabine (GEM) using multi-modal imaging methods including DCE-MRI, blood volume imaging, and EPRI. Significantly increased perfusion, maintained blood volume, and maintained hypoxic fraction < 10 mmHg were observed after treatment with combination of evofosfamide and GEM. The results validate the utility of these imaging methods to non-invasively monitor changes in the tumor microenvironment after treatment.
Introduction
Evofosfamide is a prodrug that is activated under hypoxic conditions where other anticancer treatment is less effective. However, this drug is not effective to all cancer subtypes in pancreatic ductal adenocarcinoma. MIA Paca-2 tumors are known to respond to evofosfamide, while SU.86.86 tumors do not.1 On the other hand, MIA Paca-2 tumors do not respond to gemcitabine (GEM), while SU.86.86 tumors does.2, 3 Despite the difference of pO2 level in two tumors, combination treatment of evofosfamide and GEM reduces tumor growth than either GEM/evofosfamide alone in both tumors.4 The mechanism of this combination treatment is not fully understood. Therefore, the aim of this study is to reveal and evaluate the early response of the combination treatment using evofosfamide and gemcitabine (GEM) by using multimodal imaging methods.Methods
Athymic nude mice were inoculated with 2 x 10⁶ SU.86.86 and MIA Paca-2 tumor cells adjacent to the right tibial periosteum. For treatment, approximately 400 mm3 tumor bearing mice were injected i.p. with 50 mg/kg of evofosfamide on day 1 through day 5 and 150 mg/kg of GEM on day 1. Tumor bearing mice in the control group were injected with same amount of vehicle. EPRI: Parallel coil resonators tuned to 300MHz were used for EPRI. OX063 (1.125 mmol/kg bolus) was injected i.v. to a mouse. The free induction decay (FID) signals were collected following the radiofrequency excitation pulses (65 ns) with a nested looping of the x, y, and z gradients, and each time point in the FID underwent phase modulation, enabling 3D spatial encoding. The repetition time was 8.0 μs. The number of averages was 4,000. After EPRI measurement, anatomic T2-weighted MR images were collected with a 1T scanner. DCE-MRI: DCE-MRI studies were performed on a 1 T scanner (Bruker BioSpin MRI GmbH). T1-weighted fast low-angle shot (FLASH) images were obtained with TR = 156 ms; TE = 4 ms; flip angle = 45˚; four slices; 0.44 x 0.44 mm resolution; 20-second acquisition time per image; and 98 repetitions. Gd-DTPA solution (4 mL/g of body weight of 50 mmol/L Gd-DTPA) was injected through a tail vein cannula 2 minutes after the start of the dynamic FLASH sequence. To determine the local concentrations of Gd-DTPA, T1 maps were calculated from three sets of Rapid Imaging with Refocused Echoes (RARE) images obtained with TR = 300, 600, 1,000, and 2,000 ms, with the acquisitions being made before running the FLASH sequence. Blood volume (BV) imaging: MRI scanning was conducted a 1 T scanner (Bruker BioSpin MRI GmbH). For BV calculation, spoiled gradient echo sequence images were collected before and 5 minutes after injection of ultra-small superparamagnetic iron oxide (USPIO) contrast (1.2 μL/g of body weight). The imaging parameters included the following: FOV = 28 x 28 mm; matrix = 128 x 128; echo time (TE) = 5.6 ms; TR = 200 ms; and number of average = 12.Results
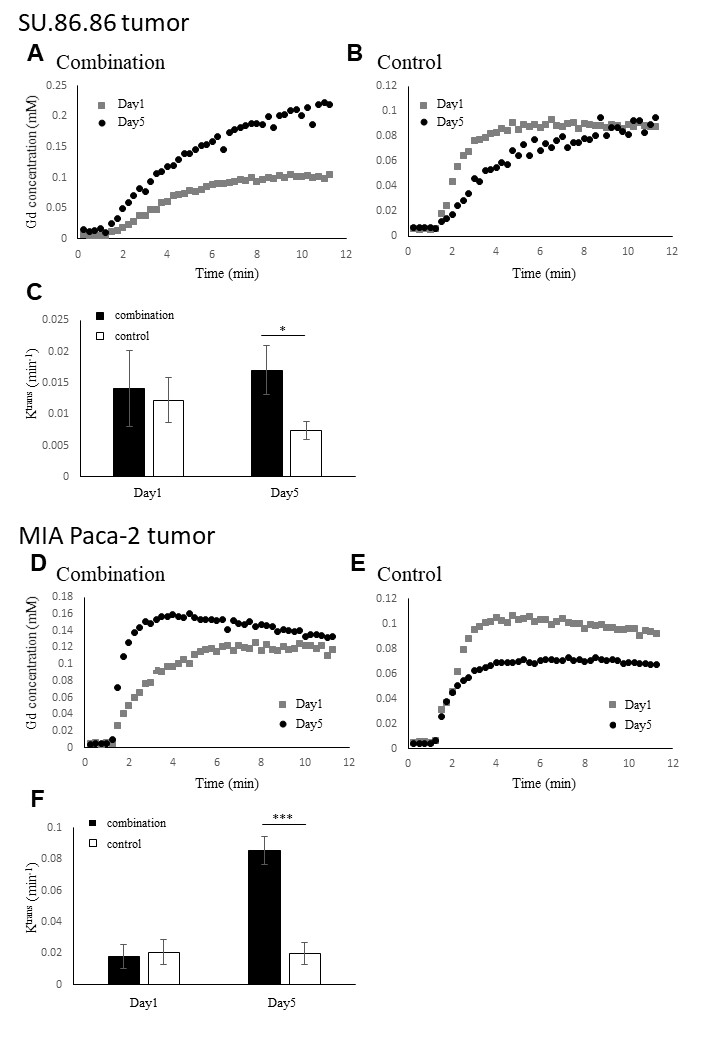
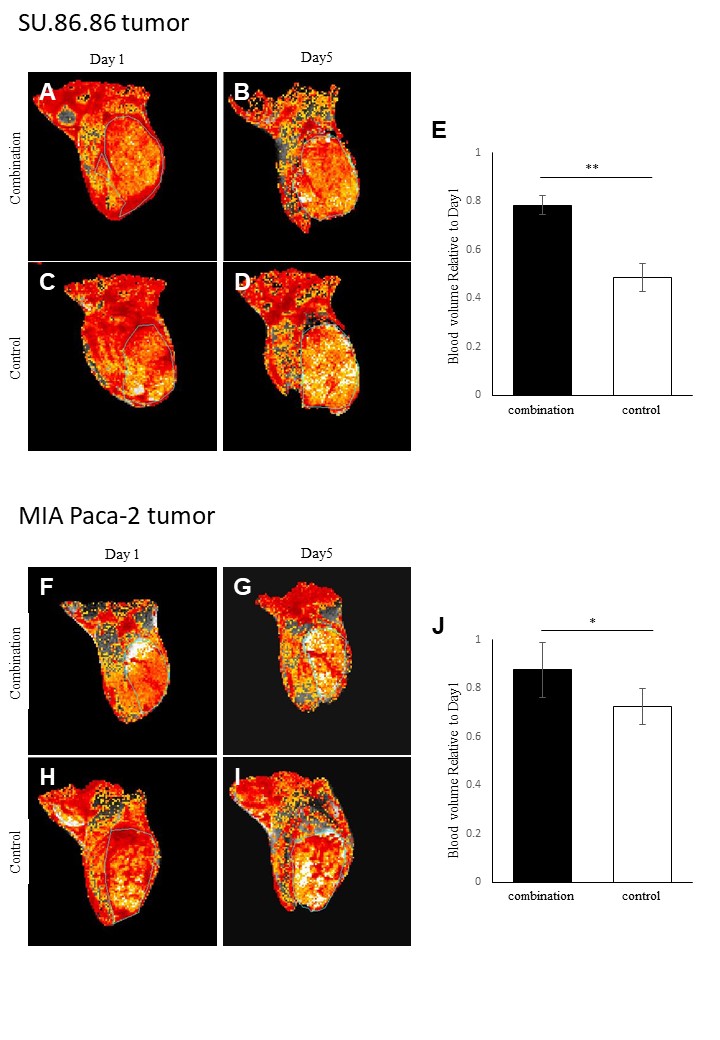
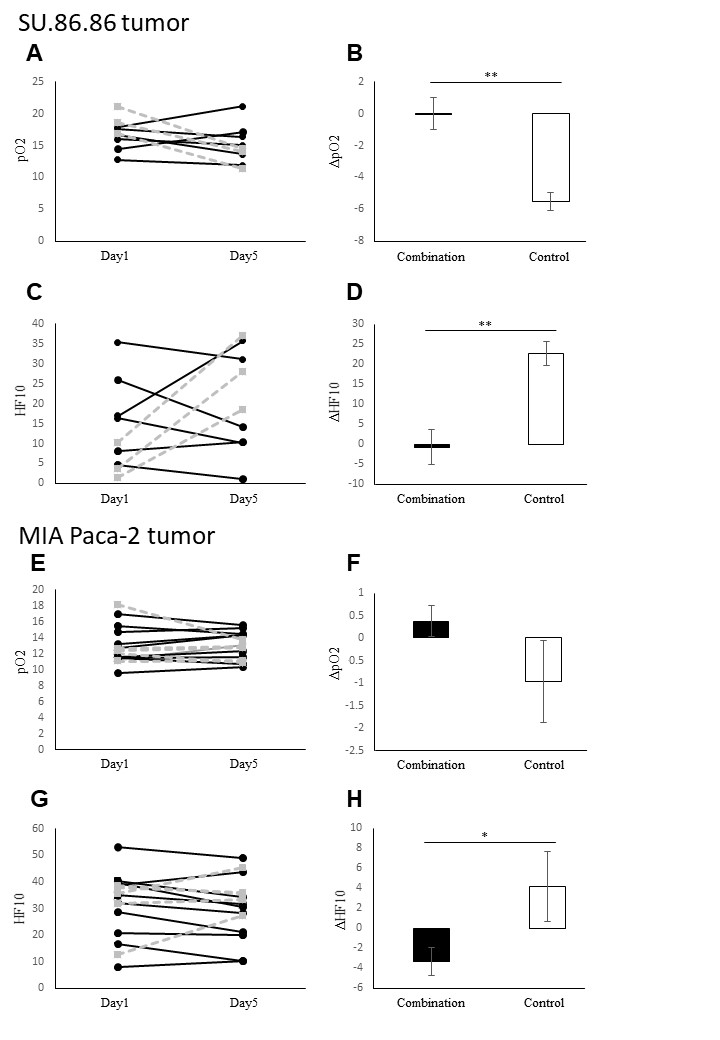
DCE-MRI showed significantly higher permeability of Gd-DTPA in combination treated tumors than in control buffer treated in both SU.86.86 and MIA Paca-2 cells (Fig. 1). BV imaging showed significantly higher sustainability in combination treated tumors than in control buffer treated in both SU.86.86 and MIA Paca-2 cells (Fig. 2). EPRI showed significantly higher ΔpO2 (ΔpO2=post-treatment pO2 − pretreatment pO2) and lower ΔHF10 (ΔHF10=post-treatment hypoxic fraction <10 mmHg − pretreatment hypoxic fraction <10 mmHg) in SU.86.86 tumors and significantly higher in ΔHF10 in MIA Paca-2 cells in combination treated tumors than in vehicle treated (Fig. 3).Conclusion
Multi-model imaging showed that combination of evofosfamide and GEM suppress tumor growth by maintaining the intratumor vasculature and oxygenation. These data can provide imaging biomarkers to detect early response to cancer therapy.Acknowledgements
No acknowledgement found.References
(1) Kishimoto S, et al. Hypoxia-Activated Prodrug Evofosfamide Treatment in Pancreatic Ductal Adenocarcinoma Xenografts Alters the Tumor Redox Status to Potentiate Radiotherapy. Antioxid Redox Signal. 2020 epub ahead of print.
(2) Liu Q, et al. TH-302, a hypoxia-activated prodrug with broad in vivo preclinical combination therapy efficacy: optimization of dosing regimens and schedules. Cancer Chemother Pharmacol. 2012;69(6):1487-1498.
(3) de la Fuente M, et al. A nano-enabled cancer-specific ITCH RNAi chemotherapy booster for pancreatic cancer. Nanomedicine. 2015;11(2):369-377.
(4) Matsumoto S, et al. Metabolic and Physiologic Imaging Biomarkers of the Tumor Microenvironment Predict Treatment Outcome with Radiation or a Hypoxia-Activated Prodrug in Mice. Cancer Res. 2018;78(14):3783-3792.
Figures