0916
B1+ inhomogeneity mitigation using adiabatic refocusing RF pulses for diffusion weighted imaging at 7T1Centre for Advanced Imaging, University of Queensland, Brisbane, Australia, 2ARC Training Centre for Innovation in Biomedical Imaging Technology, The University of Queensland, Brisbane, Australia, 3Siemens Healthcare Pty Ltd, Brisbane, Australia, 4School of Electrical Engineering and Information Technology, The University of Queensland, Brisbane, Australia
Synopsis
Ultra-high field scanners offer a potential signal-to-noise ratio (SNR) improvement for Diffusion weighted Imaging (DWI). However, the application of DWI at 7T is hindered by several technical challenges. In particular, B1+ inhomogeneity can lead to signal dropouts that degrades image quality in the temporal lobes and base of the skull. In this work, we show that embedding time-resampled frequency offset corrected inversion pulses (TR-FOCI) in a twice-refocussed spin echo DWI sequence can recover the signal in these brain areas.
Introduction
Diffusion-Weighted Imaging (DWI) is widely used to study microstructure in the human brain (1). Unfortunately, longstanding technical challenges hinder its application at 7T (2). In particular, B1+ inhomogeneity caused by the standing wave phenomenon local field-tissue interactions and large-scale effects such as the elliptical eccentricity of the head lead to signal dropouts. Commonly, these effects are most noticeable in the temporal lobes and cerebellum. Here, we leverage the adiabatic properties of the TR-FOCI pulse to mitigate these artifacts in a twice-refocused DWI sequence.Methods
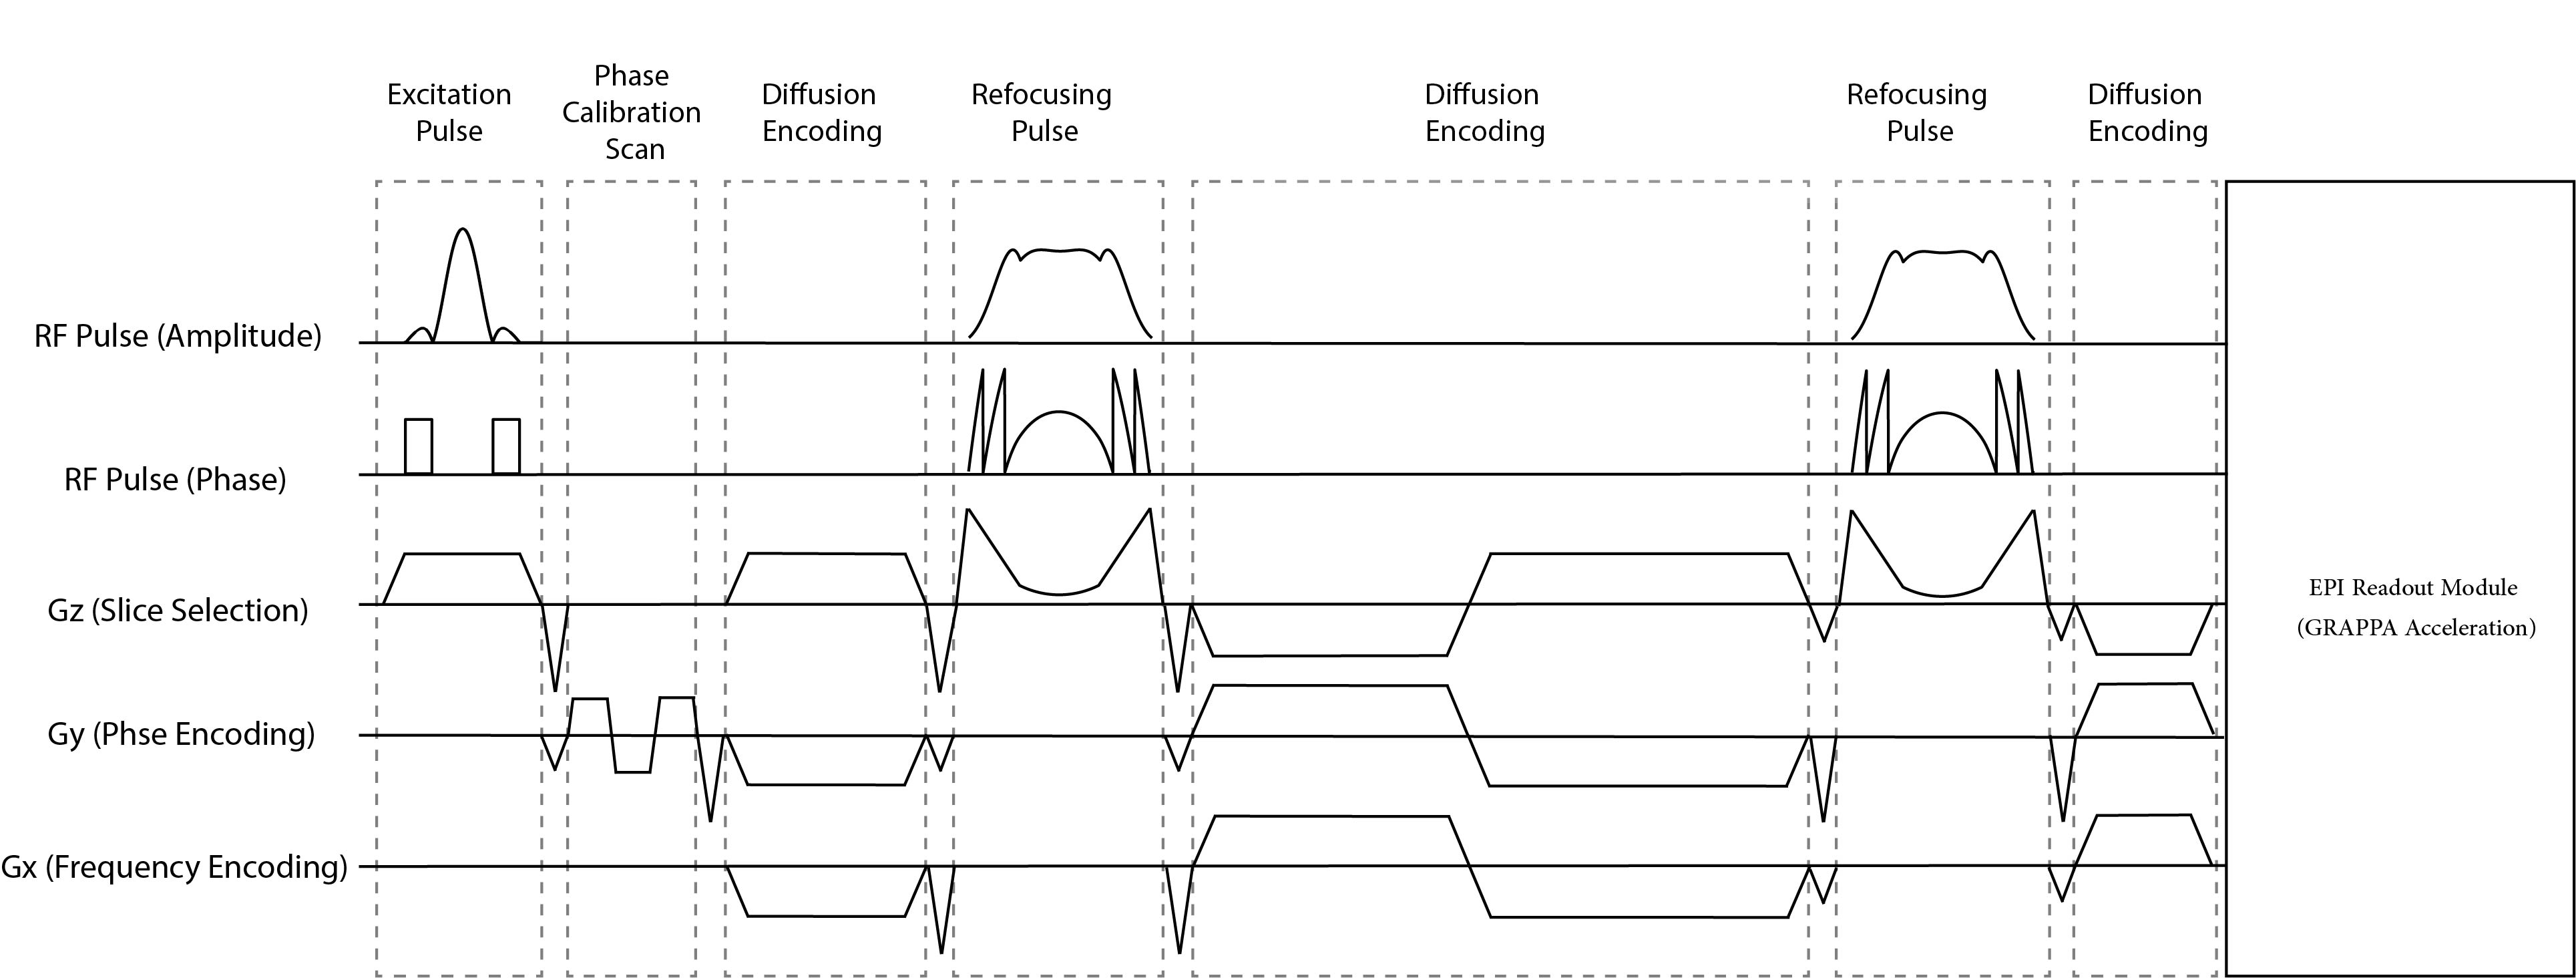
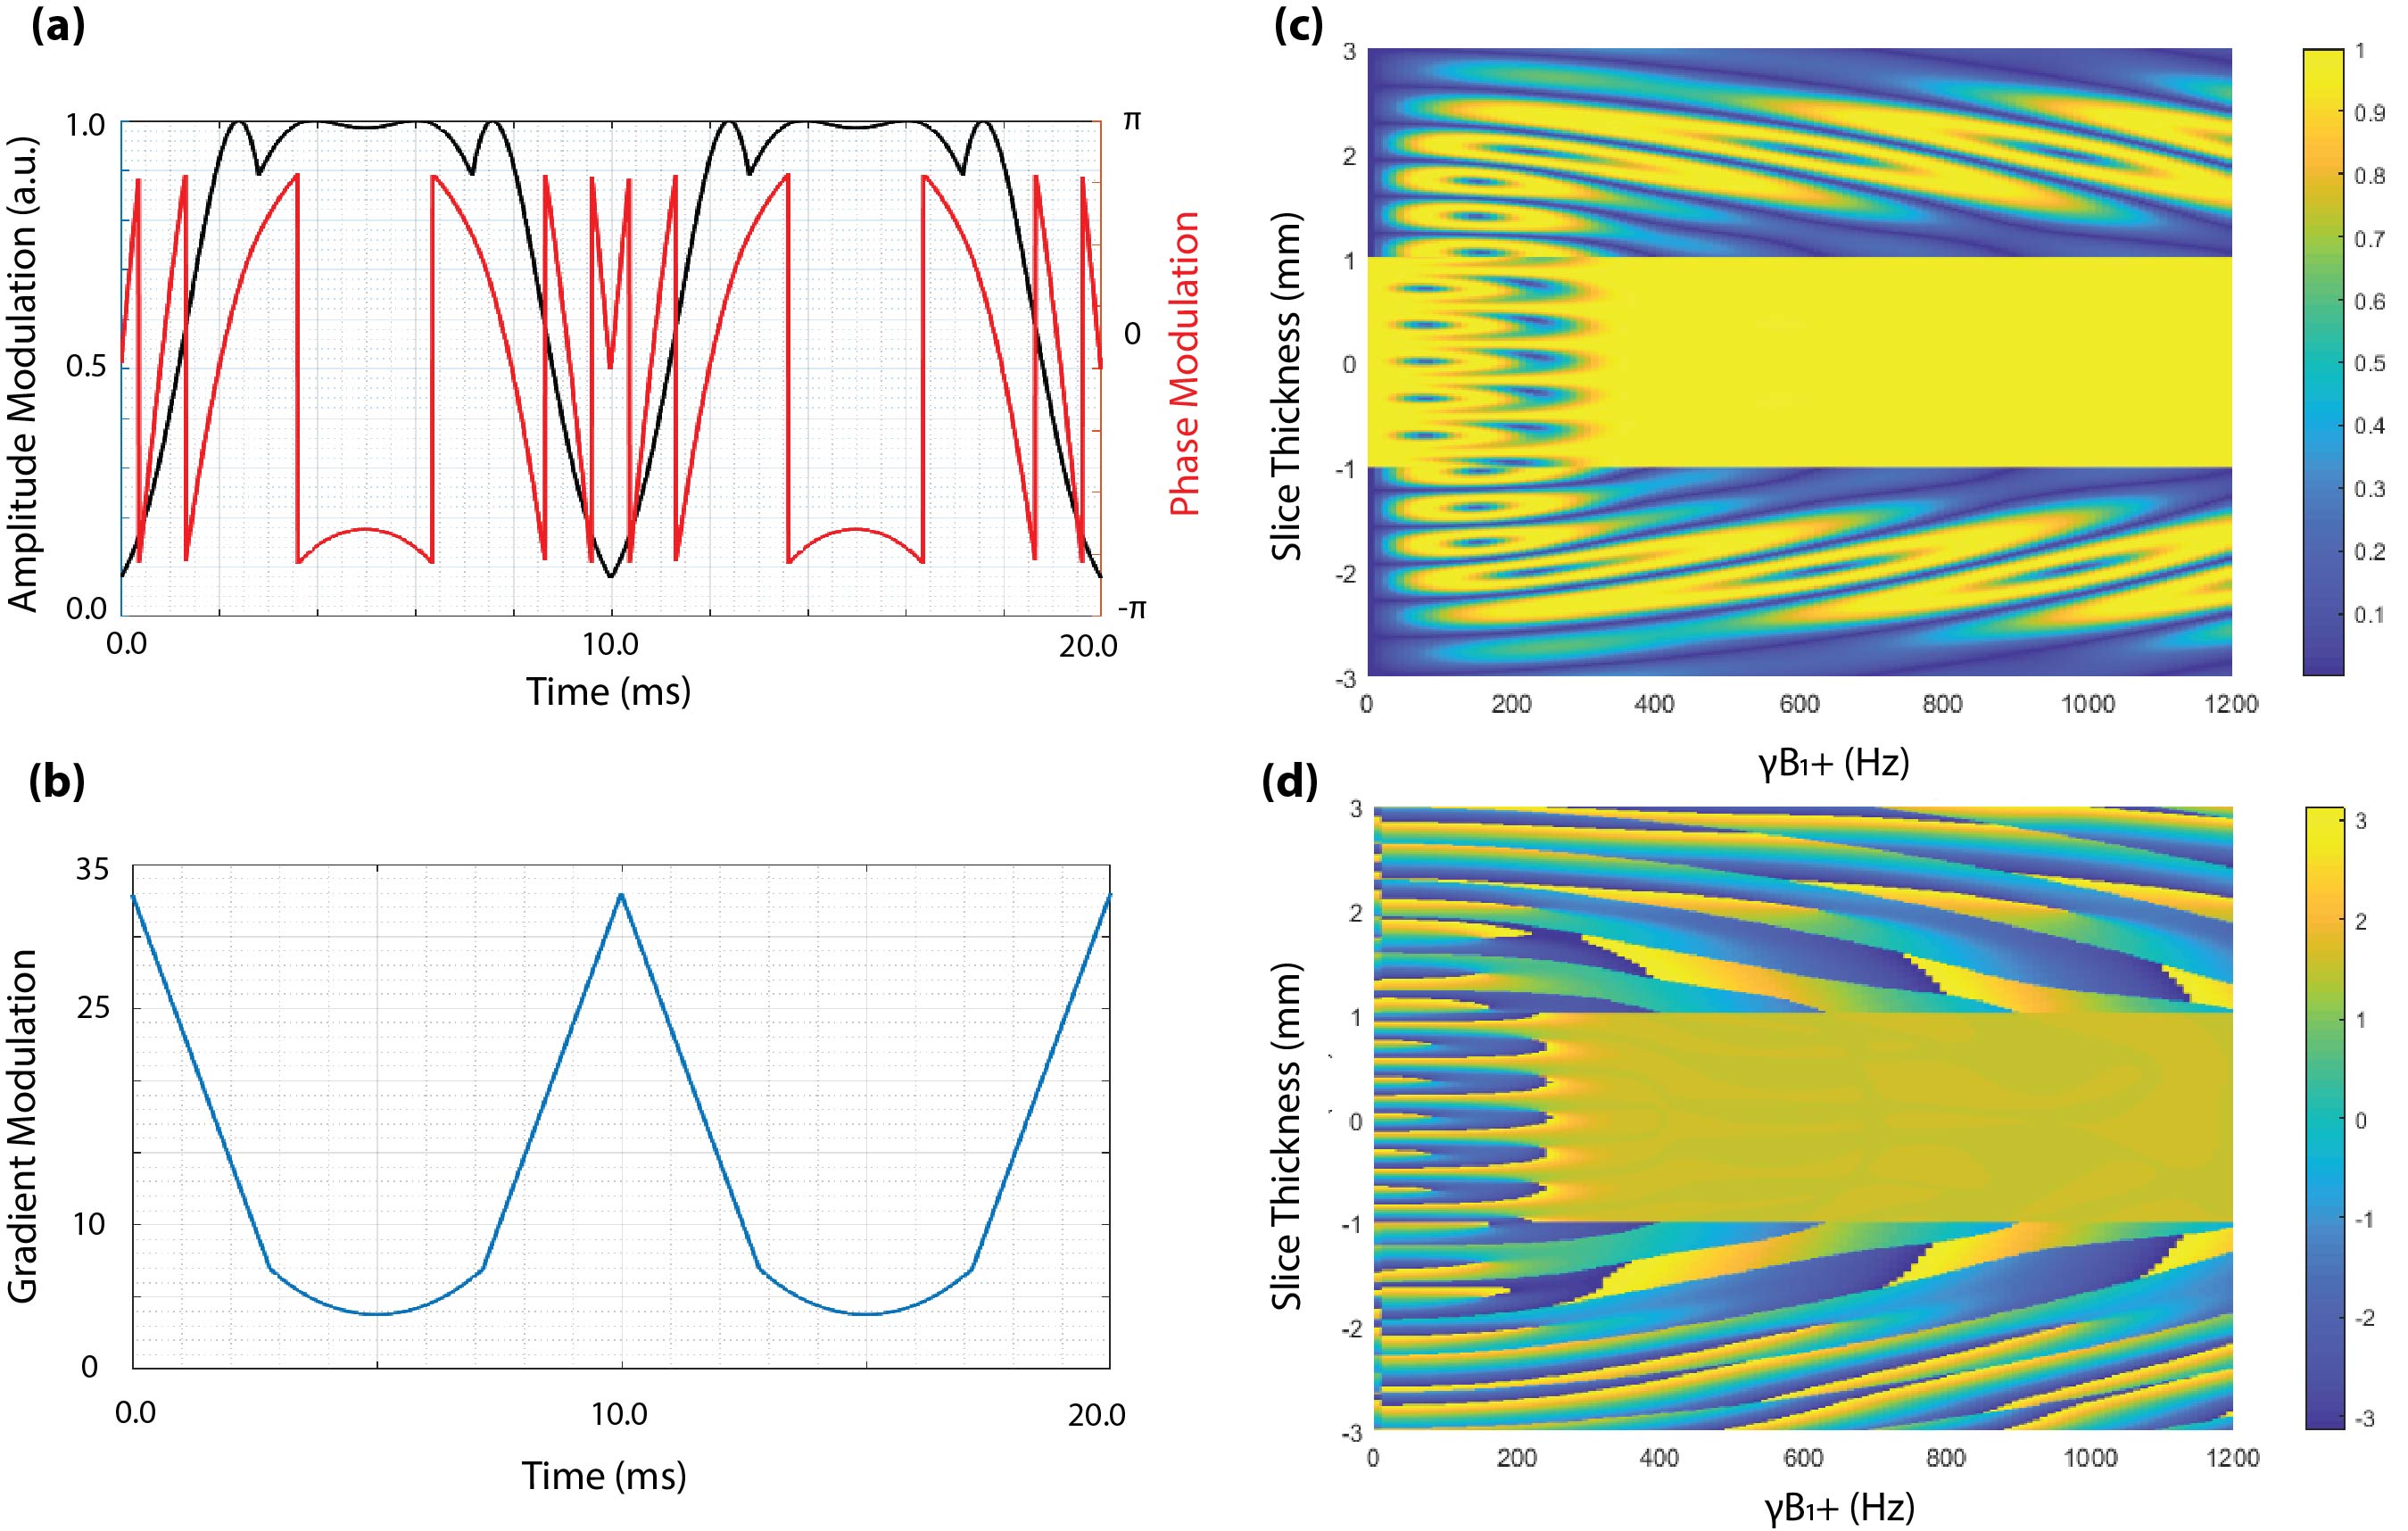
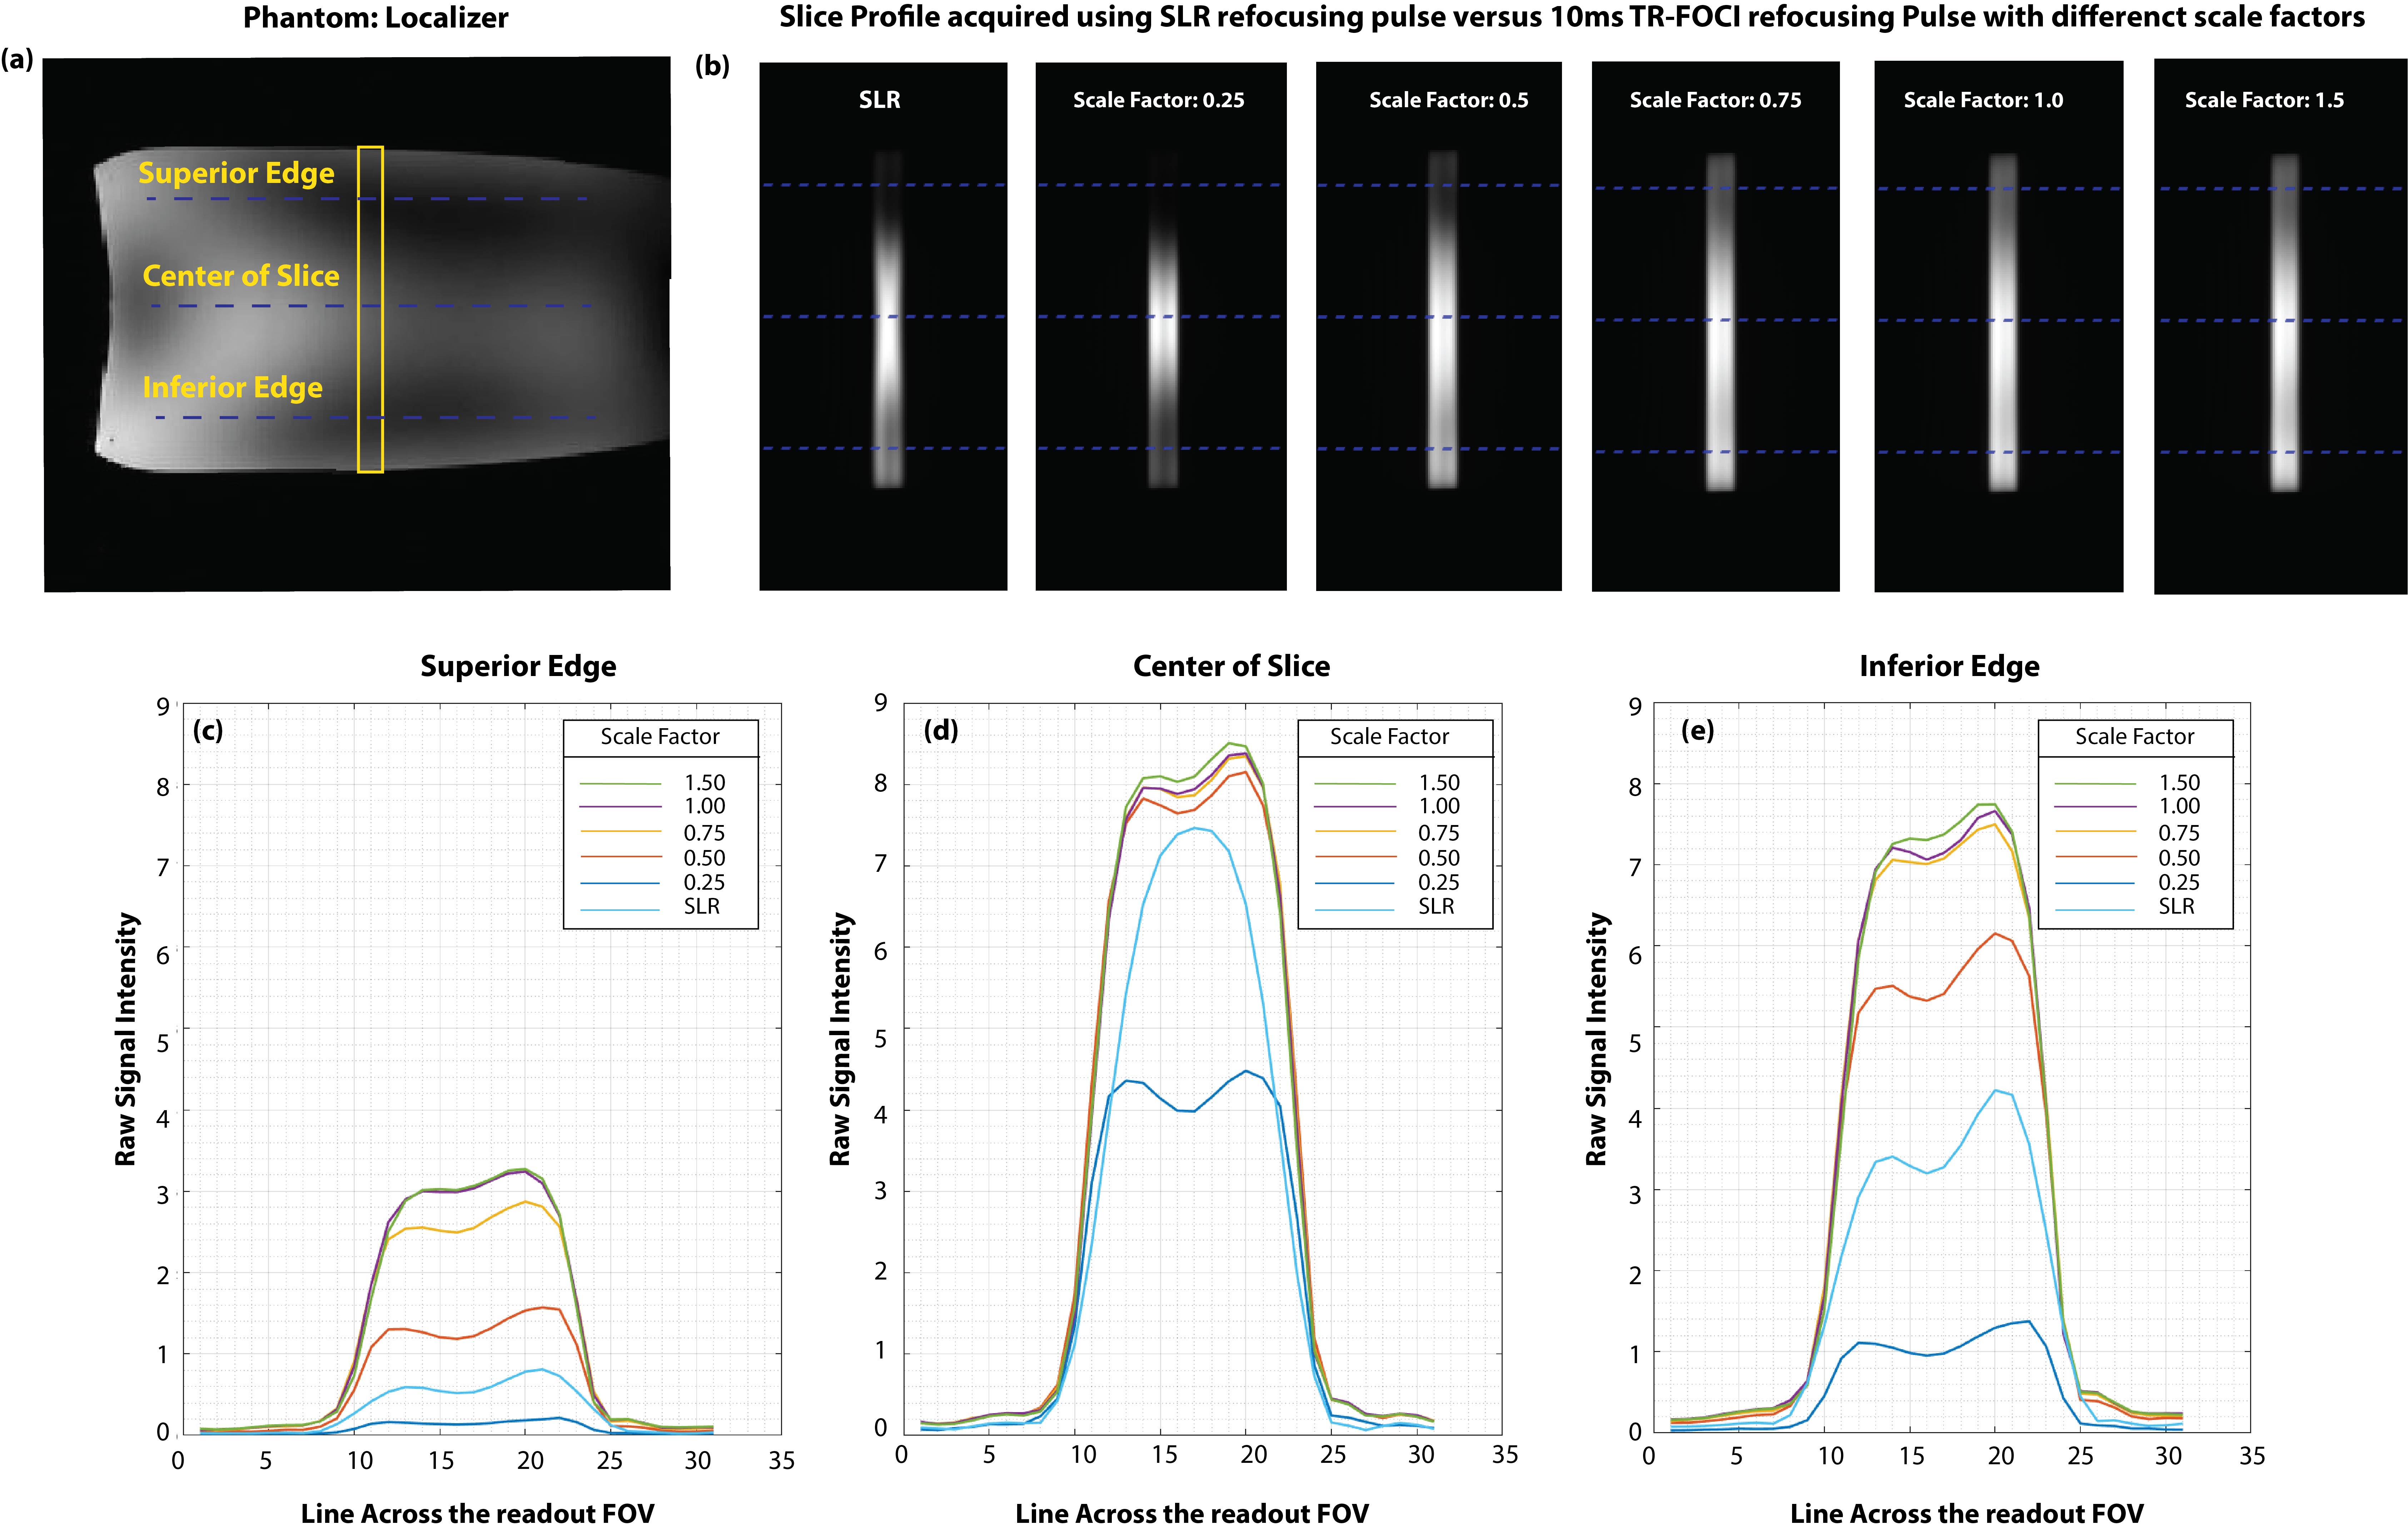
The institutional human ethics committee approved the project. After obtaining voluntary, written informed consent, three participants were scanned using a MAGNETOM 7T whole-body research scanner (Siemens Healthcare, Erlangen, Germany) with a 32-channel head coil (Nova Medical, USA). Pulse sequence: The twice-refocused diffusion EPI sequence (Fig. 1) was modified, by replacing the 180-degree SLR pulses with TR-FOCI pulses. In this configuration, the second refocussing pulse nulls the eddy currents with a single exponential constant (3). The quadratic phase induced by the first refocussing pulse is compensated by the second one to ensure that the ensemble of the spins have a zero phase across the slice profile. RF pulse design and simulations: We used a genetic algorithm and hill-climbing to optimize the base pulse, reshaping, and resampling function parameters for a TR-FOCI pulse. The pulse length was set to 10 ms with a desired refocussing slice thickness of 2 mm (10% wider than the excitation slice thickness) (4). Figure 2 shows concatenated optimized refocusing pulses (a) and associated gradient waveforms (b). The amplitude and phase of the simulated slice profiles, assuming perfect slice excitation, are shown in figures 2-c and 2-d. These simulations suggest that the B1+ value of 9 T (B1+ 380 Hz) is the minimum required B1+ value for the adiabaticity of the pulse. We verified the required power of the adiabatic refocusing pulse on a cylindrical phantom, in three steps; 1) we modified a basic GRE sequence by adding the twice-refocussing scheme and applying the readout in the slice direction so that we could image the slice profile. 2) we used turbo-flash based B1+ maps (5) to calibrate the reference transmitter voltage such that a 90° flip angle was achieved at the center of the slice (Figure 3-a). 3) we applied scale factors (0.25, 0.5, 0.75, 1, and 1.5) for the amplitude of the adiabatic pulse and measured the raw signal intensities at three different regions. Imaging: We compared the performance of the modified sequence against the SLR based product implementation. A set of images with zero diffusion weighting (b = 0) were obtained (10 slices, 500% distance factor, 230 mm FOV, 1.8 mm isotropic resolution, 2056 Hz/px readout bandwidth, GRAPPA = 3, TR = 15000 ms). Both acquisitions used the minimum TE to get the best SNR; the TR-FOCI resulted in higher minimum TE of 78ms compared with 68ms for the product sequence, due to longer pulse durations. The SNR was assessed using the Kellmann method (6) and relative SNR maps were calculated as the ratio of adiabatic SNR map over the SLR-based SNR map.Results and Discussion
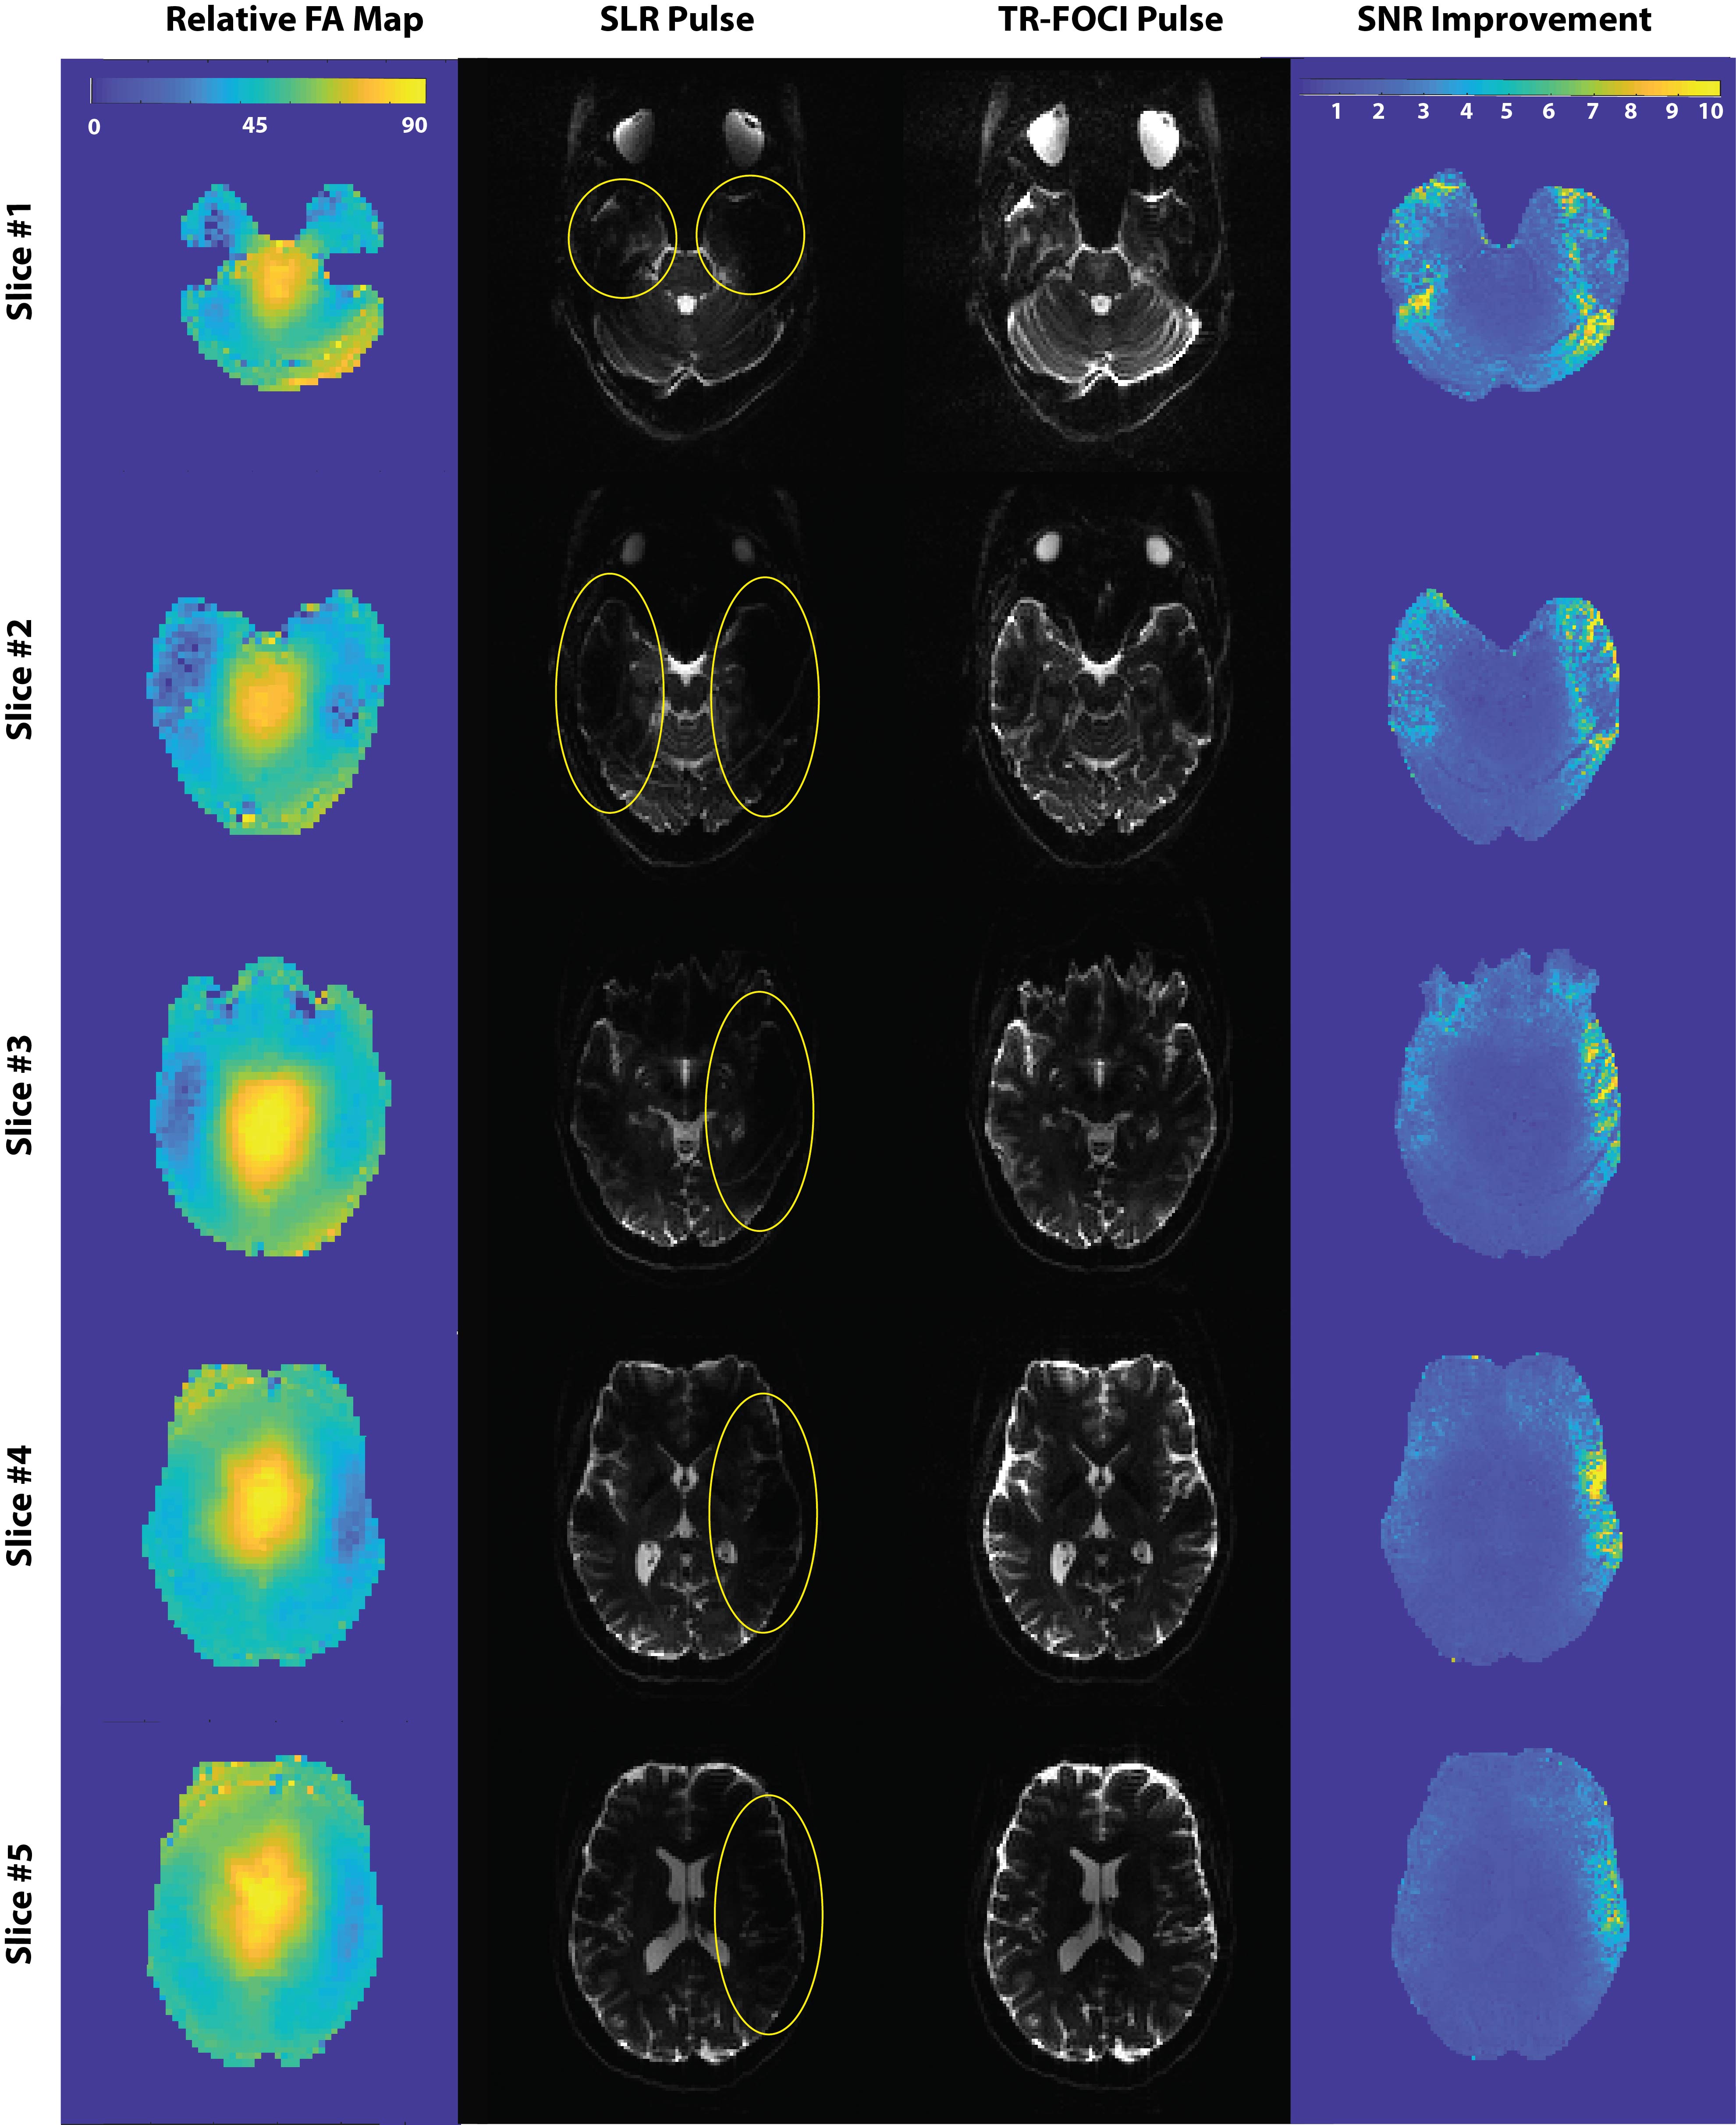
The results of the slice profile imaging experiment (Figure 3) suggested that the simulated value of 9 T (scale factor = 1.0) was enough for the adiabatic condition of the pulse to be met. The relatively lower signal value at the edges is the result of a non-uniform SLR-based excitation pulse as well as the projection of the proton density over a round object. Further scrutiny of the slice profiles (Fig3 c-e) reveals that the scale factor of 0.75 still yields an acceptable signal uniformity with only 5% signal loss compared to the scale factor of 1.0; this helped us to compromise the signal for SAR in our in vivo experiment. Figure 4 shows that the use of TR-FOCI pulse significantly improves the image quality in critical areas of the brain that suffer from B1+ non-uniformity at 7T. The adiabatic pulse restored the signal loss due to low B1+ in the superior and inferior edges of the slice, corresponding to the temporal lobes of the brain, compared to its SLR counterpart (Fig 4). The SNR maps show that the signal is restored up to a factor of 10 at those areas. The asymmetry of the SNR improvement might be due to the B0 inhomogeneity. However, at the inferior slices where the B1+ is very low, the fat saturation pulse starts to fail and a residual fat band became visible, highlighting the need to tailor the fat saturation pulse to ultra-high field strength as well. The SAR percentage, as indicated by the scanner, increased from 8% for the product sequence to 45% for our modified implementation.Conclusion
TR-FOCI pulses when used in twice-refocused diffusion sequences can effectively mitigate the B1+ inhomogeneity at 7T, albeit at increased TE and SAR. Interestingly, the TR-FOCI pulse, which originally was optimized for inversion, performs remarkably well as a refocusing pulse. However, further pulse optimization, more specifically for refocusing could improve the technique. As the improved image quality was achieved at a higher cost of SAR, the work could benefit from slice-by-slice optimized pulse amplitudes (7).Acknowledgements
No acknowledgement found.References
1. Mori S. Introduction to diffusion tensor imaging: Elsevier; 2007.
2. Ibrahim TS, Lee R, Abduljalil AM, Baertlein BA, Robitaille P-ML. Dielectric resonances and B 1 field inhomogeneity in UHFMRI: computational analysis and experimental findings. Magnetic resonance imaging. 2001;19(2):219-26.
3. Reese TG, Heid O, Weisskoff R, Wedeen VJ. Reduction of eddy‐current‐induced distortion in diffusion MRI using a twice‐refocused spin echo. Magnetic Resonance in Medicine. 2003;49(1):177-82.
4. Hurley AC, Al‐Radaideh A, Bai L, Aickelin U, Coxon R, Glover P, et al. Tailored RF pulse for magnetization inversion at ultrahigh field. Magnetic resonance in medicine. 2010;63(1):51-8.
5. Chung S, Kim D, Breton E, Axel LJMrim. Rapid B1+ mapping using a preconditioning RF pulse with TurboFLASH readout. Magnetic Resonance in Medicine. 2010;64(2):439-46.
6. Kellman P, McVeigh ERJMrim. Image reconstruction in SNR units: a general method for SNR measurement. Magnetic Resonance in Medicine. 2005;54(6):1439-47.
7. Shahrokh Abbasi‐Rad KOB, Samuel Kelly, Viktor Vegh, Anders Rodell, Yasvir Tesiram, Jin Jin, Markus Barth, Steffen Bollmann. Improving FLAIR SAR efficiency at 7T by adaptive tailoring of adiabatic pulse power through deep learning B1+estimation. Magnetic Resonance in Medicine. 2020.
Figures