0915
Feasibility of a single low dose dual temporal resolution DCE-MRI method for whole-brain, high-spatial resolution parametric mapping1Division of Informatics, Imaging and Data Sciences, The University of Manchester, Manchester, United Kingdom, 2Department of Neurosurgery, Salford Royal NHS Foundation Trust, Manchester, United Kingdom, 3Division of Neuroscience and Experimental Psychology, The University of Manchester, Manchester, United Kingdom
Synopsis
This study sought to evaluate the feasibility of using a low gadolinium-based contrast agent (GBCA) dose protocol with a newly developed analysis technique, the LEGATOS method, for deriving whole-brain, high-spatial resolution pharmacokinetic parameters from dual-temporal resolution (DTR) DCE-MRI. Through Monte Carlo simulations and an in vivo study incorporating histopathological data the accuracy of pharmacokinetic parameters derived using a low-dose interleaved protocol and LEGATOS was assessed. Our results demonstrate that this approach permitted the derivation of accurate, tissue-validated high-spatial resolution kinetic parameter estimates following a single low-dose injection, representing in some patients a greater than 80% reduction in GBCA dose.
Introduction
Pharmacokinetic parameters derived from dynamic contrast-enhanced (DCE) MRI have a growing role as biomarkers of brain tumor microenvironment and anti-angiogenic response. A key limitation of current techniques, however, is the spatial resolution, volume coverage and accuracy of derived kinetic parameters. There is furthermore increasing concern about gadolinium deposition in the CNS of patients undergoing repeated gadolinium-based contrast agent (GBCA) exposures1. This study sought to evaluate the feasibility of using a new DCE-MRI analysis technique, the LEGATOS (LEvel and rescale the GAdolinium contrast concentrations curves of high-temporal TO high-Spatial)2, and a low GBCA dose protocol for deriving high-spatial resolution pharmacokinetic parameters from dual-temporal resolution (DTR) DCE-MRI. In particular the accuracy of derived parameters using this new low GBCA dose technique was evaluated through both Monte Carlo simulations and an in vivo study incorporating correlation with histopathological data.Methods
Eleven patients with vestibular schwannoma (VS), including one patient with bilateral neurofibromatosis type 2 related VS, were imaged at 1.5T using a single-injection, low-dose DTR DCE-MRI acquisition with an interleaved sampling strategy (Figure 1A). Following a low-dose (3 ml) GBCA administration, an interleaved high-temporal resolution, HT (voxel size of 2.5x2.5x5 mm, Dt = 1.46 s) and high-spatial resolution, HS (voxel size of 1x1x2.5 mm, Dt = 6.04 s) acquisition was performed. Variable flip-angle (VFA, α = 2°, 6°, 12° and 16°) acquisitions matched in image dimensions to the HT and HS frames of the interleaved protocol were performed prior to the dynamic DCE series for R1N mapping.Native 4D HT dynamic images were co-registered and resliced to a HS baseline image frame and the signal intensity-time curves converted to contrast concentration curves using their respective baselines and R1N. The HTaligned concentration-time course was then concatenated with later concentration-time points obtained from the low-dose HS resolution series segments, generating a 4D HTHS-merged concentration volume (Figure 1B). After rescaling the high-temporal but low-spatial resolution first-pass concentration curves to higher spatial resolution using the LEGATOS method2 the tissue concentration-time curves of this 4D HTHS-merged concentration volume were fitted to the extended Tofts model (ETM). As part of each fitting procedure a map of scaled fitting error (SFE) was also generated to assess the discrepancy between the derived curve and the original data3.
To investigate the effect of low contrast-to-noise (CNR) of the high spatial resolution MRI series on parameter accuracy while using the single low dose HT-HS interleaved DCE-MRI protocol, Monte Carlo simulations were used. A simulated tumor tissue concentration-time curve was synthesized using in vivo pharmacokinetic parameter values from a VS and converted into signal intensity (SI)-time curve. These simulated SI-time curves were then sampled with dual temporal resolution and addition of Rician white noise at three different noise levels (NL = SD/mean baseline signal): 1) a lower noise level resembling the HT series (NLHT); 2) a higher noise level resembling the HS series (NLHS); and 3) a mixed noise level, resembling the in vivo HT-HS interleaved SI-time curve (NLHT-HS). Kinetic analysis was performed with the three different noise levels and the percent deviations (PD) of the “measured” values from the “true” values calculated as PD=(measured–true)/true. For each noise condition a total of 10,000 repetitions were performed and reported as the mean and SD of PD for each estimate.
Finally, to evaluate correlation with histopathological data, tissue from 10 tumors imaged as part of the in vivo study was examined with markers for microvessels (CD31) and cell density (H&E) and the inter-tumor correlation between DCE-MRI derived parameter estimates (Ktrans, vp and ve) and tissue-derived metrics (H&E cell density and CD31 microvessel surface area) reported as Pearson’s product moment correlation coefficient (r).
Results
Monte Carlo SimulationAs shown in Figure 2, the mean PD of Ktrans, vp and ve and the mean SFE from the 10,000 Monte Carlo repetitions was significantly less for the noise level resembling the in vivo HT-HS interleaved SI-time curve, NLHT-HS, than values obtained at the higher noise level resembling the HS series alone, NLHS (P < 0.0001, t-test).
In vivo evaluation
Representative kinetic parameter maps from a large VS imaged using the low-dose interleaved DCE-MRI acquisition protocol are shown in Figure 3. LEGATOS reconstruction permitted better visualization of intratumoral heterogeneity in the vp, Ktrans and ve maps relative to use of the native HT datasets alone. Correlation indices between imaging and tissue analysis in 10 resected VS that underwent the single-injection, low-dose interleaved study are shown in Figure 4. Microvessel SA correlated with both vp (r=0.76, p=0.02) and Ktrans (r=0.68, p=0.04) estimates derived using the LEGATOS approach.
Discussion
In this feasibility study we demonstrate that application of a new DTR DCE-MRI analysis method, LEGATOS, with an interleaved HT-HS scan protocol permits the derivation of accurate, tissue-validated high-spatial resolution kinetic parameter estimates following a single low-dose contrast agent injection. In patients undergoing repeated contrast agent exposures and/or clinical trials where microvascular parameters are felt to be relevant outcome markers the use of LEGATOS with a low-dose interleaved protocol may allow significant reduction in contrast dose, and thereby potential brain gadolinium deposition1,4. Further dedicated studies incorporating LEGATOS and low GBCA dose acquisition protocols should be undertaken to better evaluate the clinical applicability of this technique.Acknowledgements
The work was supported by funding from the CRUK Cancer Imaging Centre in Cambridge and Manchester (C8742/A18097) and the Dowager Countess Eleanor Peel Trust.References
1. Mallio CA, Rovira À, Parizel PM, Quattrocchi CC. Exposure to gadolinium and neurotoxicity: current status of preclinical and clinical studies. Neuroradiology 2020;62 925–934.
2. Li K-L, Lewis D, Jackson A, Zhao S, Zhu X. Improving quantification accuracy in whole brain high-spatial resolution 3D kinetic mapping: Development of a novel dual temporal resolution DCE-MRI technique. In Proceedings of the 27th Annual Meeting of ISMRM, Montreal, Canada, 2019. p. 4409. 2019.
3. Li KL, Wilmes LJ, Henry RG, Pallavicini MG, Park JW, Hu-Lowe DD, McShane TM, Shalinsky DR, Fu YJ, Brasch RC, Hylton NM. Heterogeneity in the angiogenic response of a BT474 human breast cancer to a novel vascular endothelial growth factor-receptor tyrosine kinase inhibitor: Assessment by voxel analysis of dynamic contrast-enhanced MRI. J Magn Reson Imaging 2005;22(4):511-519.
4. Gong E, Pauly JM, Wintermark M, Zaharchuk G. Deep learning enables reduced gadolinium dose for contrast-enhanced brain MRI. J Magn Reson Imaging 2018;48:330–340.
Figures
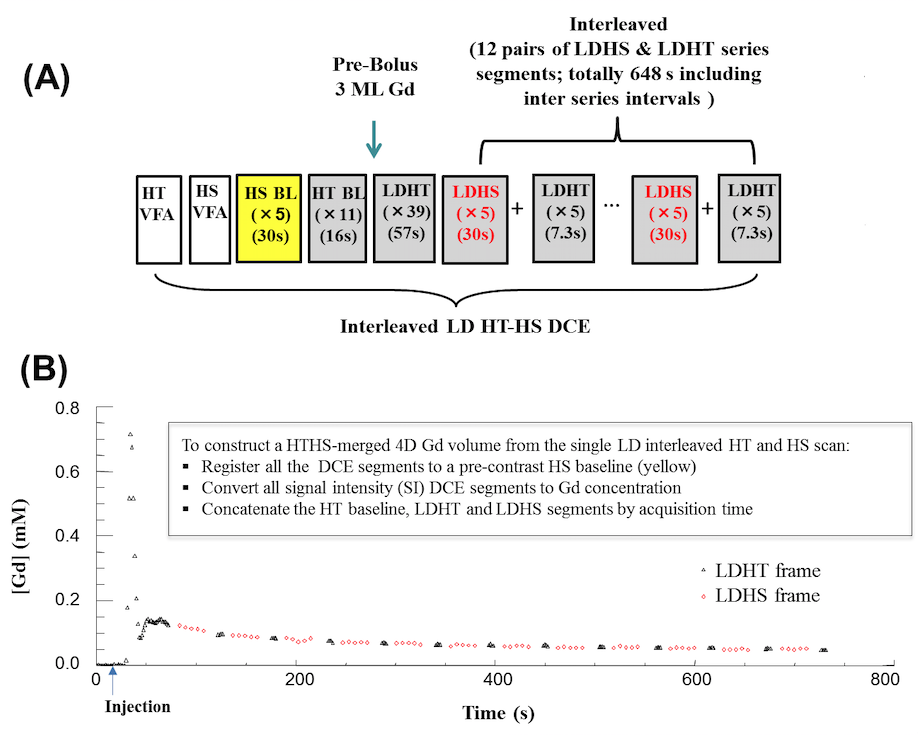
FIGURE 1: Single injection, low-dose interleaved HT-HS protocol
(A) Timeline for the low dose HT-HS interleaved DCE-MRI acquisition protocol.
(B) Contrast agent concentration-time course measured from a region-of-interest in the superior sagittal sinus. The arterial phase of the concentration-time course is sampled through the use of 50 dynamic HT frames at the start of the acquisition to allow for accurate discrimination between plasma volume and plasma-leakage effects. Later concentration-time points are sampled using 12 pairs of interleaved LDHS & LDHT series segments.
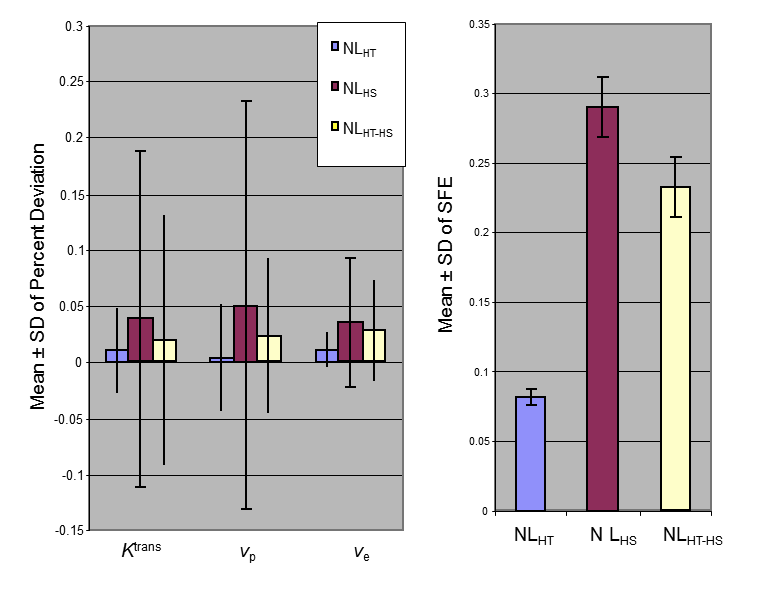
Figure 2: the effects of Rician noise levels on parameter accuracy
Mean ± SD of percent deviations (PD) for Ktrans, vp, and ve, and mean ± SD of SFE of 10000 Monte Carlo repetitions simulated with “true” Ktrans=0.26 min-1, vp=0.07, and ve=0.5 using the HT-HS interleaved timeline illustrated in Figure 1. Values for three different noise levels (NL) shown: 1) a lower noise level resembling the in vivo HT series, NLHT(=0.038); 2) a higher noise level resembling the in vivo HS series, NLHS (=0.12); 3) a mixed noise level, NLHT-HS (i.e., NL0.038-NL0.12 interleaved), resembling the in vivo data.
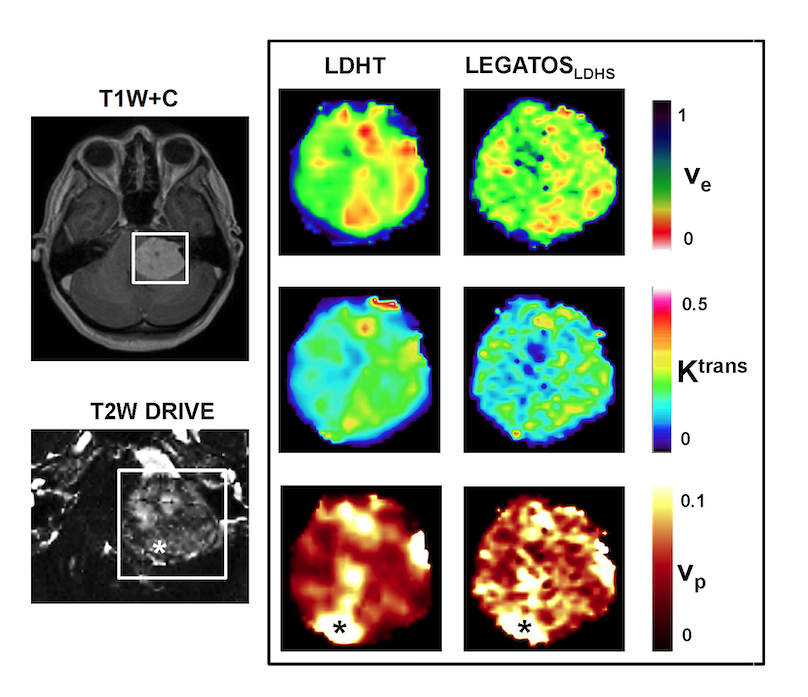
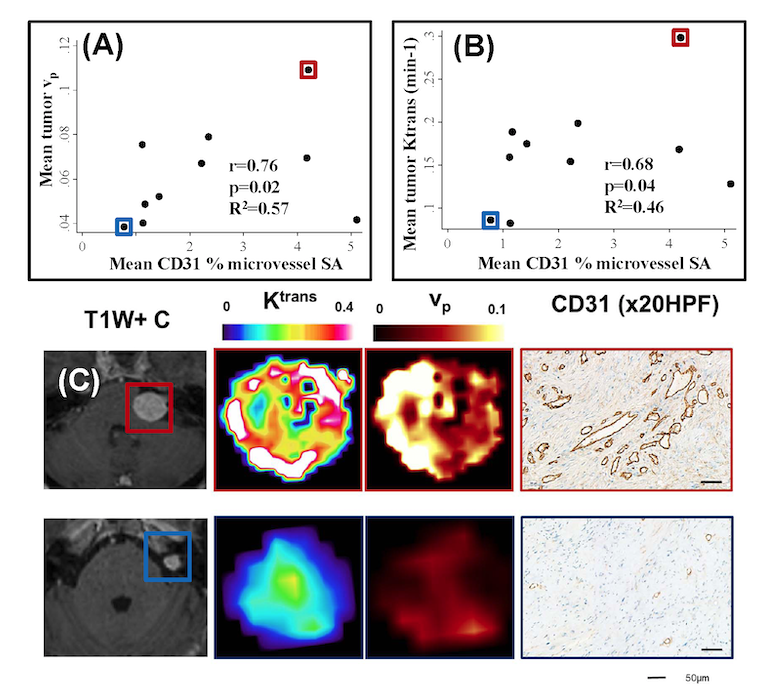
Figure 4: Comparison of LEGATOS derived vp and Ktrans estimates from the in vivo single-injection low-dose DTR Study against tissue derived parameters
(A) Inter-tumor scatterplot comparison of LEGATOS derived mean tumor vp estimates against mean CD31 % microvessel surface area (SA).
(B) Inter-tumor scatterplot analysis of LEGATOS derived mean tumor Ktrans (min-1) against mean CD31 % microvessel surface area (SA).
(C) Representative imaging and histology from a patient with a growing highly vascular VS (top row) and a comparatively less vascular static VS (bottom row) are shown.