0911
Feasibility of a Novel Sampling/Reconstruction Method Ensuring a SNR Benefit Over the Traditional Sampling Approach1Physics and Astronomy, The University of Western Ontario, London, ON, Canada, 2Lawson Health Research Institute, London, ON, Canada, 3School of Biomedical Engineering, The University of Western Ontario, London, ON, Canada
Synopsis
To produce high-SNR images, MRI systems usually employ many signal averages, expensive high field-strength coils, and/or expensive contrast agents. The proposed sampling and reconstruction method, requiring no hardware modifications, would produce images with higher SNR without increasing scan times. Nine under-sampled images are averaged for every combination of images, and the resulting SNR vs. averages function is fitted according to the Stretched-Exponential Model (SEM). The resulting reconstructed image yielded higher SNR than the original image for all three imaging schemes (FGRE, x-Centric, FE-Sectoral), demonstrating the feasibility of the proposed method for the first time.
Introduction
The MRI modality is generally a low sensitivity method1 due to the nature of the MRI-signal formation governed by a very small number of the nuclear spins that contribute to the resulting signal. It is well known that the resolution of any imaging modality always depends on the signal-to-noise ratio (SNR). For MRI, this limitation is mostly solved only for high field clinical 1H MRI measurements. In this particular case, the low sensitivity can be overcome by very high concentrations of water content in body tissue and the high gyromagnetic ratio of 1H. Unfortunately, this is the only example when the image-quality and image-resolution are acceptable. In cases of other nuclei with low gyromagnetic ratios (e.g., 13C/23Na/129Xe)2-4, low isotopic natural-abundance (2Deuterium)5, low-density (1H/3He/19F thermally polarized gases)6-8, or low field MRI9, image quality remains a longstanding scientific problem which can presently be solved by using expensive MRI-hardware or expensive enriched isotopes. Alternatively, higher SNR can be achieved by performing many averages during, for example, a breath-hold as in the case of the 19F lung MRI.10 We propose a new method that does not require any extra MRI-hardware or signal averaging to significantly improve the quality of MRI images. We will use a significant k-space under-sampling acquisition method where only 10% of the k-space points will be acquired per image, resulting in an accelerated type of k-space data acquisition with acceleration factor (AF) of 10. Thus, the time necessary to acquire one fully-sampled image should be equal to the time needed to acquire ten under-sampled images. The MRI image SNR is directly proportional to the spin-density and √(signal averages), so one can average ten different under-sampled k-spaces together using a specific averaging-pattern, generating 14 under-sampled k-spaces with different SNR levels. It can be assumed that this SNR difference reflects the spin-density difference rather than the actual signal level difference. In this case, a density decay curve can be fitted and reconstructed using the Stretched-Exponential-Model (SEM) combined with Compressed Sensing (CS).11,12 We hypothesize that the SEM-equation can be adapted for fitting the SNR dependence of the MR-signal similar to fitting time/b-value dependences.13,14Methods
1H MR was performed on a resolution-phantom at 3.0T (MR750, GEHC, WI) using a clinical gradient coil set and commercial head RF coil. The following parameters were used: FOV=10x10cm2, Matrix=128x128, TE/TR=1ms/3sec, BW=32kHz, 90°. Nine 2D single-averaged fully-sampled k-spaces were acquired. We have obtained five k-spaces using 9-averages, 8-averages, 7-averages, 6-averages, and 5-averages (1_k-space each); two k-spaces using 4-averages (2_combinations); three separate k-spaces using 3-averages (3_ combinations); and four separate k-spaces using 2-averages (4_ combinations). This resulted in 14 k-spaces total. Three Cartesian sampling schemes (FGRE, x-Centric15 and 8-sector FE_Sectoral16) were used. 14 fully-sampled k-spaces were retroactively under-sampled (AF=7/10/14) in the wash-out or SNR attenuation direction. Figure_1 shows the under-sampling patterns for three sampling schemes/AF. The signal-intensity of the under-sampled k-spaces were represented as a function of the image number (Figure_3) and then fit following Abascal method.12 Values of $$$\boldsymbol{n}$$$ =1, …,14 were used to fit the under-sampled data and generate the pseudo mean fractional-ventilation maps. For simplicity, one can assume that the SNR attenuation reflects a decrease of the fluorinated-gas in the lung after delivery of the oxygen wash-out breaths.7 Clearly, each new wash-out breath of oxygen replaces some volume of the fluorinated-gas in lung, so the signal-intensity of the resulting images were gradually attenuated. The following equation can be fitted to the wash-out data:17 $$$\boldsymbol{S(n)} = \boldsymbol{S_0(1-r)^n}$$$, where S0 is the initial signal, n is the breath number, S(n) is the signal intensity after the nth wash-out breath and r is the fractional-ventilation parameter.7,17 r can be expressed as the fraction of fresh gas entering the lung and the total volume of gas within the lung ($$$V_{total}$$$):7,17 $$$r = V_{new}/V_{total}$$$ or $$$V_{new}/(V_{new}+V_{old})$$$. To generate a pseudo r-value the traditional approach17 was utilized. The SNR of the original/averaged/reconstructed images were then calculated.Results
Figure_2 shows 8 images generated by averaging (1-8) and one original image. The SNR of the 9 k-space averaged image was 22 and the SNR of the original image was 6.5. Figure_4 shows the reconstructed images for three sampling-schemes and three AF. SNRFGRE/SNRx-Centric/SNRSectoral=20/28/25.Figure_5 shows pseudo-fractional-ventilation maps obtained for three sampling-schemes and three AF. The figure legend shows the MRI-based mean r; the r-value obtained for the fully-sampled case was 0.30 ± 0.01.
Discussion and Conclusion
In this proof-of-concept study, we showed that the SEM equation can be adapted for fitting the SNR attenuation dependence of the MR-signal, similar to fitting the time/b-value dependences. The reconstructed images yielded improved SNR over the original fully-sampled images (>20 vs. 6.5) for all three imaging schemes, with comparable or identical imaging times. Due to this technique not requiring extra hardware, the proposed method could be implemented in current MRI-systems and yield improved images. Further comparison of identifiable biomarkers between the reconstructed and original images would determine accuracy of the reconstruction, with the goal of possible integration into clinical-MRI-systems. One potential limitation of the method is the CS-based reconstruction leading to the artefacts clearly visible for higher AF (FGRE/x-Centric); however, this can be minimized by using a Deep Learning-based correction after the fact.18-20Acknowledgements
No acknowledgement found.References
- Song, X.-x., Liu, Z.-j., Xu, X.-z. & Tang, Q. Highly sensitive MRI contrast agent for enhanced visualization of tumors. New J. Chem. 38, 3813-3818, doi:10.1039/c4nj00183d (2014).
- Thind, K. et al. Detection of radiation-induced lung injury using hyperpolarized (13)C magnetic resonance spectroscopy and imaging. Magn Reson Med 70, 601-609, doi:10.1002/mrm.24525 (2013).
- Fox, M. S. et al. Detection of radiation induced lung injury in rats using dynamic hyperpolarized (129)Xe magnetic resonance spectroscopy. Med Phys 41, 072302, doi:10.1118/1.4881523 (2014).
- Farag, A. et al. Unshielded asymmetric transmit-only and endorectal receive-only radiofrequency coil for (23) Na MRI of the prostate at 3 tesla. J Magn Reson Imaging 42, 436-445, doi:10.1002/jmri.24798 (2015).
- LaPlante, G., Ouriadov, A. V., Lee-Sullivan, P. & Balcom, B. J. Anomalous moisture diffusion in an epoxy adhesive detected by magnetic resonance imaging. Journal of Applied Polymer Science 109, 1350-1359, doi:10.1002/app.28106 (2008).
- Zhang, Z., Ouriadov, A. V., Willson, C. & Balcom, B. J. Membrane gas diffusion measurements with MRI. J Magn Reson 176, 215-222, doi:10.1016/j.jmr.2005.06.009 (2005).
- Ouriadov, A. V. et al. In vivo regional ventilation mapping using fluorinated gas MRI with an x-centric FGRE method. Magn Reson Med 74, 550-557, doi:10.1002/mrm.25406 (2015).
- Richards, M. G. in Advances in Magnetic and Optical Resonance Vol. 5 (ed John S. Waugh) 305-352 (Academic Press, 1971).
- Wawrzyn, K., Ouriadov, A., Hegarty, E., Hickling, S. & Santyr, G. Mapping 129 Xenon ADC of Radiation-Induced Lung Injury at Low Magnetic Field Strength Using a Sectoral Approach. Proceedings of the 23th Annual Meeting of ISMRM, Toronto, Canada, 1492 (2015).
- Couch, M. J. et al. Pulmonary ultrashort echo time 19F MR imaging with inhaled fluorinated gas mixtures in healthy volunteers: feasibility. Radiology 269, 903-909, doi:10.1148/radiol.13130609 (2013).
- Westcott, A., Guo, F., Parraga, G. & Ouriadov, A. Rapid single-breath hyperpolarized noble gas MRI-based biomarkers of airspace enlargement. J Magn Reson Imaging 49, 1713-1722, doi:10.1002/jmri.26574 (2019).
- Abascal, J., Desco, M. & Parra-Robles, J. Incorporation of Prior Knowledge of Signal Behavior Into the Reconstruction to Accelerate the Acquisition of Diffusion MRI Data. IEEE Trans Med Imaging 37, 547-556, doi:10.1109/TMI.2017.2765281 (2018).
- Berberan-Santos, M. N., Bodunov, E. N. & Valeur, B. Mathematical functions for the analysis of luminescence decays with underlying distributions 1. Kohlrausch decay function (stretched exponential). Chemical Physics 315, 171-182, doi:10.1016/j.chemphys.2005.04.006 (2005).
- Parra-Robles, J., Marshall, H. & Wild, J. M. Characterization of 3He Diffusion in Lungs using a Stretched Exponential Model [abstract]. ISMRM 21st Annual Meeting, 0820 (2013).
- Ouriadov, A. V. & Santyr, G. E. High spatial resolution hyperpolarized (3) He MRI of the rodent lung using a single breath X-centric gradient-recalled echo approach. Magn Reson Med 78, 2334-2341, doi:10.1002/mrm.26602 (2017).
- Khrapitchev, A. A., Newling, B. & Balcom, B. J. Sectoral sampling in centric-scan SPRITE magnetic resonance imaging. J Magn Reson 178, 288-296, doi:10.1016/j.jmr.2005.10.006 (2006).
- Santyr, G. E., Lam, W. W. & Ouriadov, A. Rapid and efficient mapping of regional ventilation in the rat lung using hyperpolarized 3He with Flip Angle Variation for Offset of RF and Relaxation (FAVOR). Magn Reson Med 59, 1304-1310, doi:10.1002/mrm.21582 (2008).
- Yang, Y., Sun, J., Li, H. & Xu, Z. ADMM-CSNet: A Deep Learning Approach for Image Compressive Sensing. IEEE Trans Pattern Anal Mach Intell 42, 521-538, doi:10.1109/TPAMI.2018.2883941 (2020).
- Hammernik, K. et al. Learning a variational network for reconstruction of accelerated MRI data. Magn Reson Med 79, 3055-3071, doi:10.1002/mrm.26977 (2018).
- Yang, G. et al. DAGAN: Deep De-Aliasing Generative Adversarial Networks for Fast Compressed Sensing MRI Reconstruction. IEEE Trans Med Imaging 37, 1310-1321, doi:10.1109/TMI.2017.2785879 (2018).
Figures
Figure 2. Pseudo Wash-out Images Obtained in Resolution Phantom
Depicts 8 images (1-8) generated using the proposed averaging pattern and the original image (9), acquired at the 3T GE scanner. SNR of the first image (9 k-space averages) was 22 and SNR of the last image was 6.5.
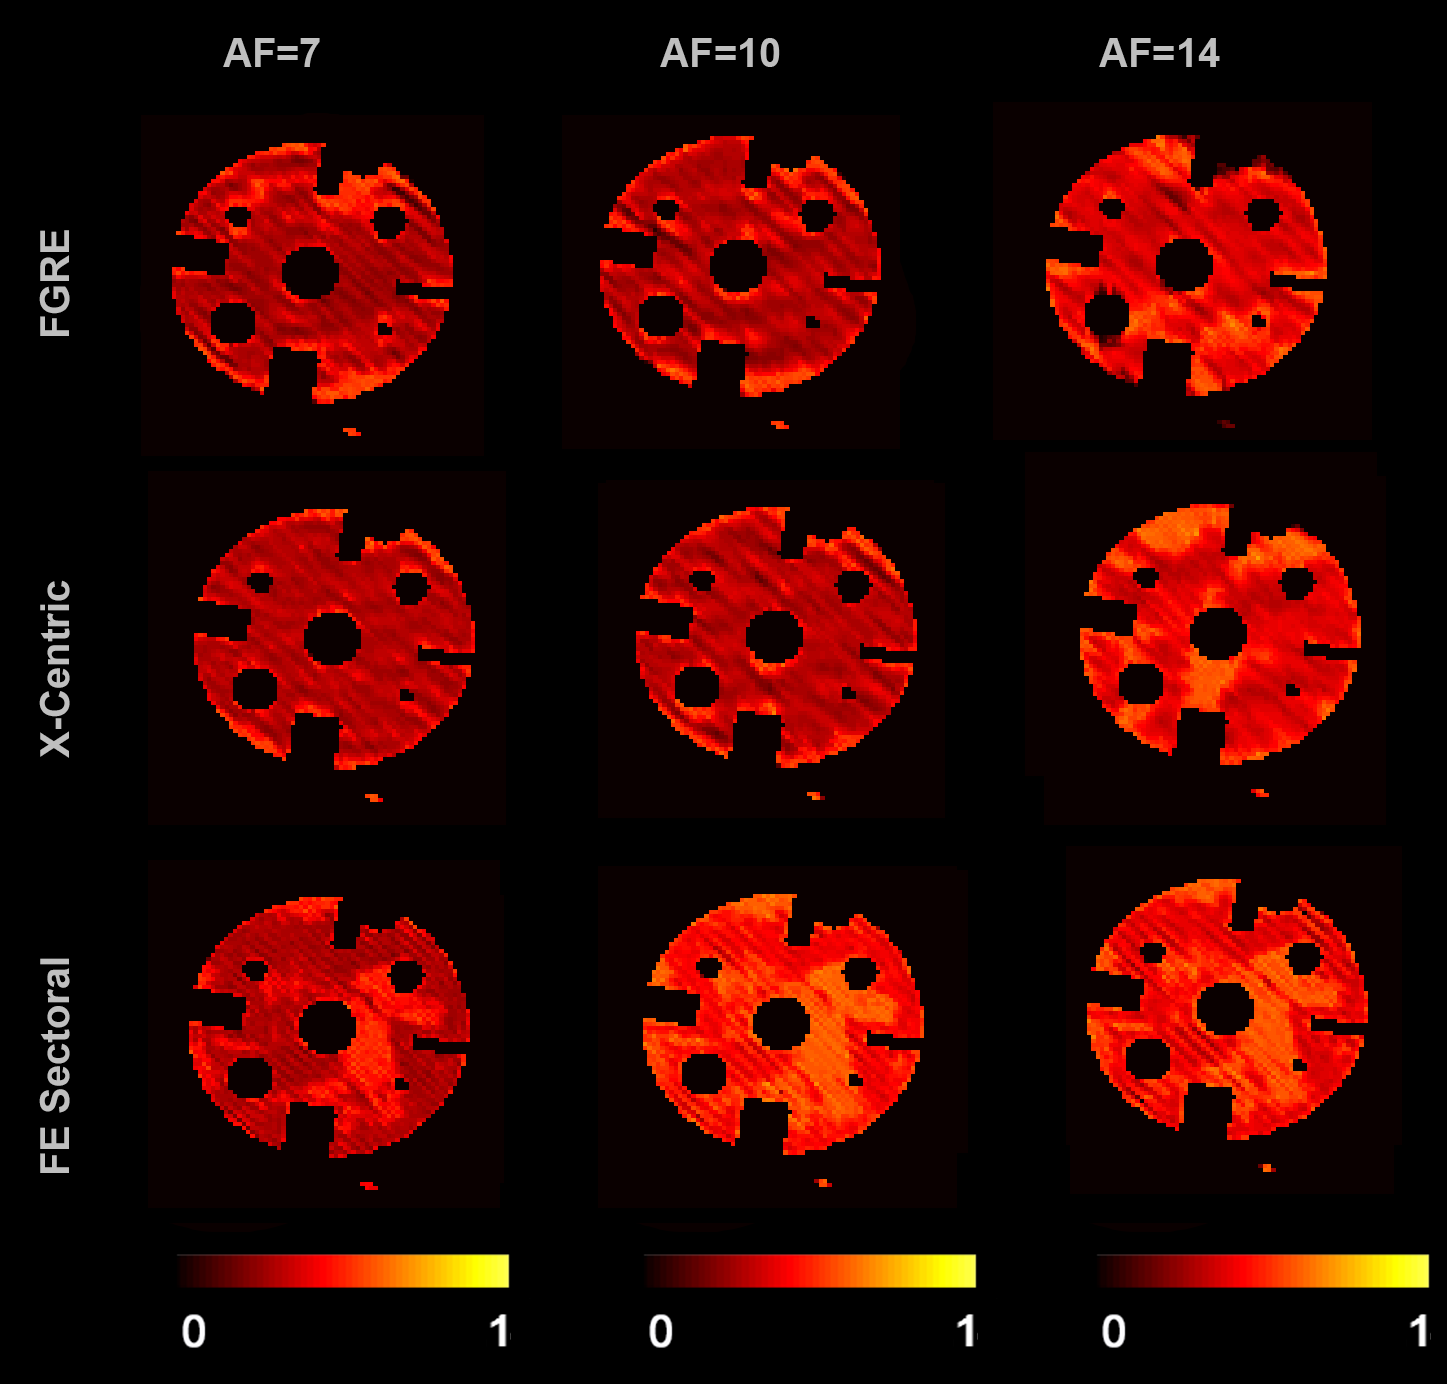
Figure 5. Representative pseudo fractional-ventilation maps obtained from the SEM-based reconstructed images for the three sampling schemes with AF of 7, 10 and 14.
- FGRE: r= 0.28 ± 0.08 with AF=7; r= 0.28 ± 0.07 with AF=10; r= 0.34 ± 0.08 with AF=14
- x-Centric: r= 0.28 ± 0.05 with AF=7; r= 0.29 ± 0.07 with AF=10; r= 0.37 ± 0.08 with AF=14
- FE Sectoral: r= 0.29 ± 0.07 with AF=7; r= 0.41 ± 0.06 with AF=10; r= 0.38 ± 0.07 with AF=14