0910
Investigations on accelerated imaging at 9.4T with electronically modulated time-varying receive sensitivities1High-field Magnetic Resonance Center, Max-Planck Institute for Biological Cybernetics, Tübingen, Germany, 2Department of Biomedical Magnetic Resonance, Eberhard Karls University Tübingen, Tübingen, Germany
Synopsis
In this work, it is assessed how electronically modulated time-varying receive sensitivities can improve parallel imaging reconstruction at 9.4T. The required sensitivity modulation is achieved by introducing variable capacitance diodes (varactors) in the receive loops that can be independently adjusted to modify B1- profiles. A prototype 4 channel receive array was built, and measured and simulated receive profiles were compared. Additionally, simulations were conducted regarding potential for g-factor improvement. It was found that potential improvements strongly depend on the B1- switching patterns during k-space acquisition, where strongest improvements are to be expected from fast B1- modulations.
Introduction
The performance of parallel imaging (PI) for MRI scan time acceleration is fundamentally limited by the receive coil sensitivity profiles. Applying time-varying B0 modulations during image encoding has been proposed to improve accelerated imaging, e.g. in wave-CAIPI1, FRONSAC2 or spread MRI3. Here we investigate whether modulations of the receive coil sensitivities (B1-) can be used for improving accelerated imaging. It has been shown that physically rotating receive arrays can improve PI performance4–8. For the present approach, instead of physical rotation, B1- is electronically modulated by introducing variable capacitance diodes in the receive circuitry, which can be controlled during image acquisition. The potential of this setup for improved acceleration performance is investigated here in simulations.Methods
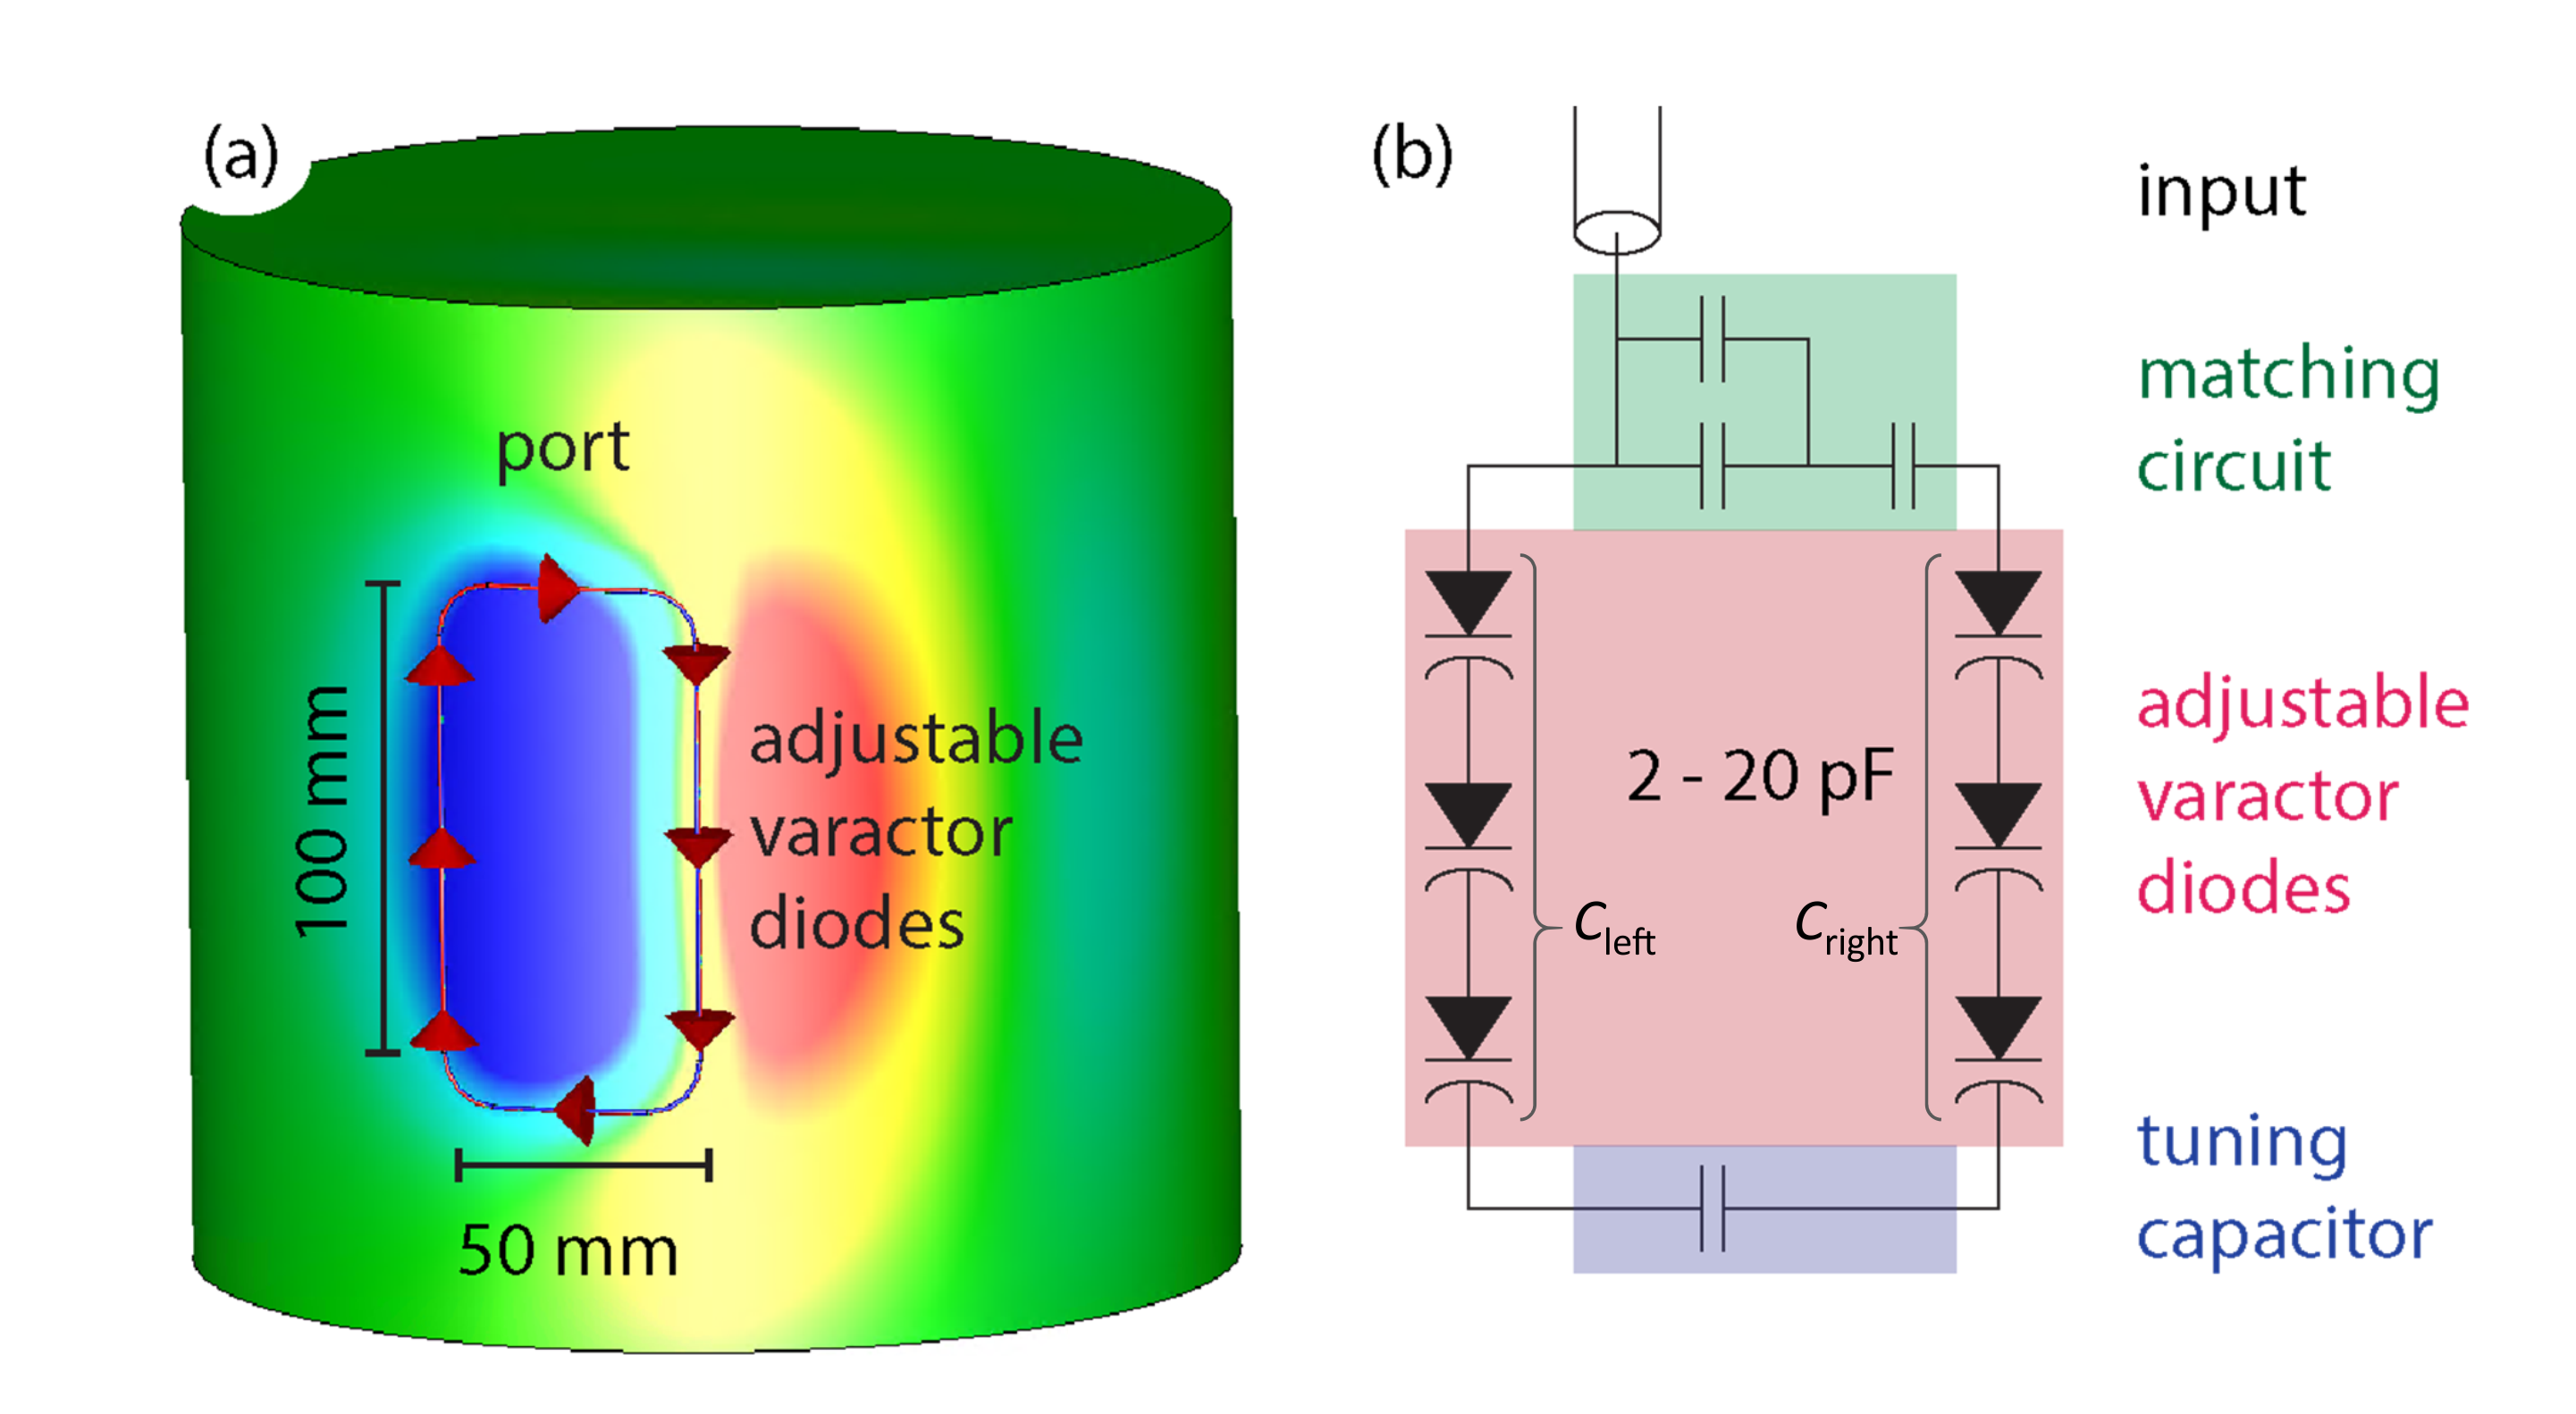
The prototype surface loop receive array consisted of four rectangular loops arranged symmetrically on a cylinder. A schematic of a single loop’s geometry and circuitry is shown in Figure 1. Each loop contains 6 adjustable varactor diodes (2-20 pF). With that, the capacitances on each side of the loop, Cleft and Cright, can be adjusted to alter B1- patterns but keep matching and tuning of the coil constant. Electromagnetic simulations of B1- for different values of Cleft and Cright were carried out using CST Studio Suite 2019 (CST, Darmstadt, Germany). A modified SENSE9 formulation was employed, with the encoding operator$$E_{(\gamma,\kappa),\rho} = S_\gamma(\boldsymbol{r}_\rho,\boldsymbol{k}_\kappa) \exp({\text{i} \boldsymbol{k}_\kappa \cdot \boldsymbol{r}_\rho})$$
with receive sensitivities $$$S_{\gamma}$$$ in the $$$\gamma$$$th channel at location $$$\boldsymbol{r}_\rho$$$. The sensitivities explicitly depend on k-space sampling location $$$\boldsymbol{k}_\kappa$$$ or, equivalently, on time. Linear reconstruction with this encoding operator can be calculated with the CG algorithm10. PI performance was assessed via the g-factor $$$g_\rho=\sqrt{(E^HE)^{-1}_{\rho,\rho} (E^HE)_{\rho,\rho}}$$$, which describes PI-related noise amplification in the voxel $$$\rho$$$9. Measurements were performed on a 9.4T human whole body MR scanner (Siemens Healthineers, Erlangen, Germany) using a 2D multi-slice GRE sequence in a cylindrical phantom having similar dielectric properties to a human head. Measured receive sensitivity was estimated by dividing individual coil images by the sum-of-squares coil-combined image.
Results
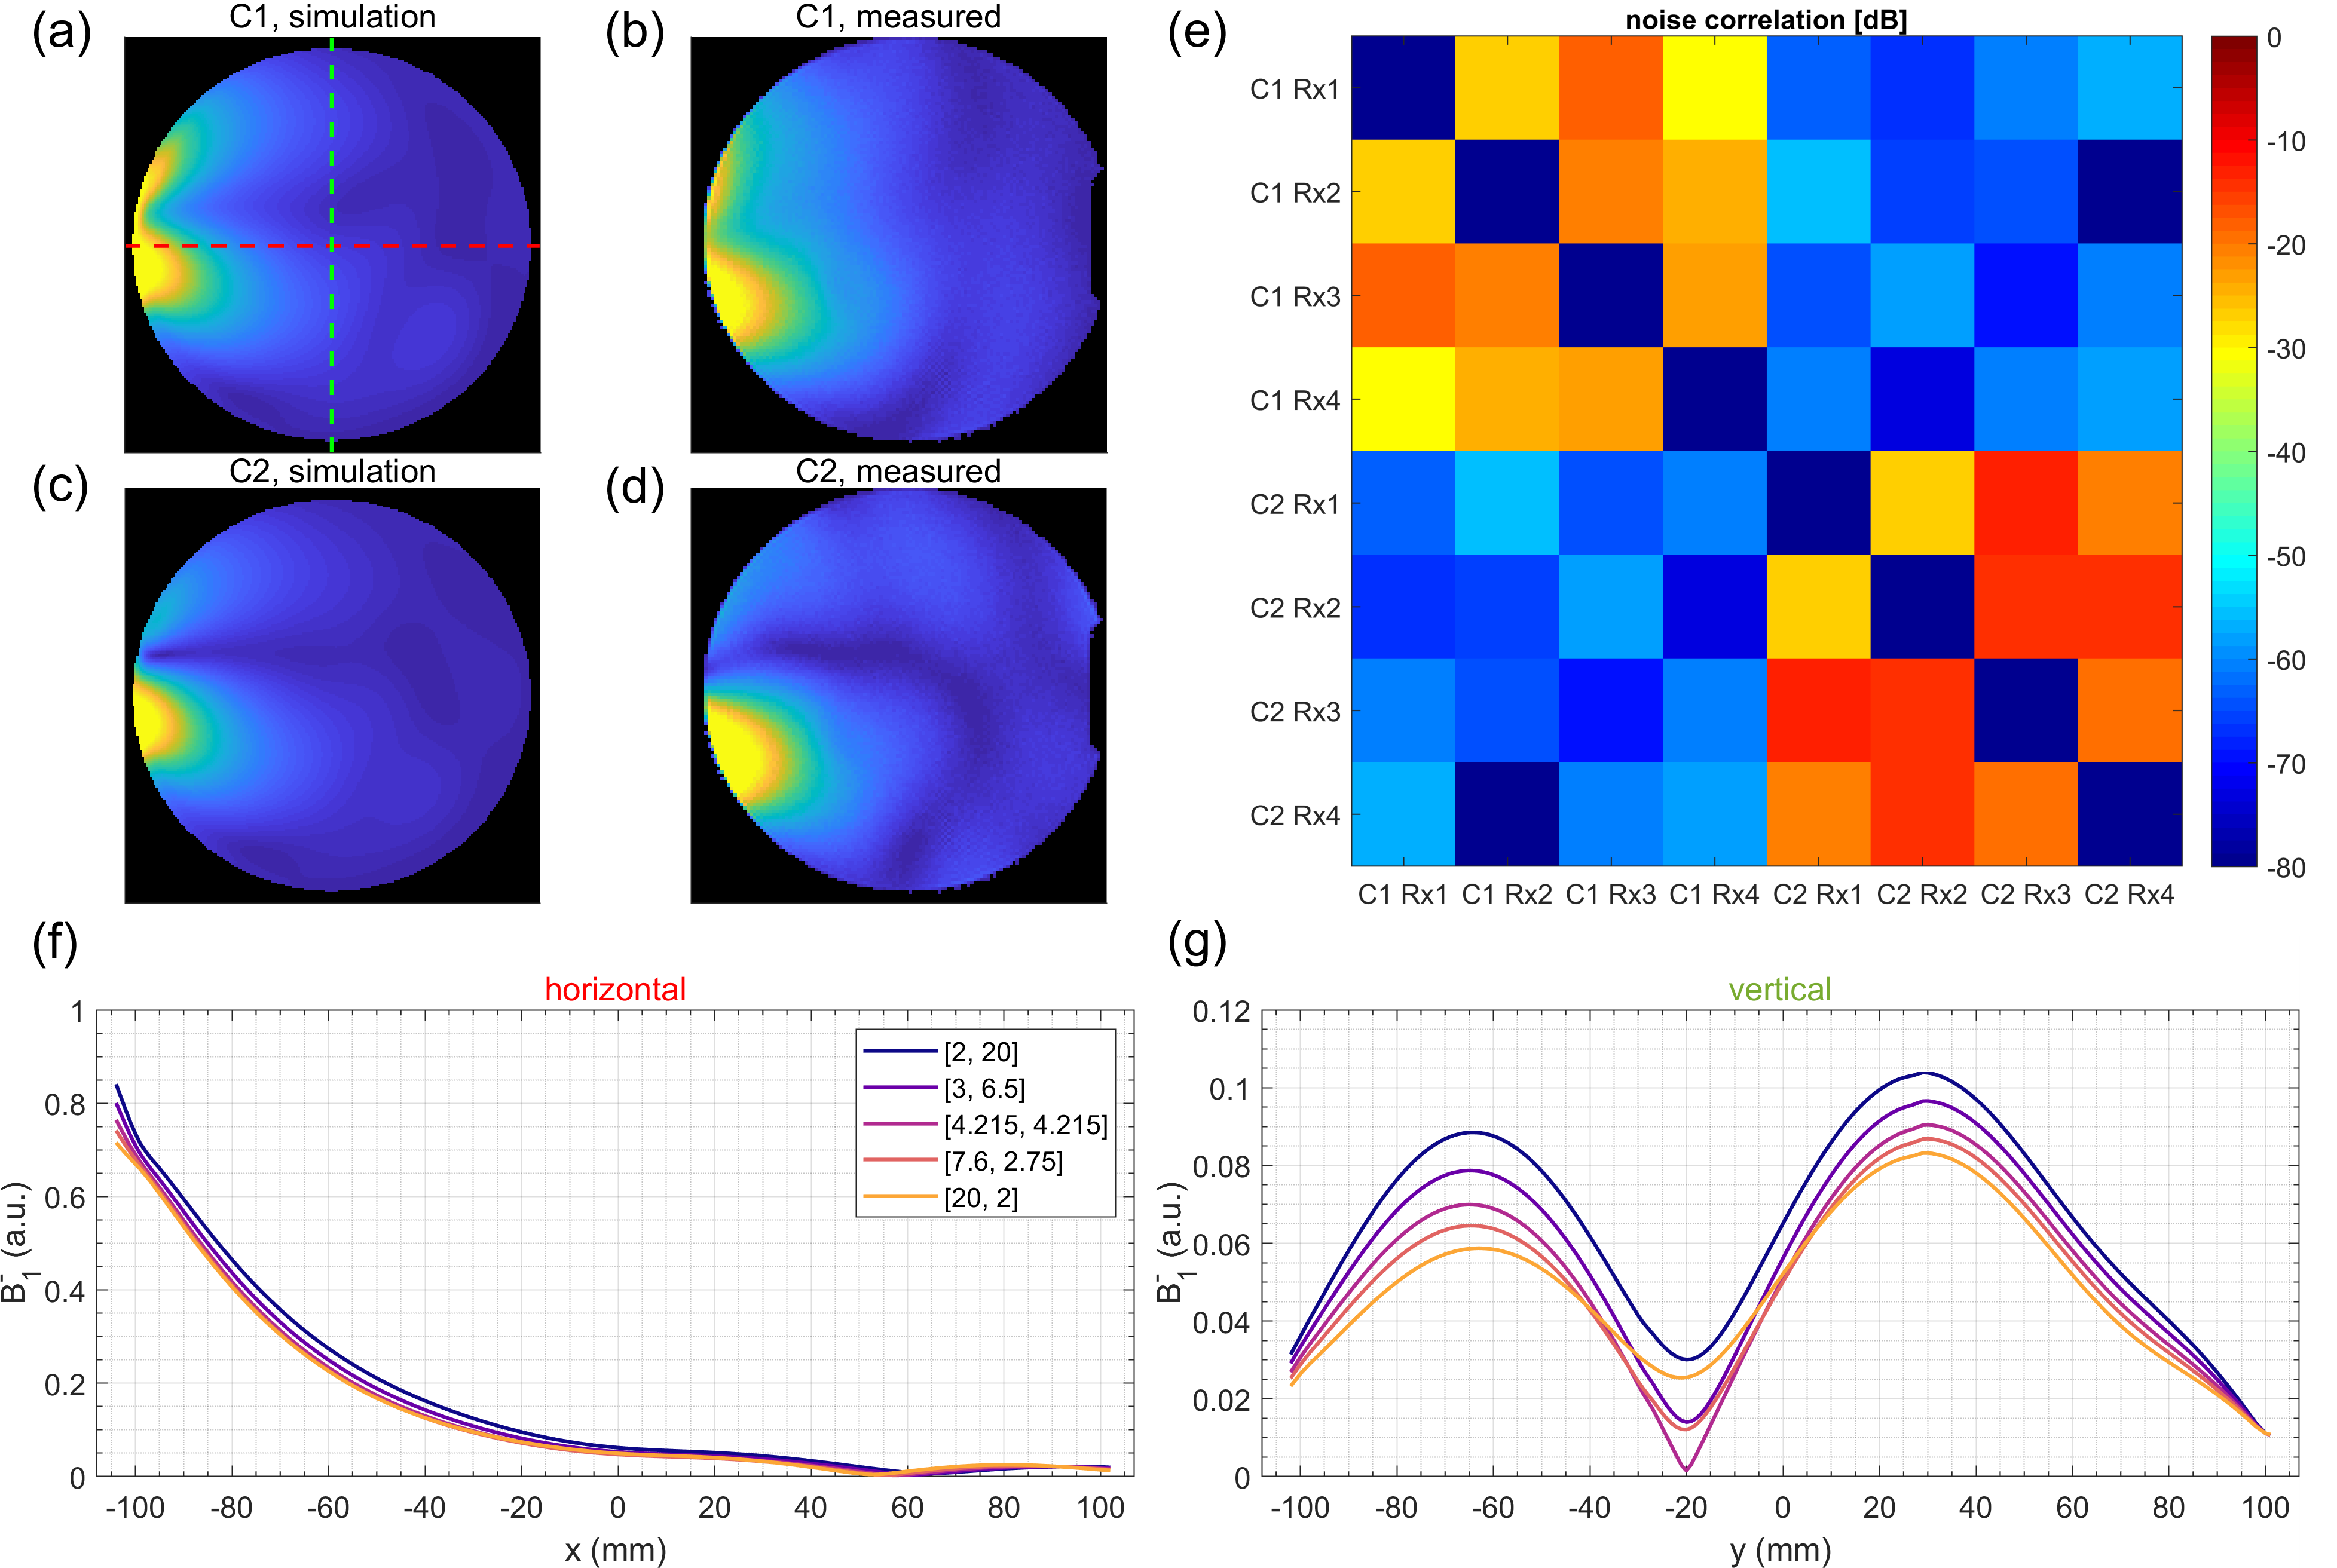
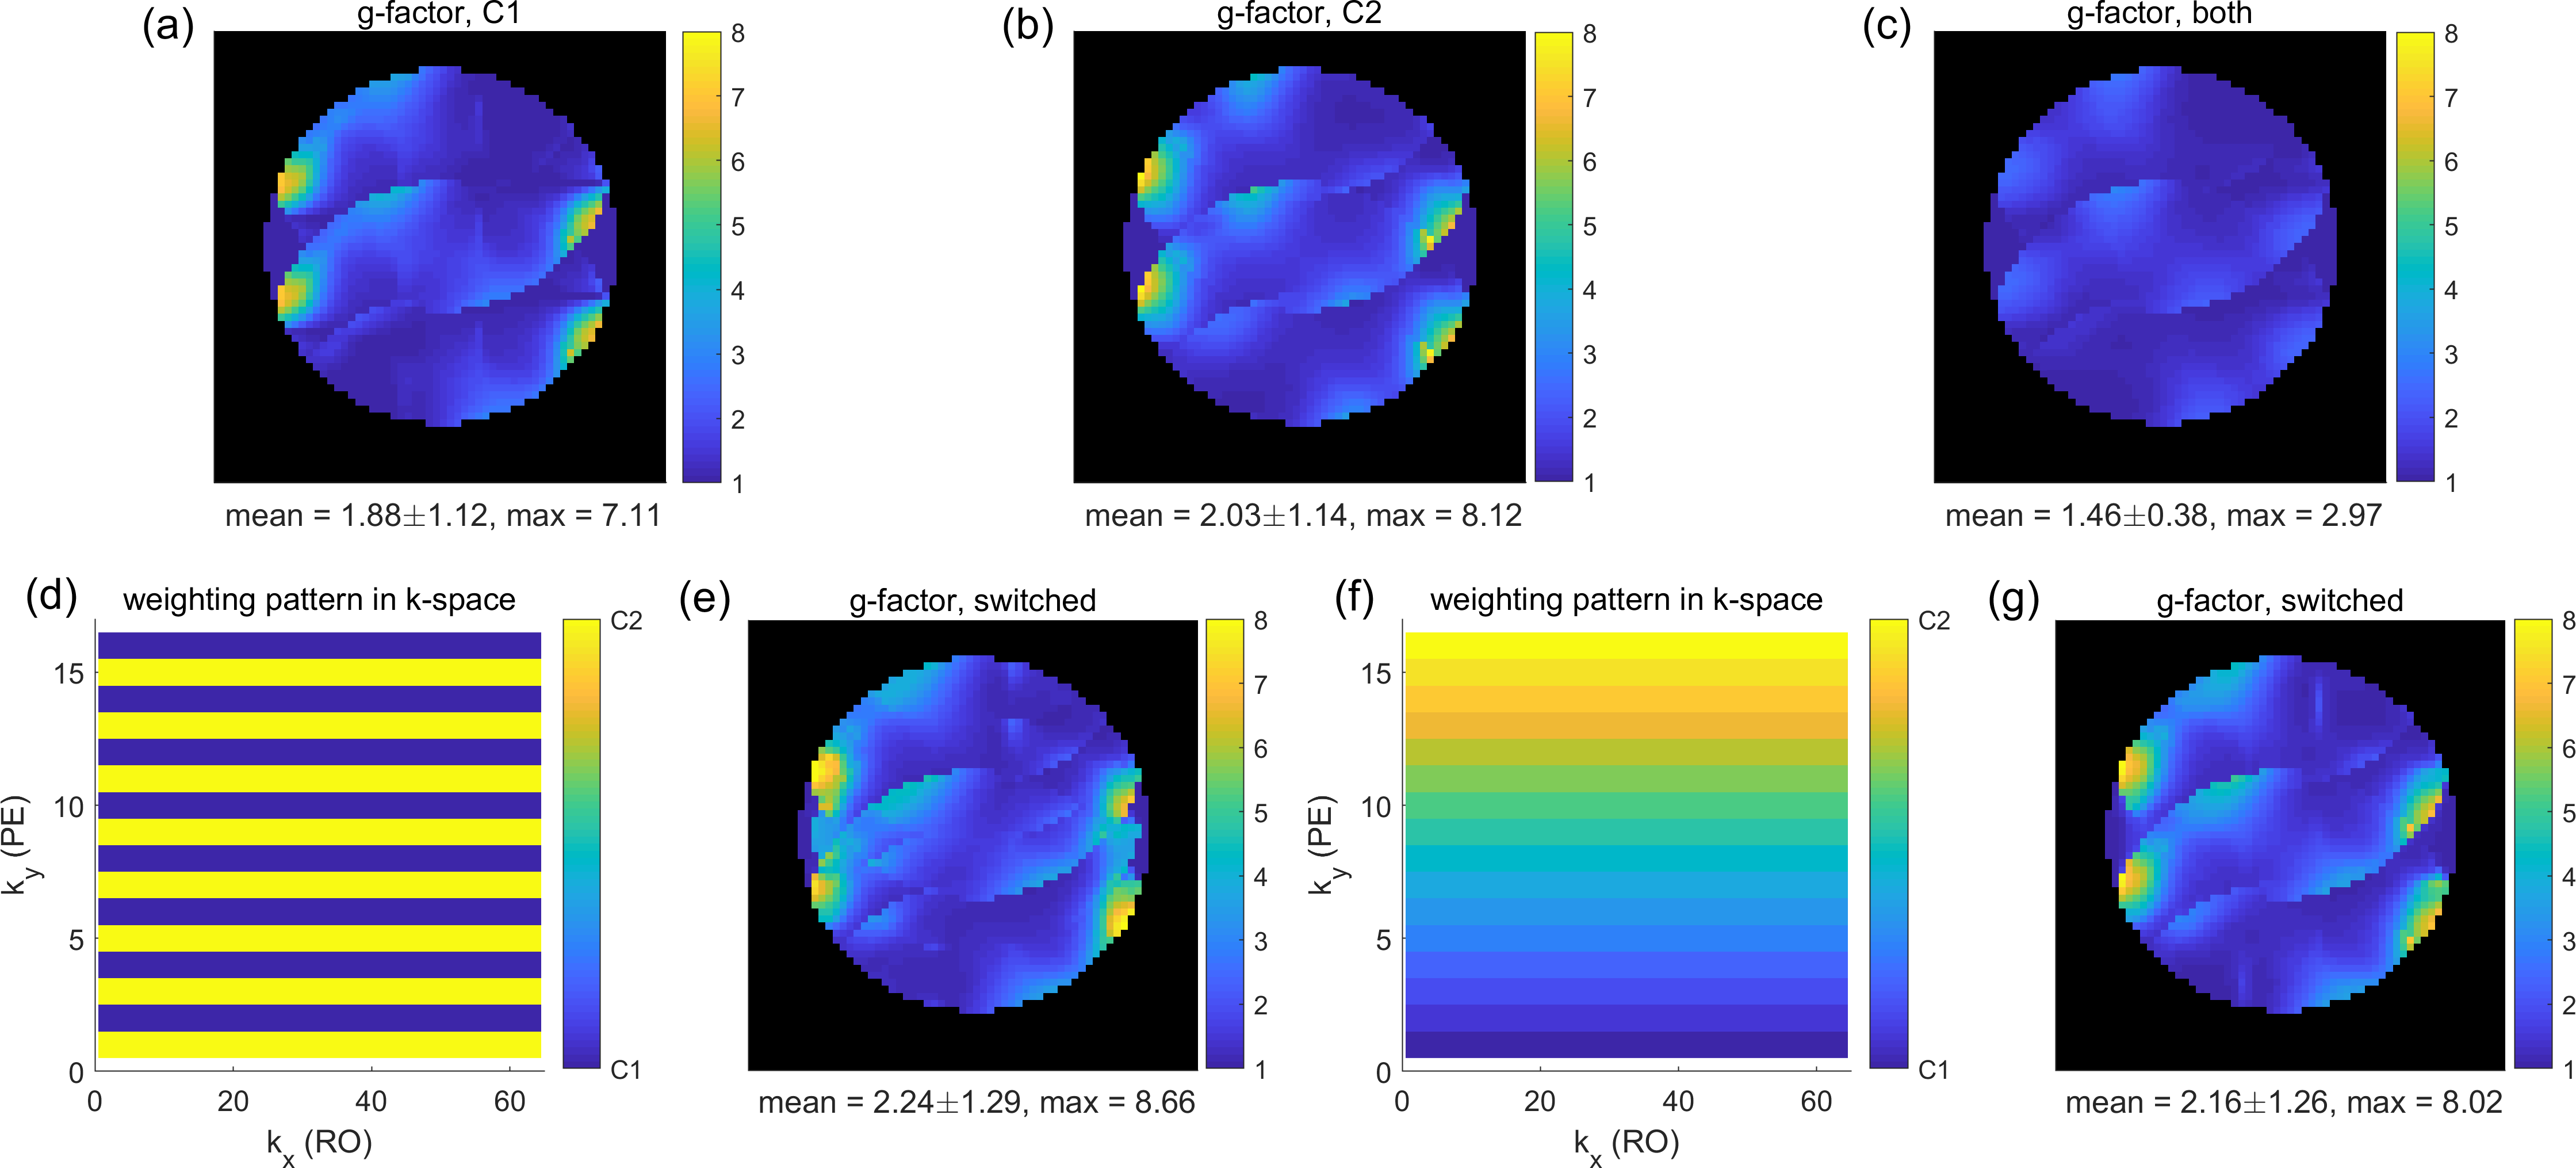
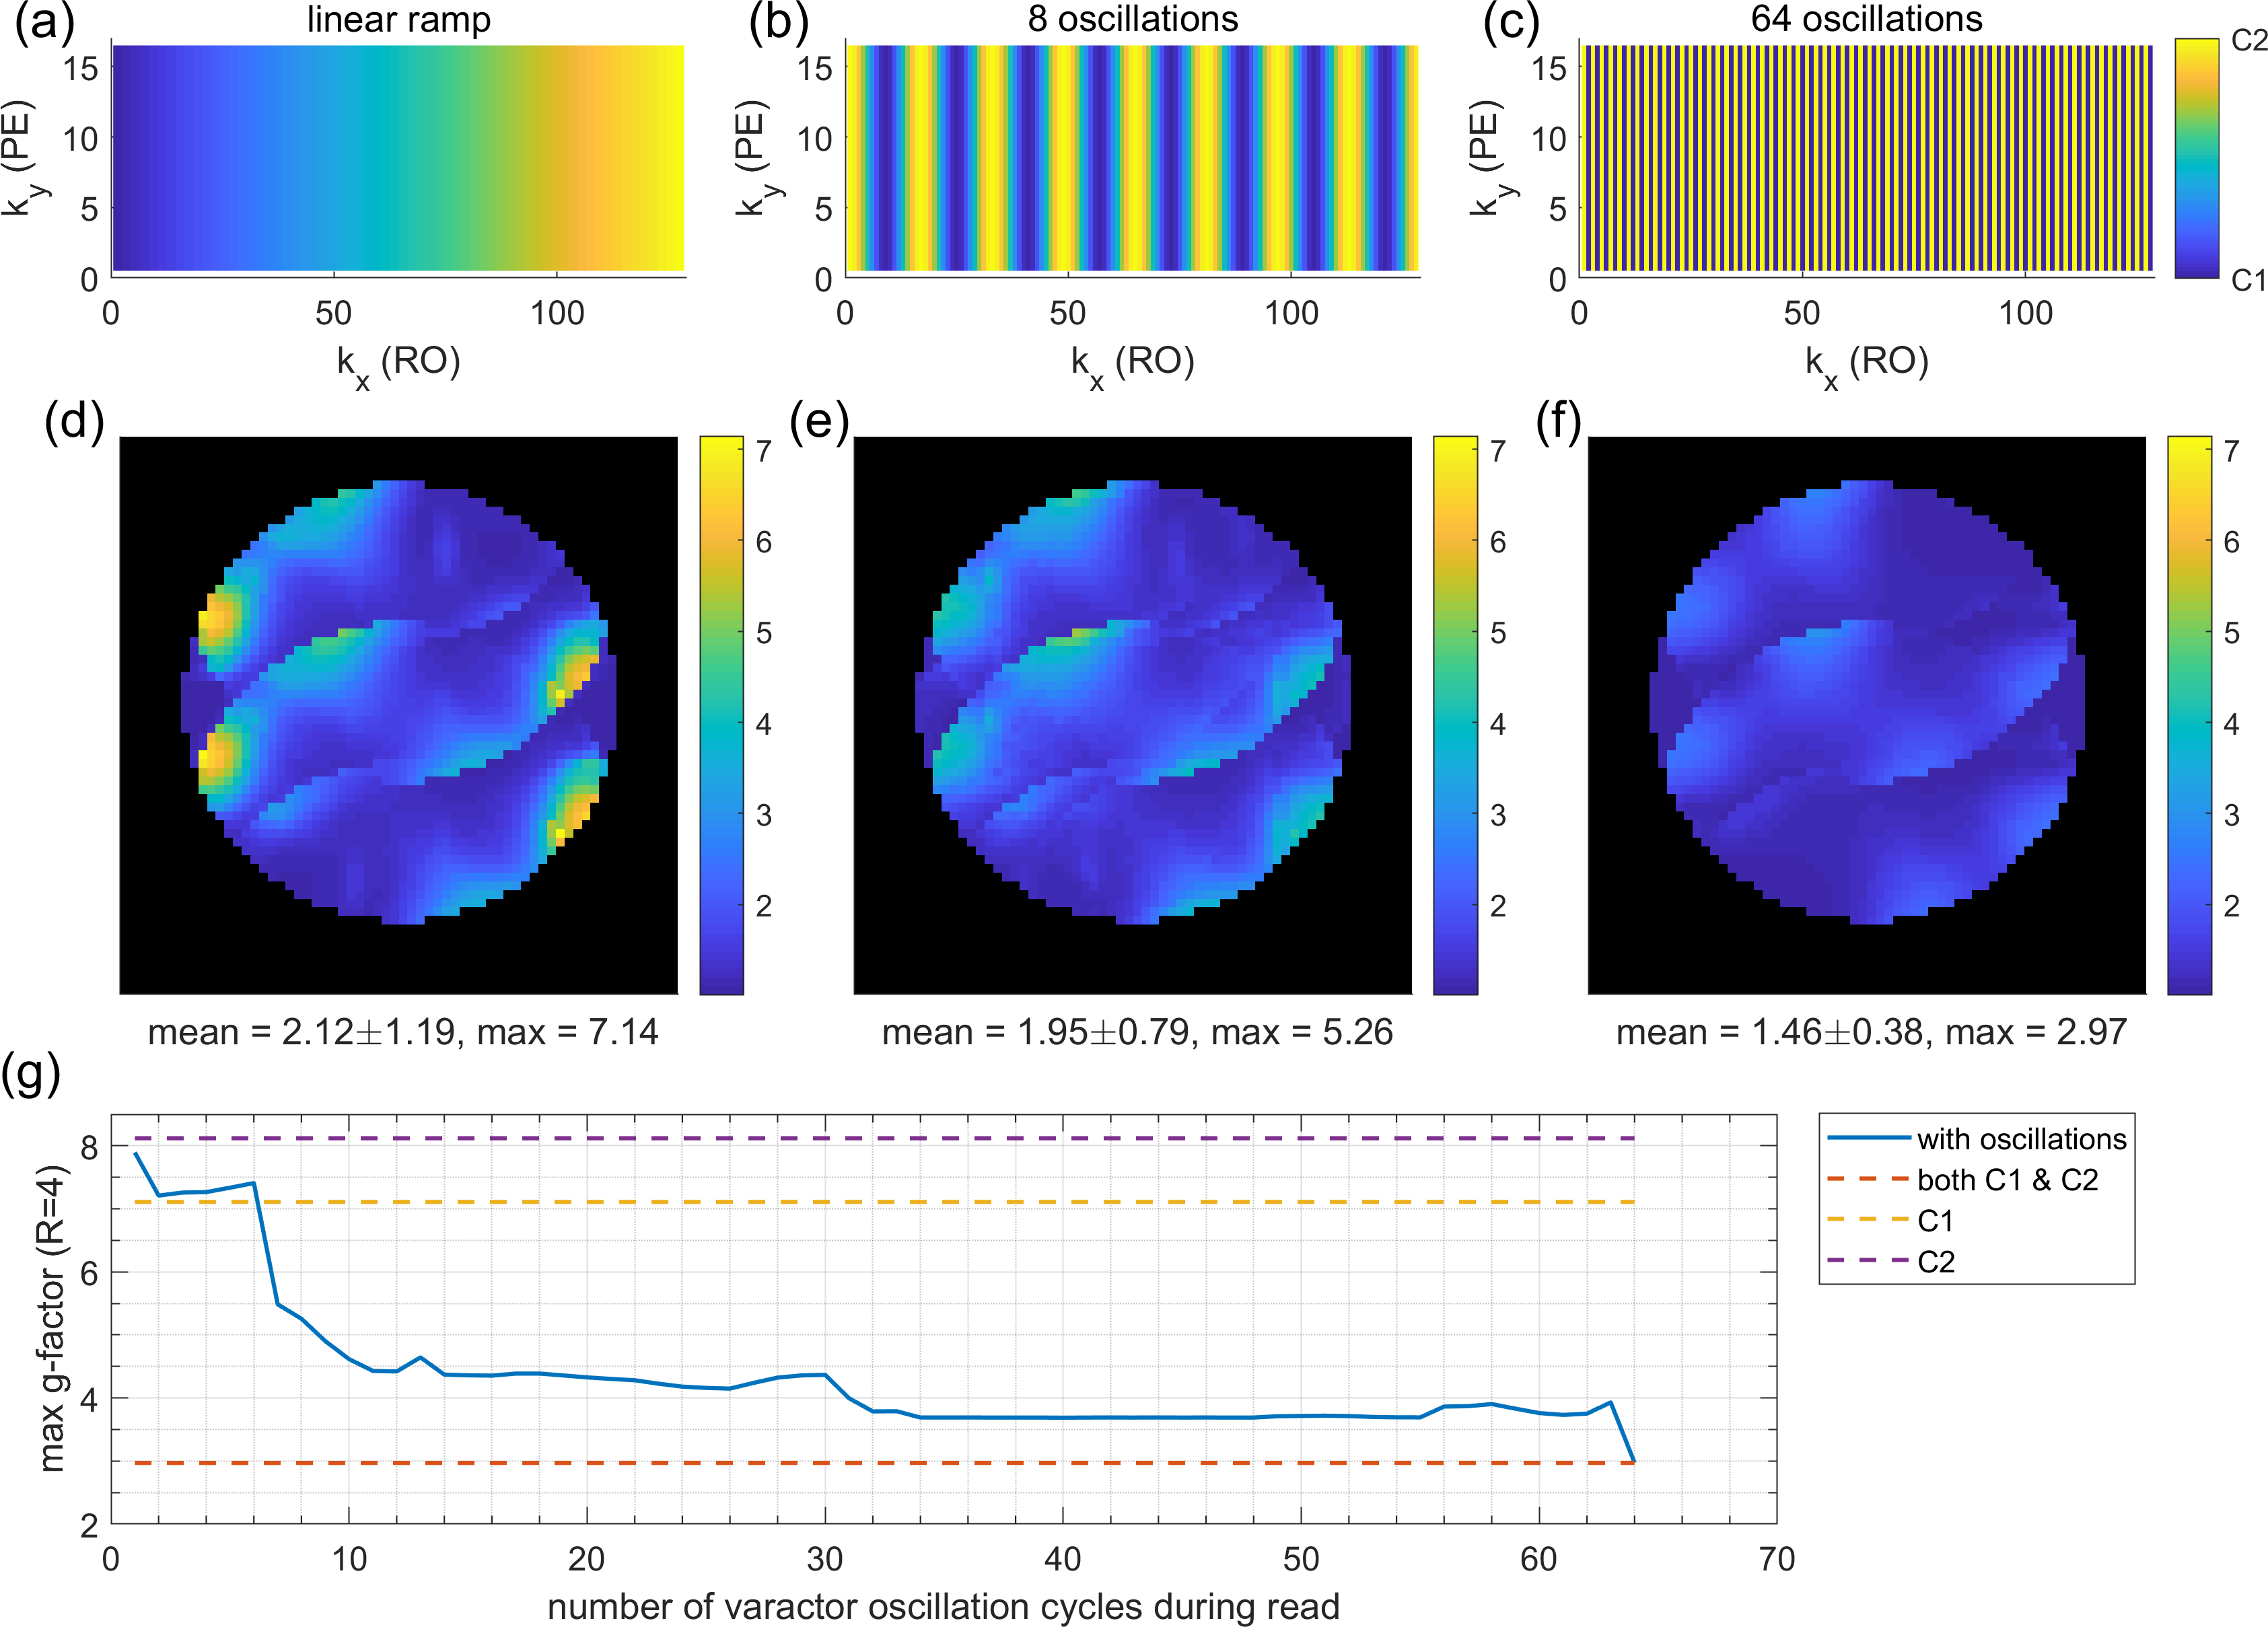
In Figure 2a-d, B1- simulations for varactor configurations C1 and C2 are compared with measured signal intensities in the phantom. The B1- modulations show similar patterns in simulation and measurement. Figure 2e depicts the receiver noise correlation matrix for two separate, retrospectively combined noise scans for each configuration. Noise between the configurations is almost uncorrelated, as they are never physically present at the same time. Simulated B1- line profiles for different varactor configurations (Figure 2f,g) show that adjusting the varactors creates only small modulations perpendicular to the loop (Figure 2a, red line). In contrast, parallel to the loop, stronger modulations can be observed (Figure 2a, green line). Figure 3a,b shows g-factor maps (R=4) for the simulated configurations C1 and C2. In Figure 3c, all receive profiles of both C1 and C2 were combined to form a hypothetical 8 channel array, which results in lower g-factors than for the individual configurations. Switching between C1 and C2 for every other phase encoding (PE) step (Figure 3d) yields higher g-factors than for the static configurations (Figure 3a,b). Similarly, gradually switching from C1 to C2 across PE steps (by appropriately adjusting Cleft and Cright, Figure 3f) yields no g-factor improvement (Figure 3g). In contrast, modulating sensitivities during readout (RO) of k-space lines can improve g-factors: In Figure 4, sinusoidal modulations oscillating between C1 and C2 at various frequencies were simulated, assuming 2-fold readout oversampling. While a single linear configuration sweep (Figure 4a) yields g-factors close to the static configurations (Figure 4d), increasing modulation frequencies results in decreasing g-factors (Figure 4g). In the limiting case of switching between C1 and C2 for each ADC sample (Figure 4c), g-factors are identical to the hypothetical case of all 8 sensitivities being statically active at the same time (Figure 3c).Discussion
For the employed receive profiles, no g-factor improvement was observed in simulations when switching varactor configurations between PE steps (Figure 3), i.e. at every TR. However, others showed that having distinct receive profiles for each PE step can improve g-factor by utilizing a rotating coil compared to a static coil array6. Presumably, for the present case, modulation of B1- (Figure 2f,g) is too weak to significantly improve the condition of the encoding operator. Modulating B1- fast during RO yields g-factor improvements (Figure 4), as this effectively acts as having all 8 receive profiles present at the same time in a time-domain-multiplexing manner4. However, in contrast to PE switching (TR in ms range), this requires the varactors to switch faster than the ADC dwell time (µs range), which needs further efforts for practical realization. The presented approach requires sensitivity calibration for all employed varactor configurations. Alternatively, a combination of measuring and numerically modelling the receive profiles could reduce the number of required calibrations.Conclusion
The receive coil array with adjustable varactor diodes offers an additional degree of freedom for image encoding by enabling time-varying receive sensitivities. This can potentially improve PI performance, i.e. lower g-factors compared to static sensitivities. However, such improvements depend crucially on how configurations are switched during k-space acquisition and on spatial independence of the different receive profiles. Future work will thus focus on achieving stronger B1- modulation.Acknowledgements
Financial support of the Max-Planck Society and ERC Advanced Grant "SpreadMRI", No 834940 is gratefully acknowledged.References
1. Bilgic B, Gagoski BA, Cauley SF, et al. Wave-CAIPI for highly accelerated 3D imaging. Magnetic Resonance in Medicine 2015;73:2152–2162.
2. Wang H, Tam LK, Constable RT, Galiana G. Fast rotary nonlinear spatial acquisition (FRONSAC) imaging. Magnetic Resonance in Medicine 2016;75:1154–1165.
3. Scheffler K, Loktyushin A, Bause J, Aghaeifar A, Steffen T, Schölkopf B. Spread-spectrum magnetic resonance imaging. Magnetic Resonance in Medicine 2019;82:877–885.
4. Trakic A, Wang H, Weber E, et al. Image reconstructions with the rotating RF coil. Journal of Magnetic Resonance 2009;201:186–198.
5. Trakic A, Li BK, Weber E, Wang H, Wilson S, Crozier S. A rapidly rotating RF coil for MRI. Concepts in Magnetic Resonance Part B: Magnetic Resonance Engineering 2009;35B:59–66.
6. Li M, Zuo Z, Jin J, et al. Highly accelerated acquisition and homogeneous image reconstruction with rotating RF coil array at 7T—A phantom based study. Journal of Magnetic Resonance 2014;240:102–112.
7. Li M, Jin J, Zuo Z, et al. In vivo sensitivity estimation and imaging acceleration with rotating RF coil arrays at 7 Tesla. Journal of Magnetic Resonance 2015;252:29–40.
8. Li M, Weber E, Jin J, et al. Radial magnetic resonance imaging (MRI) using a rotating radiofrequency (RF) coil at 9.4 T. NMR in Biomedicine 2018;31:e3860.
9. Pruessmann KP, Weiger M, Scheidegger MB, Boesiger P. SENSE: Sensitivity encoding for fast MRI. Magnetic Resonance in Medicine 1999;42:952–962.
10. Pruessmann KP, Weiger M, Börnert P, Boesiger P. Advances in sensitivity encoding with arbitrary k-space trajectories. Magnetic Resonance in Medicine 2001;46:638–651.
11. Uecker M, Lai P, Murphy MJ, et al. ESPIRiT—an eigenvalue approach to autocalibrating parallel MRI: Where SENSE meets GRAPPA. Magnetic Resonance in Medicine 2014;71:990–1001.
Figures