0907
Arterial calcification imaging using ZTE on PET/MR1Department of Nuclear Medicine, University Hospital Zurich, Zurich, Switzerland, 2GE Healthcare, Munich, Germany, 3GE Healthcare, Milwaukee, WI, United States, 4GE Healthcare, Stockholm, Sweden, 5GE Healthcare, Little Chalfont, Amersham, United Kingdom
Synopsis
Calcifications in atherosclerotic plaques are possibly associated with worsened clinical prognosis. In contrast to the often-used CT for diagnosis, calcifications cannot easily be detected with MRI. As PET becomes a major complementary modality for MRI in plaque imaging, and as integrated PET/MR scanners become increasingly available, PET/MR based calcification screening methods are desired. With zero TE (ZTE) MR imaging it is possible to image short T2 tissues like bone. In the current study we demonstrate that ZTE imaging on PET/MR, combined with Deep Learning reconstructed ZTE, can likely be applied to detect calcifications in peripheral vasculature.
Introduction
Atherosclerosis is a slow but complex progressive disease. It can start with small injuries to the inner layer of an artery where, over time, cells, cholesterol and other substances build up and form an atherosclerotic plaque. This can eventually result in vascular wall thickening and narrowing of the lumen, thereby reducing the blood flow. Moreover, unstable plaques can rupture and cause blood clots, which can block the blood flow in small arteries in other parts of the body. In addition, plaques could interfere with the calcium deposition regulation. This way, calcium could locally accumulate and crystalize, thereby changing the mechanical properties of the plaque.Traditional diagnostic methods like angiography, focus solely on the identification of luminal narrowing. Recent methods performed with e.g. ultrasound, CT or MRI, focus more on anatomical and morphological features.1 Currently, PET has become a major complementary modality for MRI in plaque imaging as new ‘plaque’ tracers like CXCR4 are continuously being developed.2-4 Moreover, integrated PET/MR scanners are increasingly available and allow for simultaneously acquisition of MR and PET data.
Calcifications are possibly associated with worsened clinical prognosis and could have an impact on treatment. Unlike CT, calcifications cannot easily be detected with MRI. Some attempts have been made in the past, where signal void MR areas were classified as locations with calcifications.5 With zero TE (ZTE) MR imaging, however, it is possible to image short T2 tissues like bone.6
In the current study, we investigated the feasibility to detect calcifications in arteries using ZTE on PET/MR.
Methods
Patients included in this retrospective study had a head and neck or a pelvic ZTE scan performed on a GE Signa PET/MR scanner (GE Healthcare, Chicago, IL) together with other clinical relevant scans like T1-, T2-weighted and contrast enhanced LAVA-Flex based MRI. Moreover, a prior obtained CT scan in the corresponding region was required for reference. All patients signed the informed consent.The pelvic ZTE scans had the following scan parameters: FOV: 300x300x300mm3, res: 1.2x1.2x1.2mm3, FA: 1deg, BW: ±62.5kHz, time: 3min. The head and neck ZTE had: FOV: 192x192x192mm3, res: 0.8x0.8x0.8mm3, FA: 1deg, BW: ±62.5kHz, time: 6min. The resulting ZTE images are proton density-weighted and had the center frequency shifted by -200Hz to reduce chemical shift artifacts at the boundary between fat and water tissues. This way, mainly air, bone and calcifications appear darker on the ZTE images.
All ZTE images in this study were now reconstructed using a Deep Learning-based method (ZTE DL) similar to Lebel et al.7 The ZTE DL images were compared to the CT images. Segmented ZTE DL and contrast enhanced MR images were used for visualizations.
Results
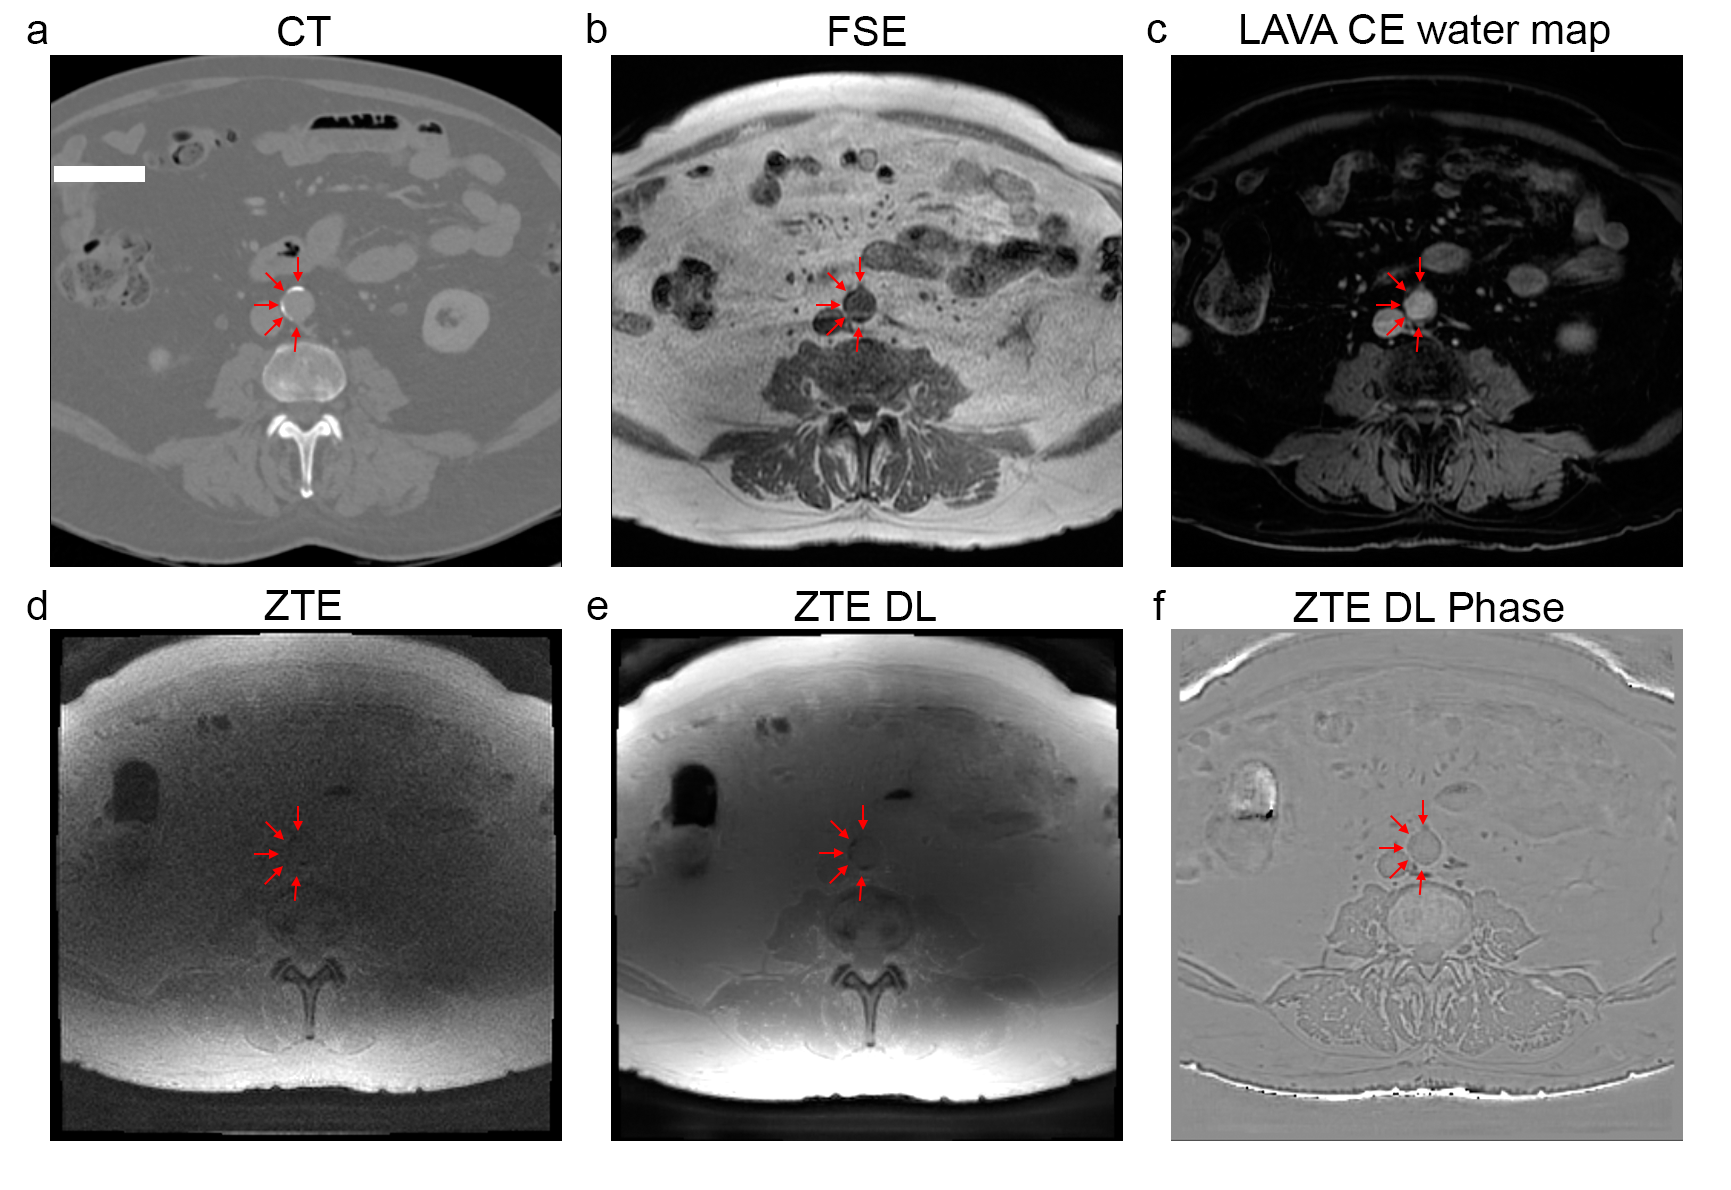
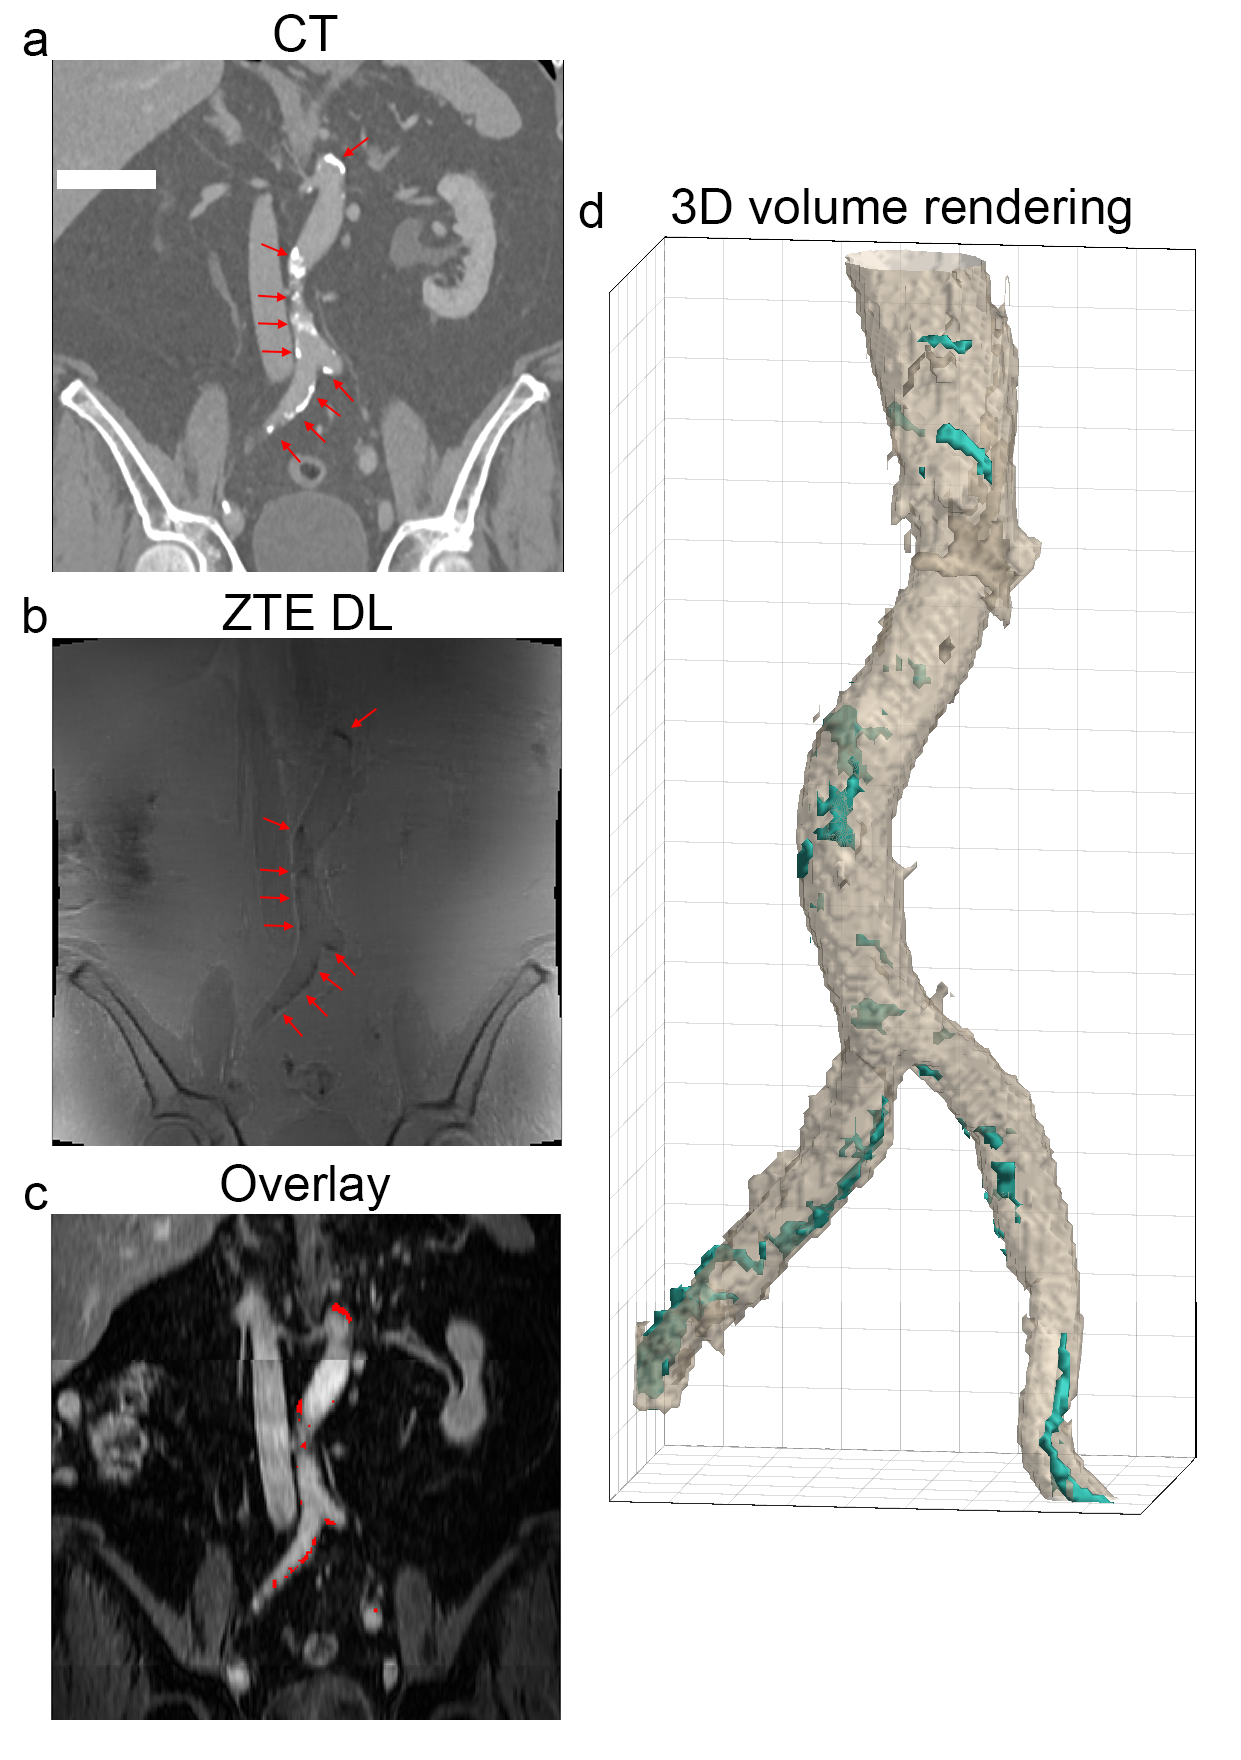
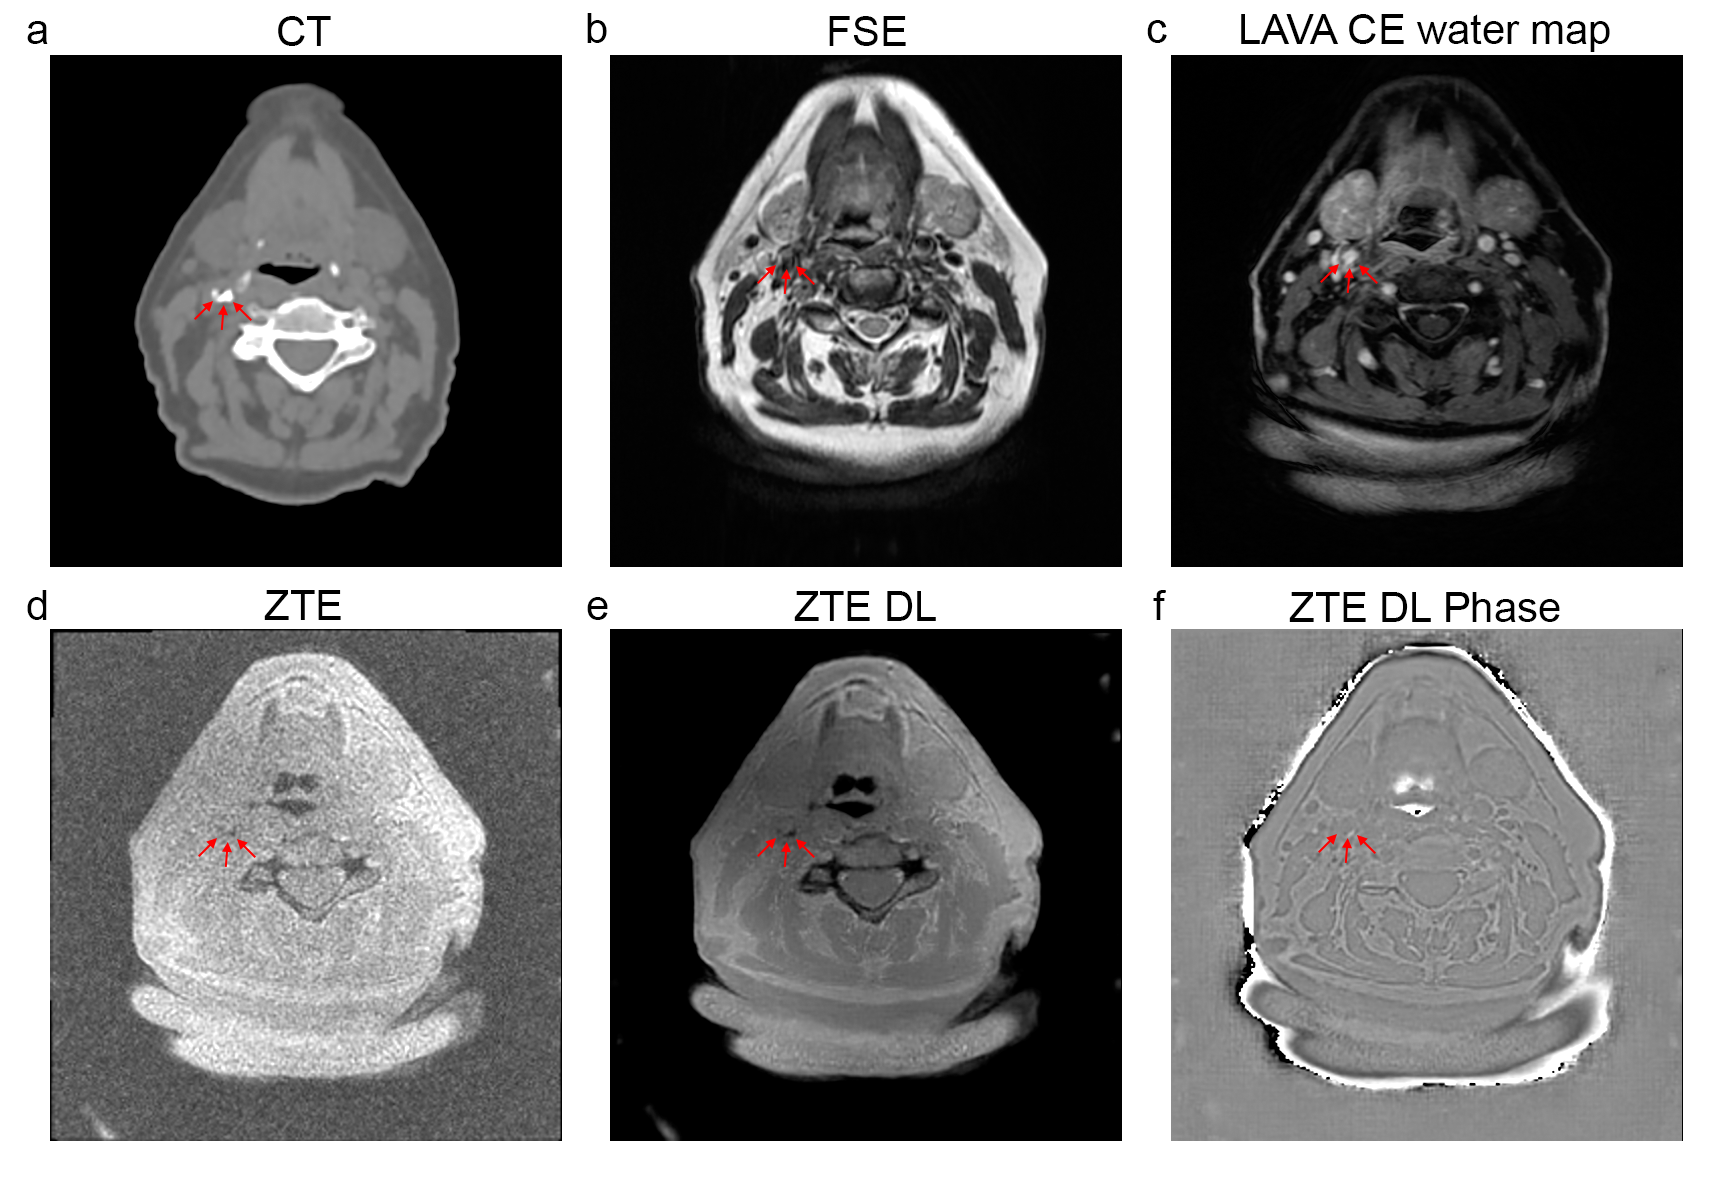
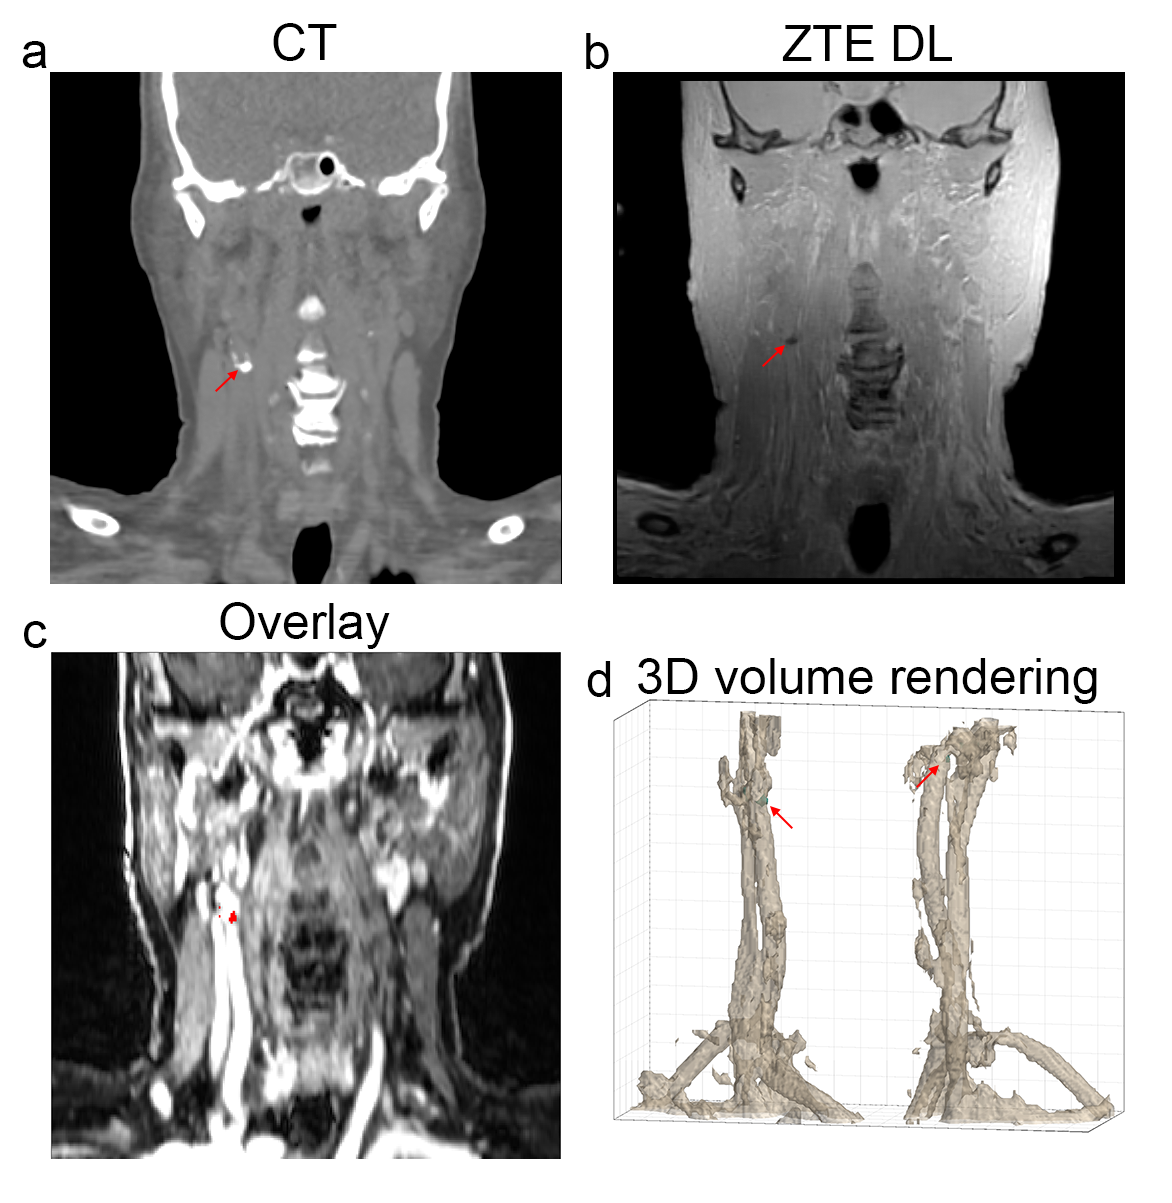
The axial and coronal images in figure 1 and 2 show example results of a 78 y/o male patient with calcifications in the abdominal aorta near the bifurcation. The CT images in figure 1a and 2a clearly show the calcifications, as indicated by the red arrows. The fast spin echo sequence in figure 1b shows reduced signal intensity spots in the same location. This could be due to the reduced amount of protons in the calcified regions. The contrast enhanced MRI in figure 1c clearly shows the location of the vessels. The lumen of the artery seems to be slightly smaller near these calcification locations. The Deep Learning reconstructed ZTE, shown in figure 1e, recovers a sharp image behind an otherwise unacceptable noise floor apparent in the standard reconstructed ZTE, shown in figure 1d, and clearly depicts the calcified areas located near the circumference of the artery (red arrows). Figure 1f shows the ZTE phase image. The calcifications (red arrows) shown on the coronal CT images, shown in figure 2a, very nicely match the calcifications (red arrows) on the ZTE, shown in figure 2b. Figure 2c shows the calcification areas, as found on ZTE DL, overlaid on the contrast enhanced MRI. It can clearly be appreciated that the calcifications surround the artery’s vessel wall. Figure 2d shows a 3D volume rendering of the artery and the calcifications (in cyan) as found with ZTE DL.The axial and coronal images in figure 3 and 4 show example results of a 77 y/o female patient with calcifications in the head and neck area, near the carotid artery bifurcation. Although these calcifications are somewhat smaller than the calcifications shown in the abdominal region in the previous example, they still can be appreciated. The calcifications found on ZTE DL match the calcifications on CT and are also located near the boundary of the artery.
Discussion and conclusion
In this feasibility study, we demonstrate that ZTE imaging on PET/MR, combined with Deep Learning reconstructed ZTE, can likely be applied to detect calcifications in peripheral vasculature. The location of the calcifications as indicated by ZTE DL matches the calcifications seen on CT. In a future study the ZTE signal could be combined with multi-parametric MR (T1/T2/MRA) and possibly new PET tracers targeting ‘plaque’ to develop a calcification screening method.Acknowledgements
No acknowledgement found.References
1. Tawakol A, Sosnovik DE. PET/MR Imaging of Atherosclerosis: Insights Into Atheroma Structure and Biology. JACC Cardiovasc Imaging. 2018;11(2 Pt 2):302-4.
2. Li X, Yu W, Wollenweber T, Lu X, Wei Y, Beitzke D, et al. [(68)Ga]Pentixafor PET/MR imaging of chemokine receptor 4 expression in the human carotid artery. Eur J Nucl Med Mol Imaging. 2019;46(8):1616-25.
3. Rischpler C, Woodard PK. PET/MR Imaging in Cardiovascular Imaging. PET Clin. 2019;14(2):233-44.
4. Ludvigsen TP, Pedersen SF, Vegge A, Ripa RS, Johannesen HH, Hansen AE, et al. (18)F-FDG PET/MR-imaging in a Göttingen Minipig model of atherosclerosis: Correlations with histology and quantitative gene expression. Atherosclerosis. 2019;285:55-63.
5. Edelman RR, Flanagan O, Grodzki D, Giri S, Gupta N, Koktzoglou I. Projection MR imaging of peripheral arterial calcifications. Magn Reson Med. 2015;73(5):1939-45.
6. Wiesinger F, Sacolick LI, Menini A, Kaushik SS, Ahn S, Veit-Haibach P, et al. Zero TE MR bone imaging in the head. Magn Reson Med. 2016;75(1):107-14.
7. Lebel RM. Performance characterization of a novel deep learning-based MR image reconstruction pipeline. ArXiv. 2020;abs/2008.06559.
Figures