0905
2.5D MRI of the Vocal Fold Oscillation using Single Point Imaging with Rapid Encoding1Dept.of Radiology, Medical Physics, Medical Center University of Freiburg, Faculty of Medicine, University of Freiburg, Freiburg, Germany, 2German Consortium for Translational Cancer Research Freiburg Site, German Cancer Research Center (DKFZ), Heidelberg, Germany, 3Division of Phoniatrics and Pediatric Audiology, Department of Otorhinolaryngology, Head and Neck Surgery, Ludwig-Maximilians-University, Munich, Germany, 4Institute of Musicians' Medicine, Freiburg University Medical Center, Germany Faculty of Medicine, University of Freiburg, Freiburg, Germany
Synopsis
Single point imaging with rapid encoding (SPIRE) can dynamically image the oscillations of the vocal folds in the coronal plane with sub-milisecond temporal resolution. To add spatial encoding in the third dimension, a slower frequency encoding gradient was applied in slice direction, where motion is minimal. Electroglottography and projection navigators are used to detect shifts in the larynx position, which are corrected during reconstruction. The velocity of the mucosal wave is estimated from the images.
Introduction
Fast oscillatory motion can be imaged with rapidly switched phase encoding gradients, which has been shown in the vocal folds for one- and two-dimensional motion1,2. The free choice of the imaging plane makes MRI the ideal tool to image the motion in the coronal plane, which is not possible with established clinical imaging methods such as laryngeal stroboscopy, where only a transverse view from the top is available. During phonation, the closed vocal folds are pushed along head-feet (IS) direction by air pressure created in the lungs, and they move along the left-right (LR) direction, once they are separated by the pressure. In healthy subjects, the motion along anterior-posterior (AP) direction is small – thus, conventional frequency encoding can be used to encode this direction, whereas short SPIRE phase encoding gradients are needed for the rapid IS and LR motion. In this work we present an extended 2.5D SPIRE technique with which we measure the velocity of the mucosal wave3 in two locations of the vocal folds simultaneously.Methods and Materials
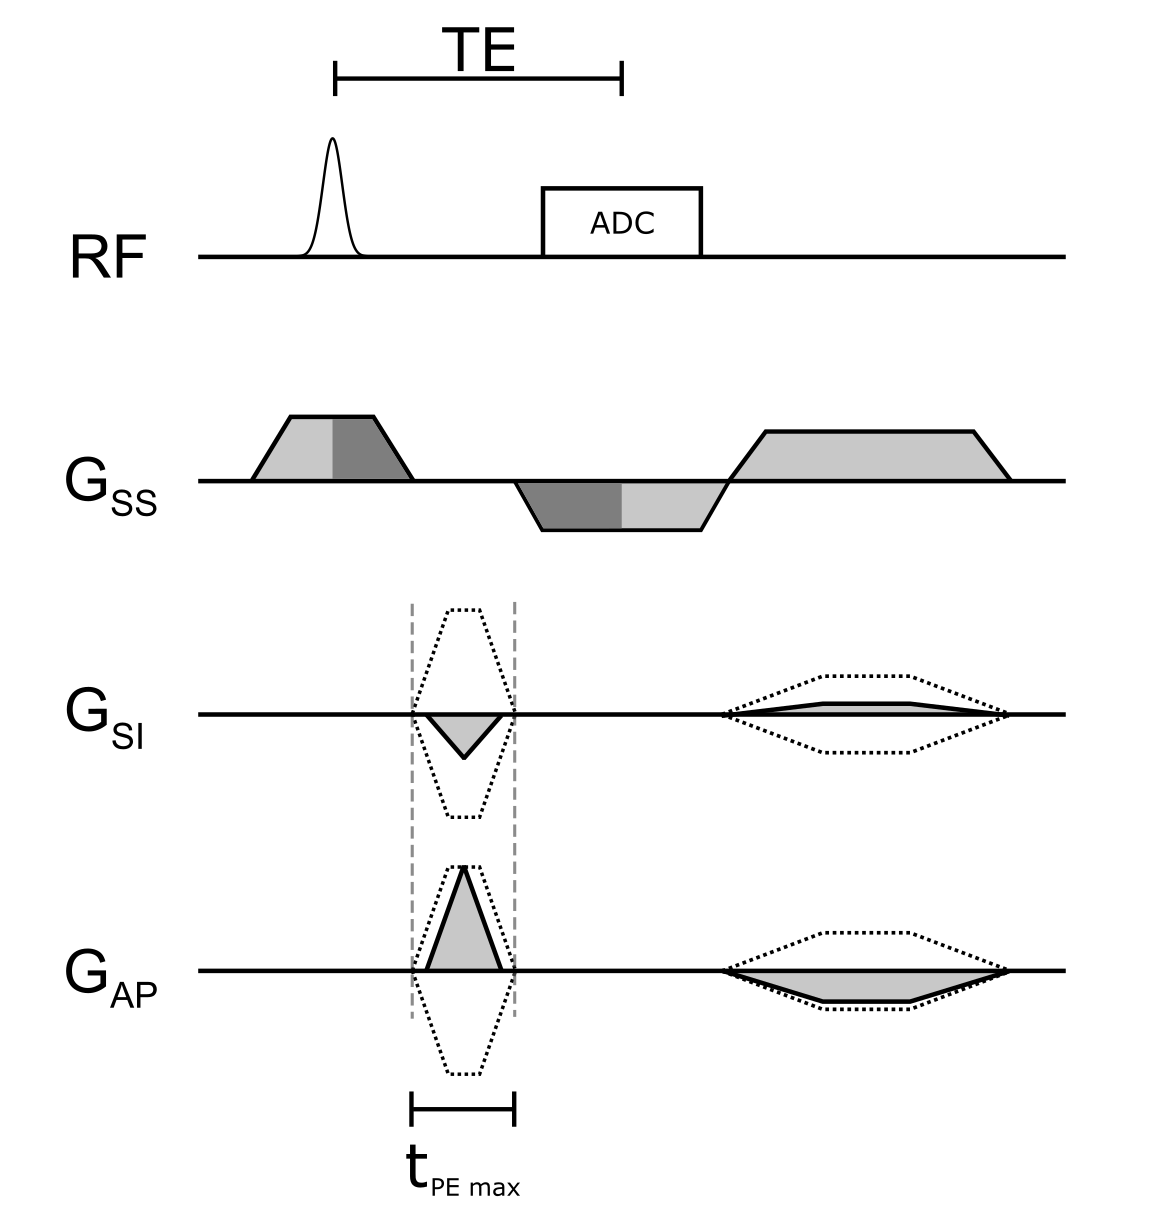
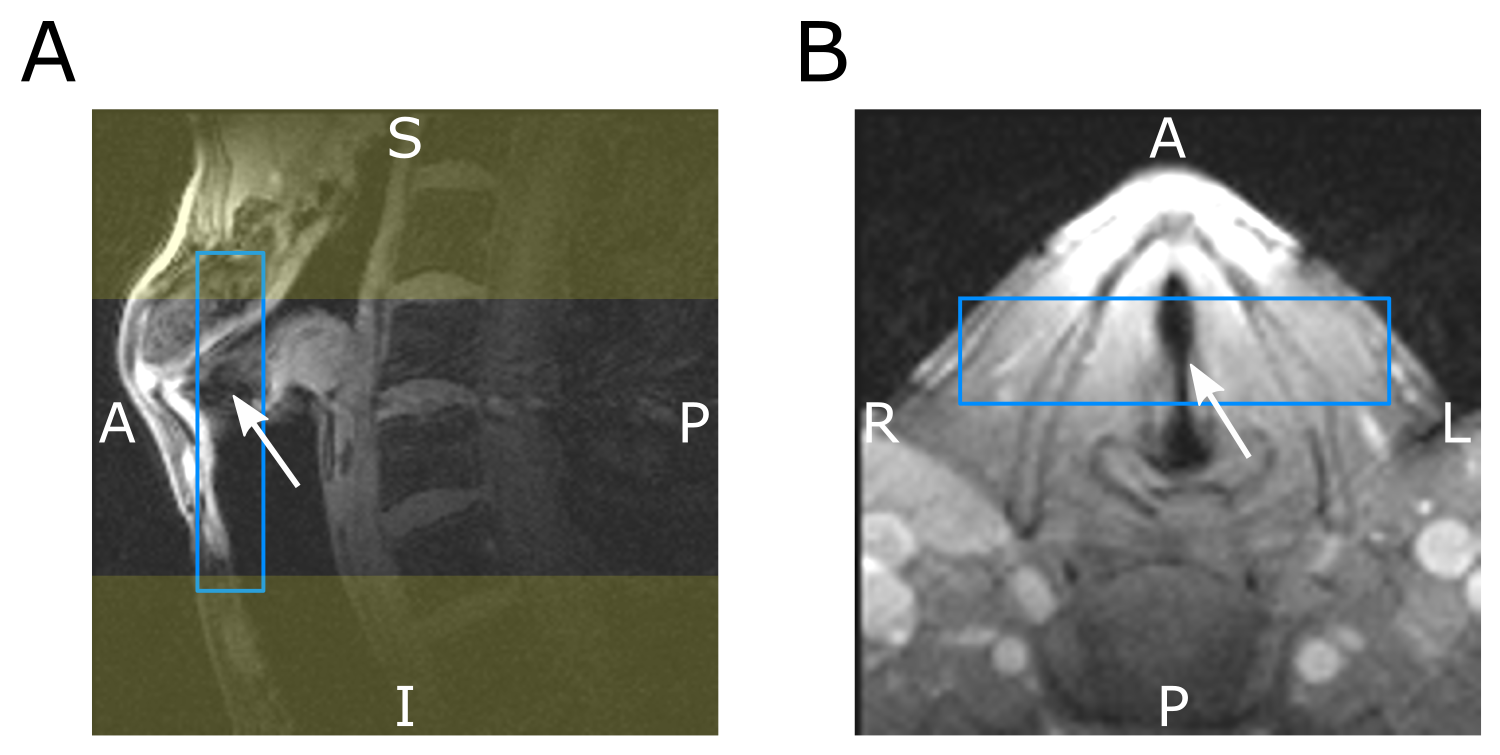
Assuming that vocal fold motion occurs only in the coronal plane, we use rapidly switched phase encoding gradients to encode the two in-plane directions, and a much slower frequency encoding gradient in slab selection direction. A diagram of the 2.5D SPIRE sequence is shown in Figure 1. To reduce gradient switching and to optimize sequence timing, parameters were chosen such that slice rephasing and readout dephasing compensate. This is the case for $$\mathrm{SPS}=\mathrm{TBWP}\cdot\frac{1+\frac{\mathrm{Rdt}}{T_\mathrm{RF}}}{1+\frac{\mathrm{Rut}}{T_\mathrm{ADC}}},$$where SPS is the number of slices per slab, TBWP and $$$T_\mathrm{SS}$$$ are the time bandwidth product and duration of the slab selective RF‑pulse, Rdt is the ramp down time of $$$G_\mathrm{SS}$$$, Rut is the ramp up time of the readout gradient and $$$T_\mathrm{ADC}$$$ is the duration of the ADC. To obtain SPS=4, we use TBWP=3.6, Rdt=110μs, Rut=80μs, $$$T_\mathrm{ADC}$$$=1000μs and $$$T_\mathrm{SS}$$$=550μs. Slice thickness was set to 2.6mm and readout was oversampled by a factor of 2 to accommodate the continuous excitation profile. PE gradients are switched after full ramp down of $$$G_{SS}$$$ to avoid simultaneous switching on multiple gradient axes and are applied as short as possible ($$$\Delta t_\mathrm{max}$$$ = 640μs, a compromise between peripheral nerve stimulation and speed), which yields shorter gradient durations towards k‑space center. Oversampling in SPI is time inefficient, thus saturation bands were placed superior and inferior of the field of view and a rectangular field of view was applied in LR direction to further reduce the matrix size. The following imaging parameters were used: Slice thickness=3mm, FoV=60mm, matrix size 60x44x8, TE=1.61ms , TR=3.27ms, FA=10°. In Figure 2 the position of the slab and the saturation-bands can be seen. Navigator data were acquired every 300ms, and saturation pulses were applied every 100ms. The volunteer (male, 31y) was asked to sing a constant frequency of 100Hz and was provided visual feedback via a spectrogram. An MR-safe electroglottogram (EGG)4 was acquired during the measurement and synchronized with the MR-acquisition using an optical trigger. MR-signal was acquired with a loop-coil (R=3.5cm) on top of the EGG-electrodes which are located on either side of the larynx. From the acquired EGG data, the phase of the periodic vocal fold motion was identified at the time of each PE event and used for gating of the MR-signal. MR-data were then sorted into 12 continuous frames, and the resulting 60x44x8x12 k-space was reconstructed with a total variation constraint along the temporal (4th-) dimension using BART5. Translation of the larynx during measurements was estimated from projection navigators using phase only cross correlation (POCC)6 and Fourier shift theorem was used to correct for in-plane motion at each readout event prior to reconstruction.Results
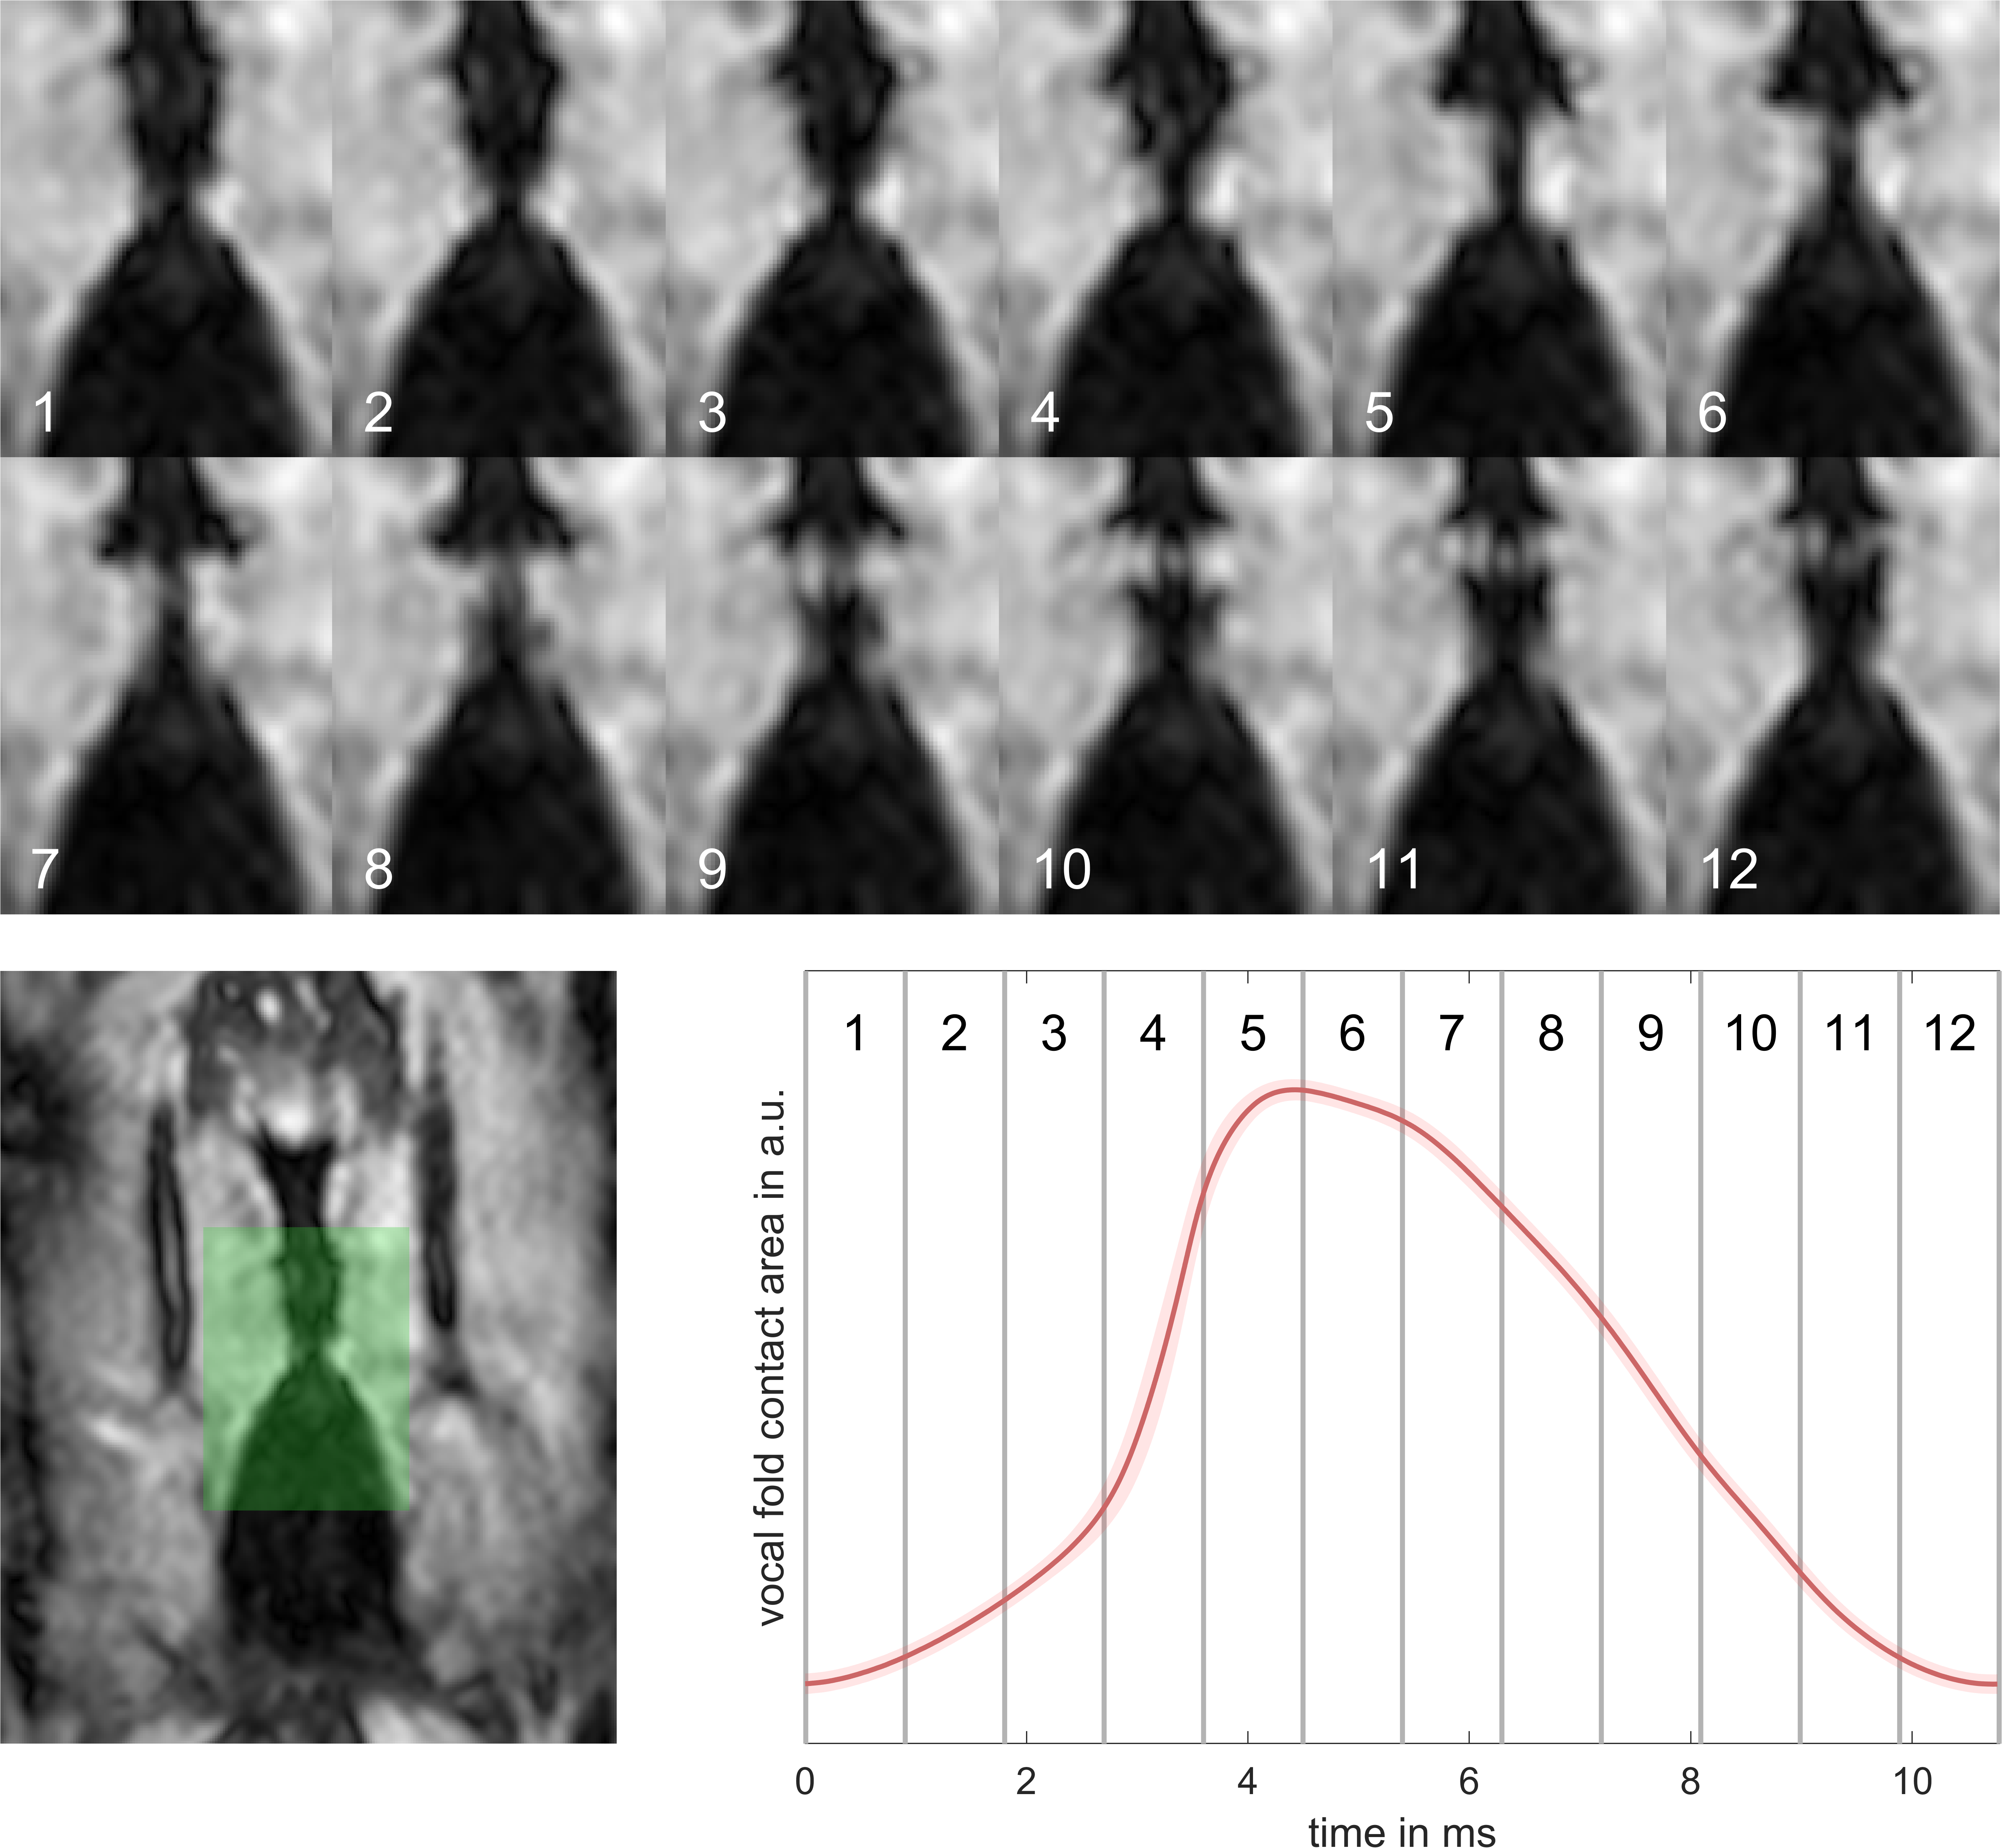
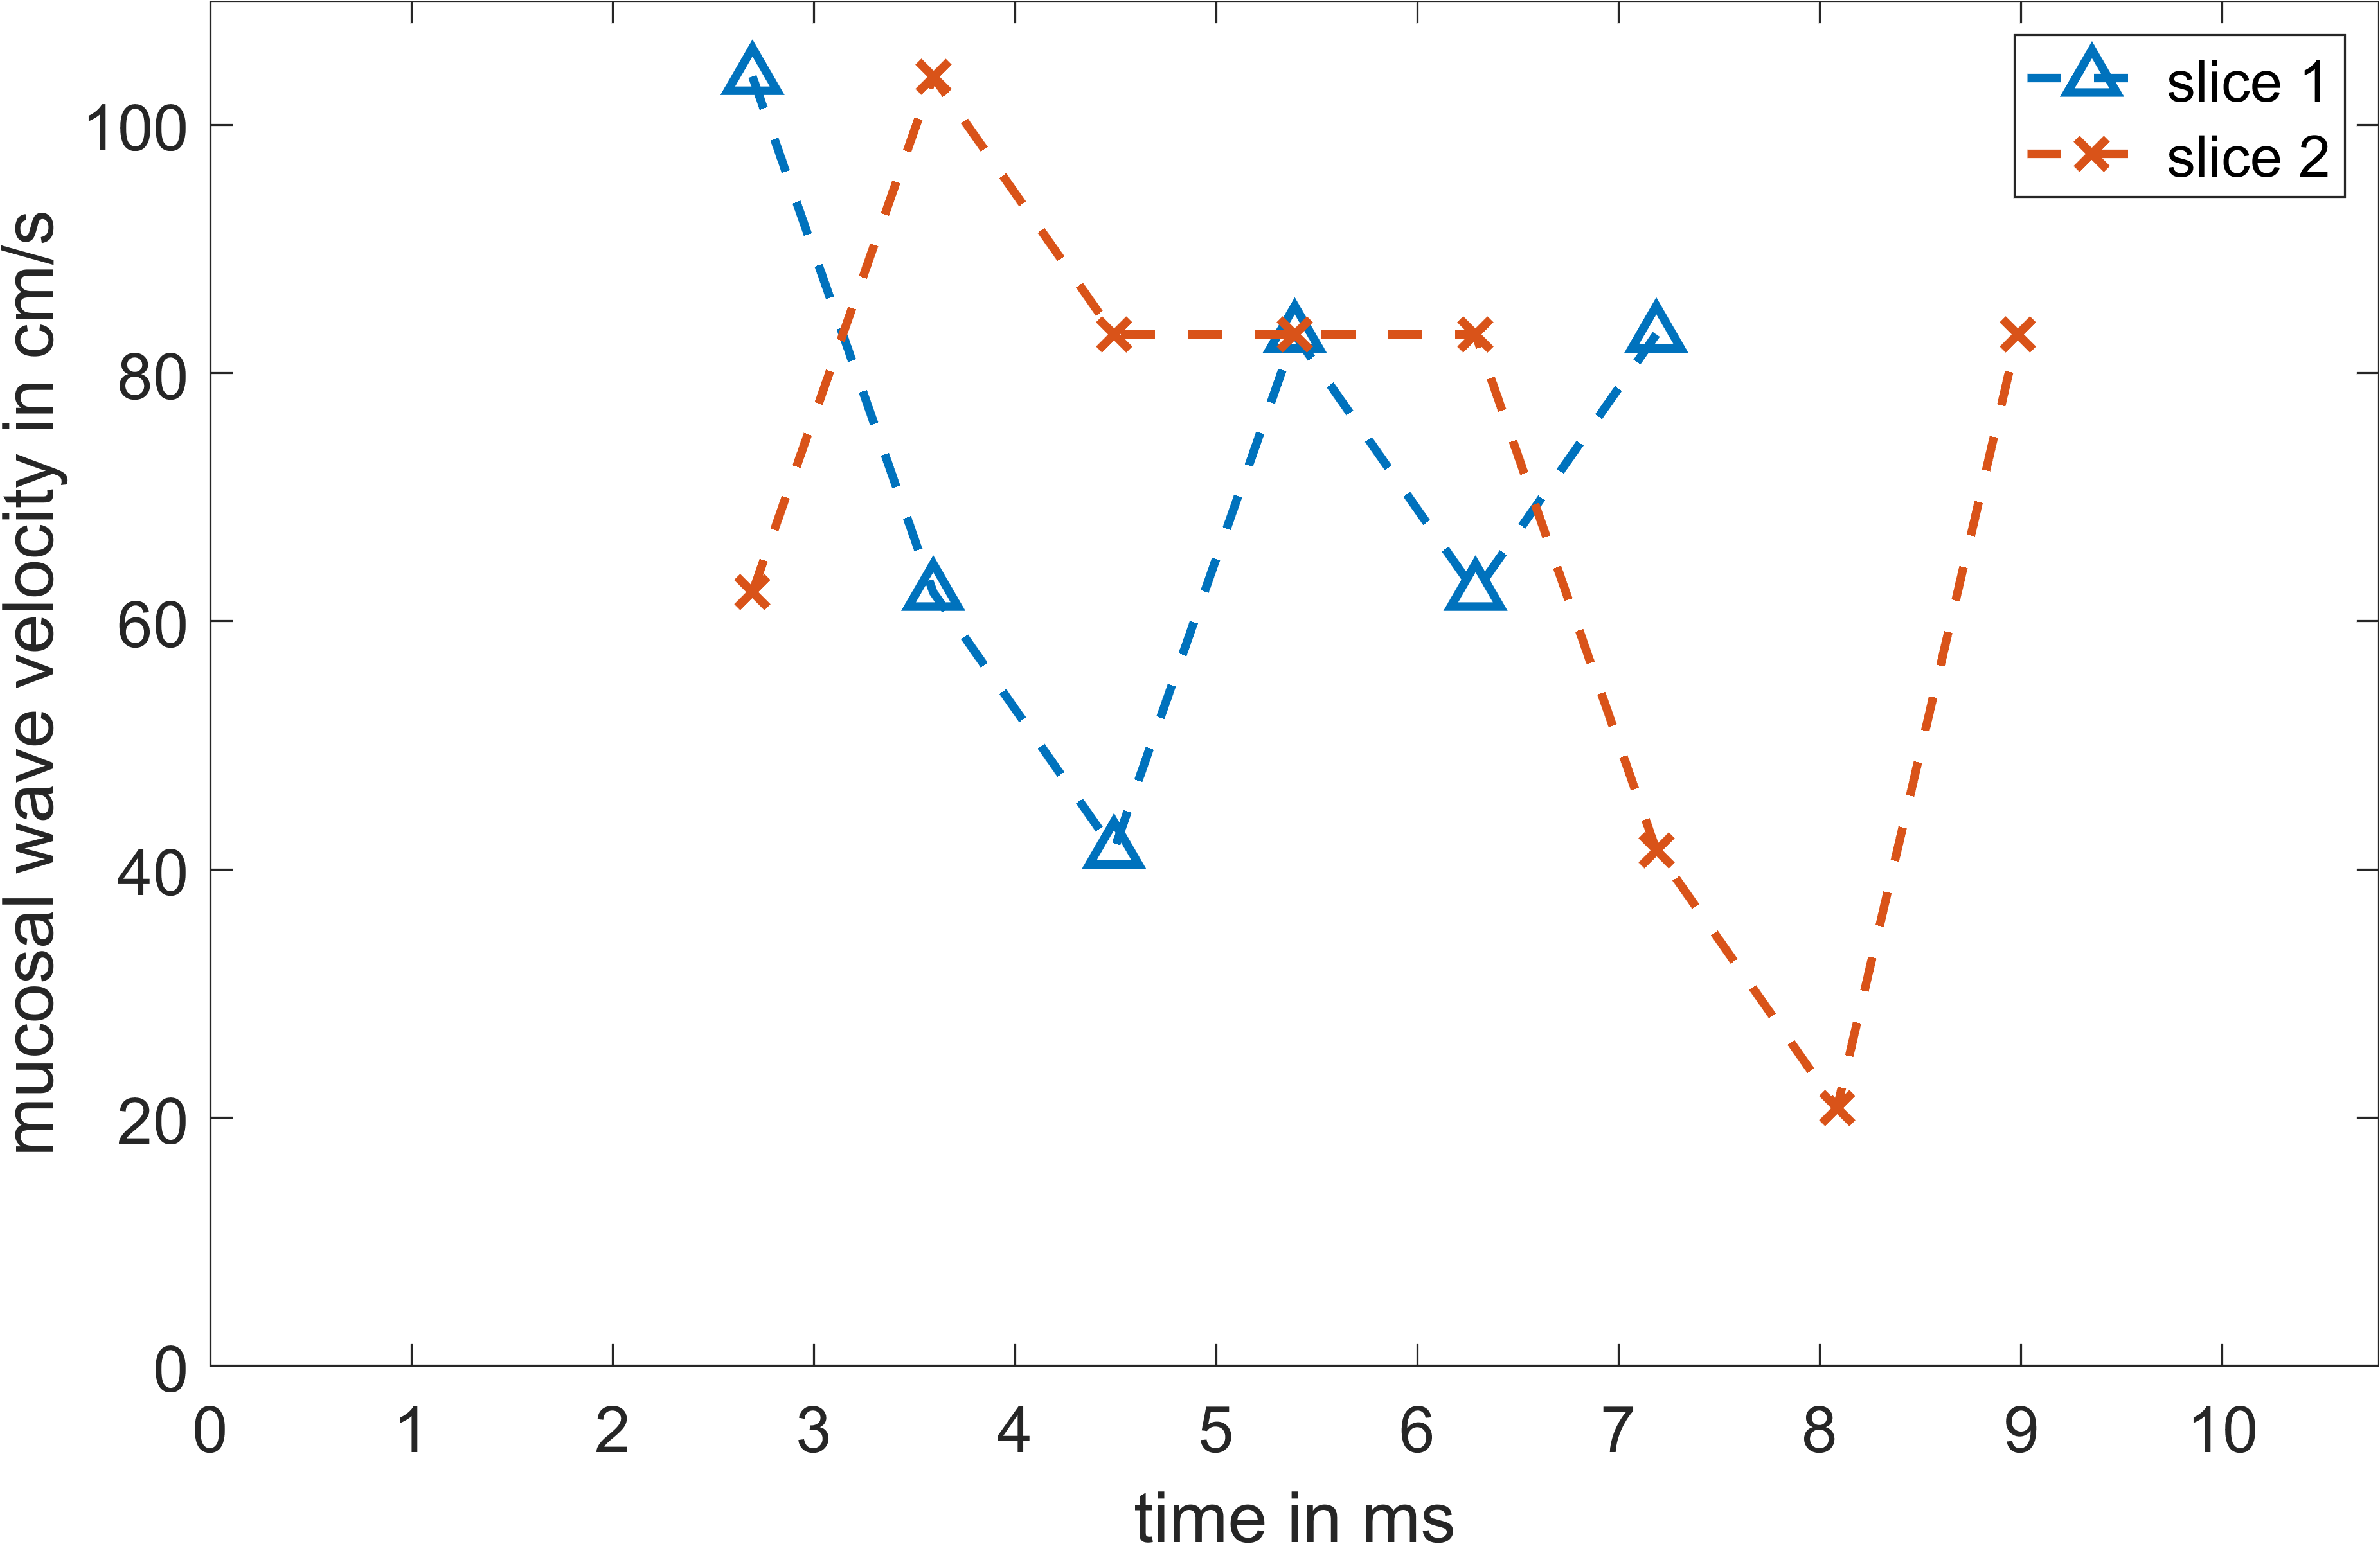
In Figure 3, vocal fold motion is shown in 12 dynamic frames with a temporal resolution of 890μs and compared to the mean EGG signal. A video of the reconstructed motion in four adjacent slices can be seen in Figure 4, here the motion is replayed at 1/50th its original speed. From the data of slices 1 and 2 in Figure 4, the velocity of the upwards-traveling mucosal wave is estimated to be 73±22 cm/s and 70±27 cm/s, respectively (Figure 5).Discussion
The addition of a frequency encoding gradient in slab selection direction to a 2D SPIRE acquisition allows for the simultaneous measurement of the vocal fold oscillations at multiple locations, and it reduces the individual slice thickness from 5mm to 2.6mm. In the reconstructed images, the closure of the vocal folds can be seen starting at the bottom and moving upwards as the mucosal wave until finally opening again at the top. Estimated values for the mucosal wave velocity were about twofold lower than values measured with Doppler ultrasound in male volunteers3. This interesting finding could be explained as with MRI the muscle tissue in the vocal folds is measured which moves at slower velocities than the mucosal wave which is formed by the superficial layers of the vocal folds. This might also explain the small gap that remains between both vocal folds in the reconstructed frames.Acknowledgements
No acknowledgement found.References
[1] J. Fischer, T. Abels, A. C. Özen, M. Echternach, B. Richter, und M. Bock, „Magnetic resonance imaging of the vocal fold oscillations with sub-millisecond temporal resolution“, Magnetic Resonance in Medicine, Bd. 83, Nr. 2, S. 403–411, 2020, doi: 10.1002/mrm.27982.
[2] Fischer, Johannes, Özen, Ali Caglar, Echternach, Matthias, Richter, Bernhard, und Bock, Michael, „Sub-millisecond 2D MRI of the Vocal Fold Oscillation using Single Point Imaging with Rapid Encoding (SPIRE)“, gehalten auf der ISMRM 29th annual Meeting & Exhibition, Sydney, 2020.
[3] C. R. Krausert, A. E. Olszewski, L. N. Taylor, J. S. McMurray, S. H. Dailey, und J. J. Jiang, „Mucosal Wave Measurement and Visualization Techniques“, Journal of Voice, Bd. 25, Nr. 4, S. 395–405, Juli 2011, doi: 10.1016/j.jvoice.2010.02.001.
[4] A. C. Özen u. a., „Ensuring safety and functionality of electroglottography measurements during dynamic pulmonary MRI“, Magnetic Resonance in Medicine, Bd. 76, Nr. 5, S. 1629–1635, Nov. 2016, doi: 10.1002/mrm.26037.
[5] M. Uecker u. a., „Berkeley Advanced Reconstruction Toolbox“, in In Proc. Intl. Soc. Mag. Reson. Med., Toronto, 2015, Bd. 23, S. 2486.
[6] A. de Oliveira, J. Rauschenberg, D. Beyersdorff, W. Semmler, und M. Bock, „Automatic passive tracking of an endorectal prostate biopsy device using phase-only cross-correlation“, Magnetic Resonance in Medicine, Bd. 59, Nr. 5, S. 1043–1050, Mai 2008, doi: 10.1002/mrm.21430.
Figures