0901
Rapid simultaneous T1 and T2 quantification (RAS-Q T1T2) of the myocardium using transient bSSFP with variable flip angles1Department of Pediatrics, Harvard Medical School, Boston, MA, United States, 2Department of Cardiology, Boston Children's Hospital, Boston, MA, United States, 3Department of Informatics, Technical University Munich, Munich, Germany, 4Philips Healthcare, Boston, MA, United States
Synopsis
We developed a novel MRI pulse sequence RAS-Q T1T2 for the simultaneous quantification of T1 and T2 of the myocardium using transient bSSFP imaging with a variable flip angle scheme. RAS-Q T1T2 was systematically analyzed based on a numerical simulation, as well as phantom and patient studies. We show that RAS-Q T1T2 yields accurate T2 estimates for the myocardium with a trade-off in precision compared to state-of-the-art methods, reducing scan time to less than 4s. The estimated T1 values reveal lower accuracy and precision than clinically established methods and need further improvements.
Introduction
Longitudinal and transverse relaxation times (T1 and T2) have long been used for tissue characterization. More recently, there has been a surge of interest in measuring the T1 and T2 of the myocardium. Increased non-contrast myocardial T1 values have been related to various cardiomyopathies.1 Additionally, increased myocardial T2 values have been shown to correlate with myocarditis2 and edema3. The conventional approach to assessing myocardial T1 and T2 is to apply separate acquisition methods for each parameter. Several methods to simultaneously quantify myocardial T1 and T2 have been proposed.4,5,6,7 These techniques, however, entail certain limitations in clinical applicability, such as long breath-hold acquisition periods and scan times, which can be demanding for very young or ill cardiac patients. To avoid such restrictions, we developed a novel pulse sequence to simultaneously quantify the T1 and T2 of the myocardium in less than 4s.Methods
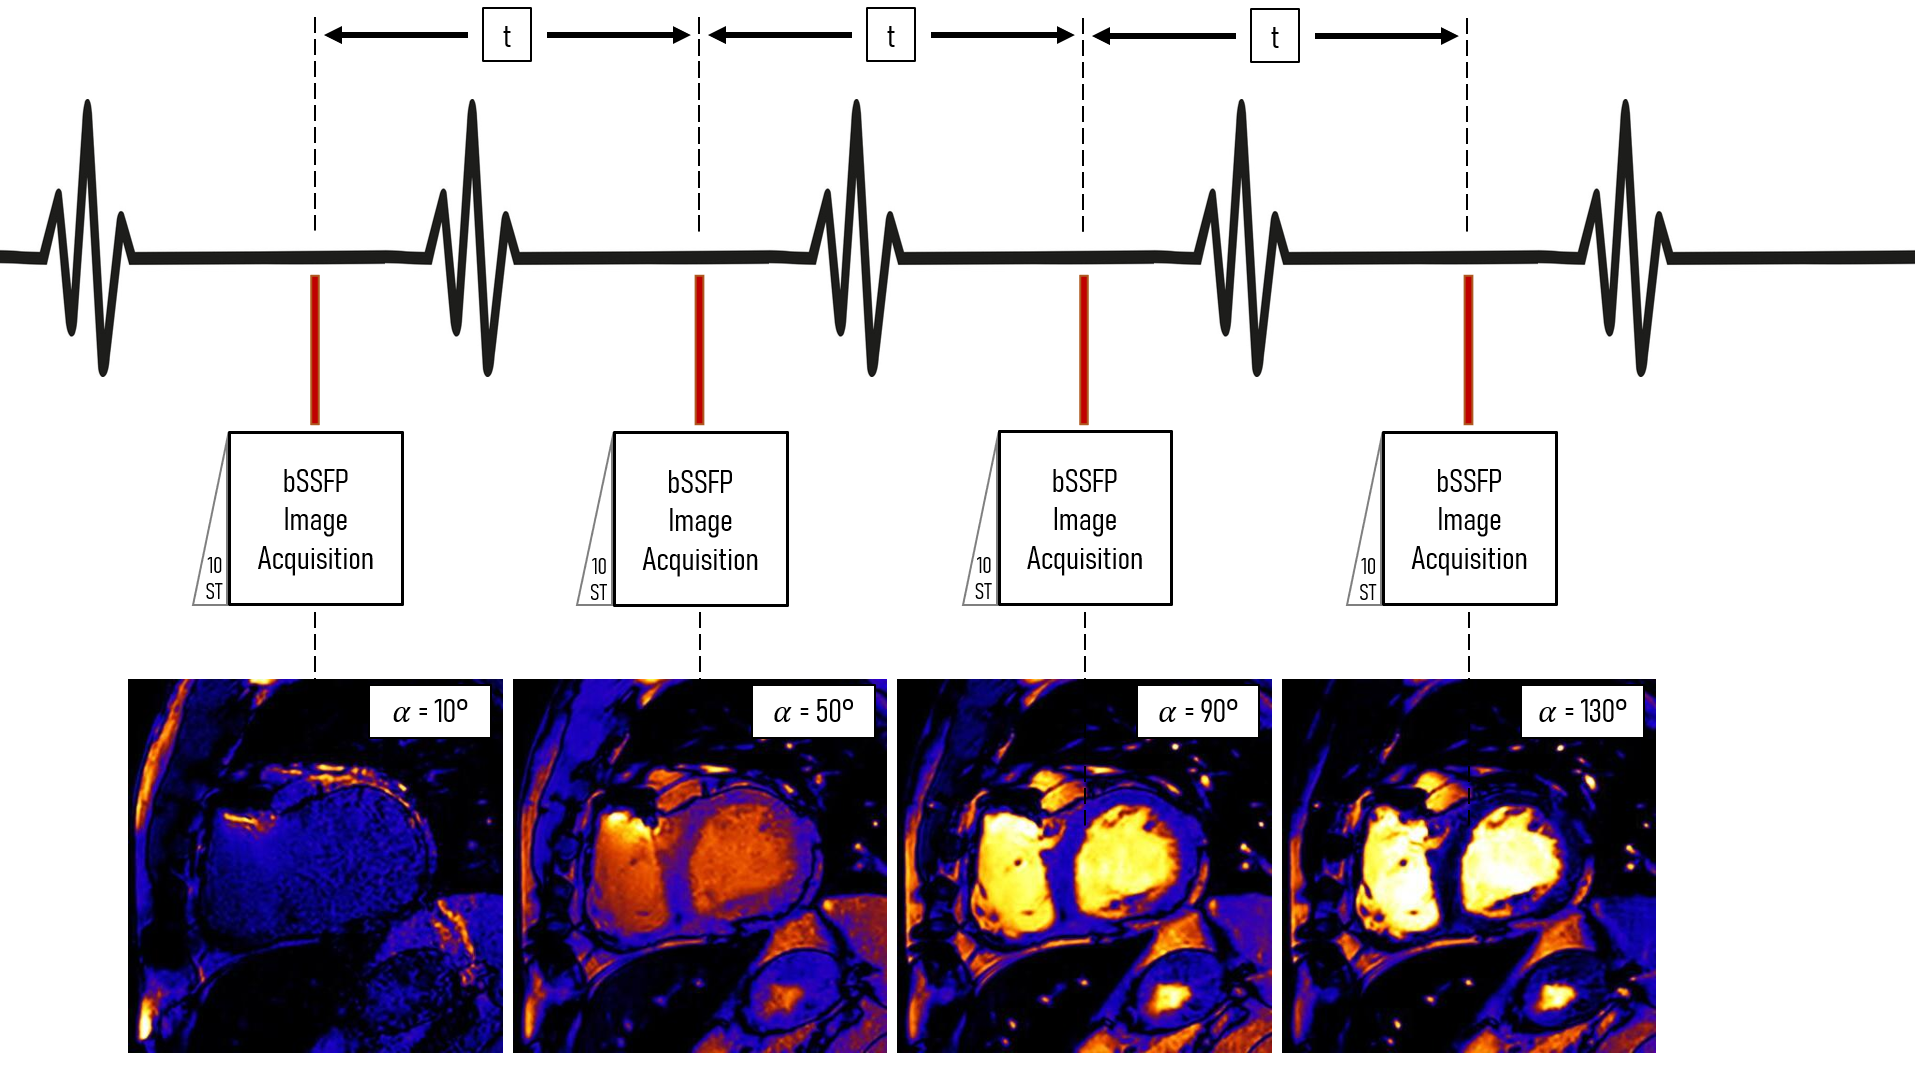
The proposed RAS-Q T1T2 pulse sequence combines transient balanced steady-state free precession (bSSFP) imaging,8,9,10 and a variable flip angle scheme.11,12 Four images are acquired with variable flip angles (FAs), (10°, 50°, 90°, 130°) at a specific cardiac phase in 4 heartbeats (Figure 1). Assuming heartrates between 60-120 bpm, the acquisition time is 2-4s. To account for partially recovered magnetization from previous images, we introduce an additional, iterative term $$$\delta_i$$$ to the transient phase bSSFP relaxation model10:$$ M_{RASQ}\ (\alpha_i\ )=\delta_i\times M_{trans}\ (\alpha_i\ ), \\\text{where } M_{trans}(\alpha_i) =(M_0\sin(\frac{\alpha_i}{2})-M_{SS}(\alpha_i))\lambda(\alpha_i)^n+M_{SS}(\alpha_i) \\
\text{with } M_{SS}(\alpha_i) = M_0 \frac{\sqrt{E_2}(1-E_1)\sin(\alpha_i)}{1-(E_1-E_2)\cos(\alpha_i)-E_1E_2} \text{, }\\
\lambda(\alpha_i)=E_1\cos^2(\frac{\alpha_i}{2})+E_2\sin^2(\frac{\alpha_i}{2}) \text{, }E_{1/2}=exp(\frac{-T_R}{T_{1/2}}),\\
\text{and } \delta_1=M_0 \text{, } \delta_i=M_0-(M_0-M_{RASQ} (\alpha_{i-1})\cot(\frac{\alpha_{i-1}}{2}))exp(\frac{-t}{T_{1}}) $$
FAs are denoted as $$$\alpha_i$$$ for each respective image, $$$t$$$ describes the time between heartbeats, $$$T_R$$$ is the repetition time, and $$$n$$$ was fitted to match the underlying magnetization. To reduce the number of unknown parameters, we normalize the pixel intensities by dividing them by the corresponding pixel of the last image. This eliminates the term for proton density $$$M_0$$$ .
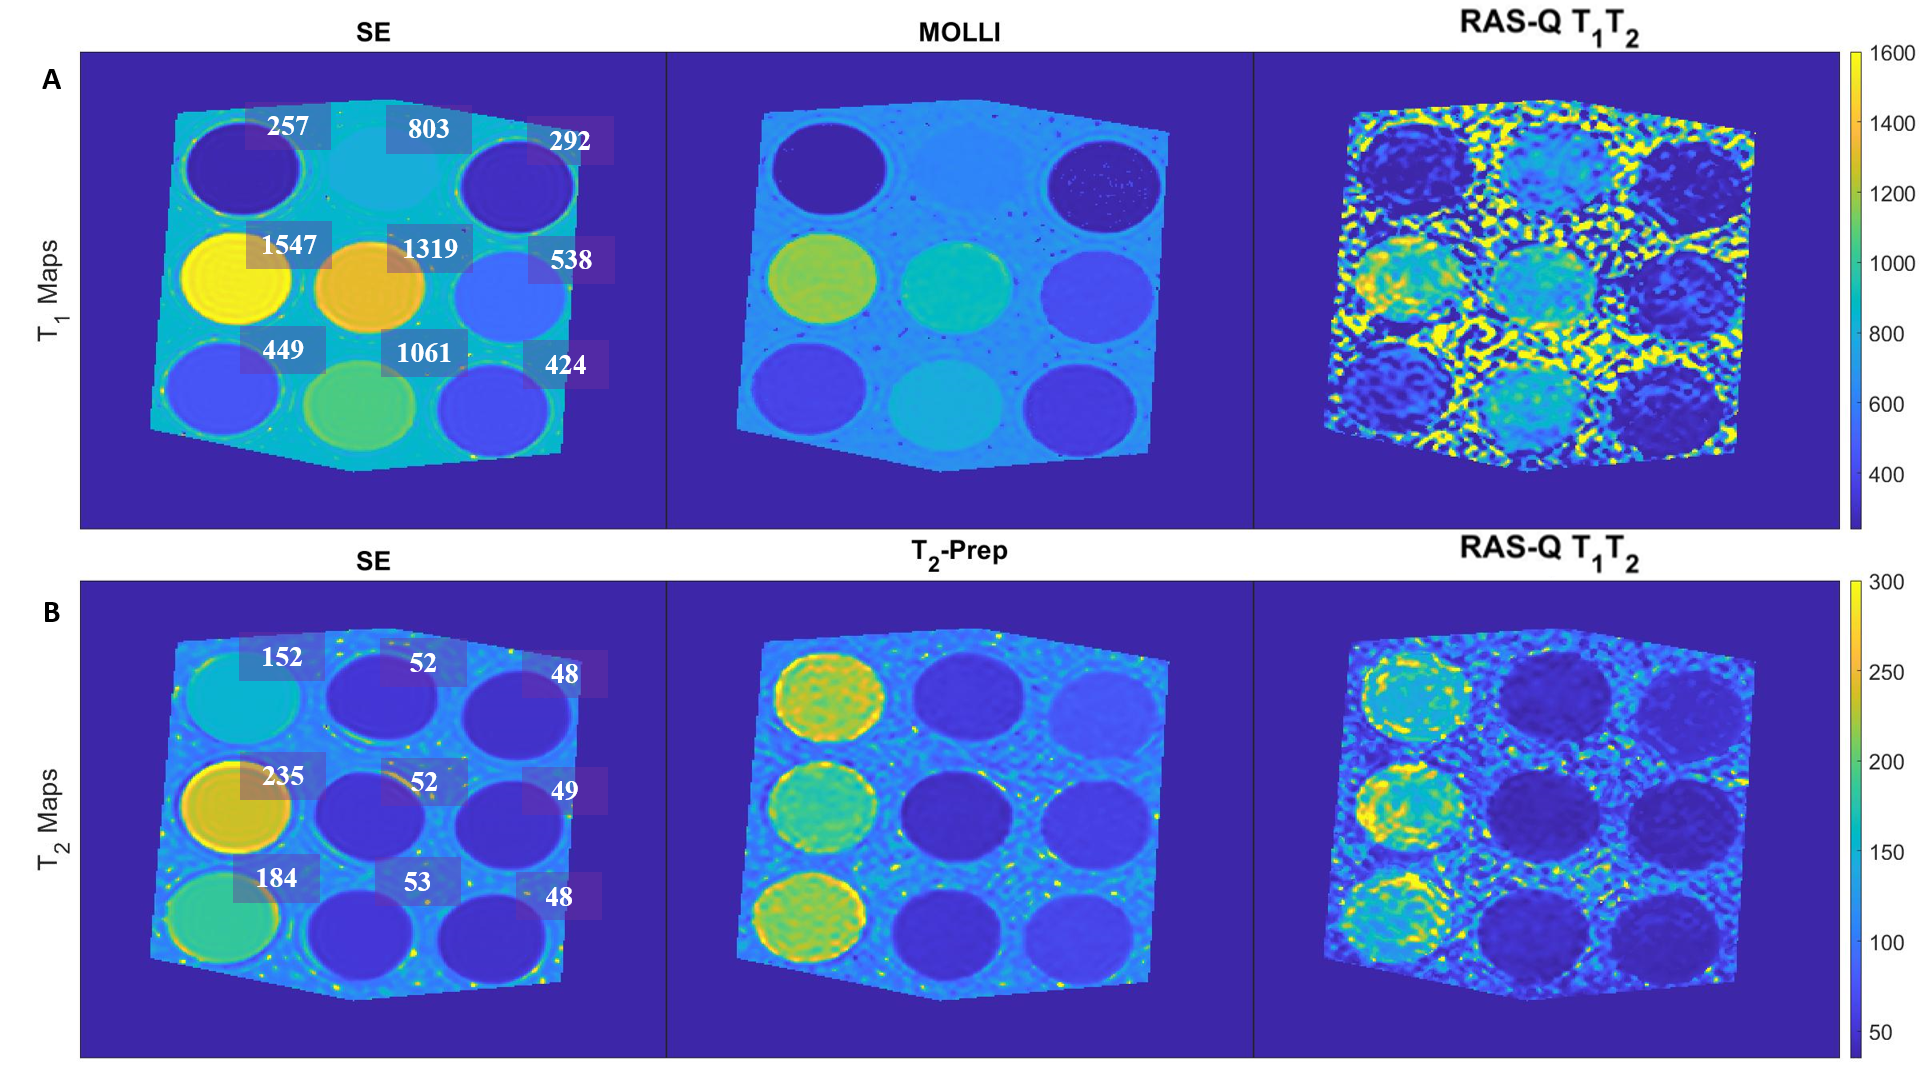
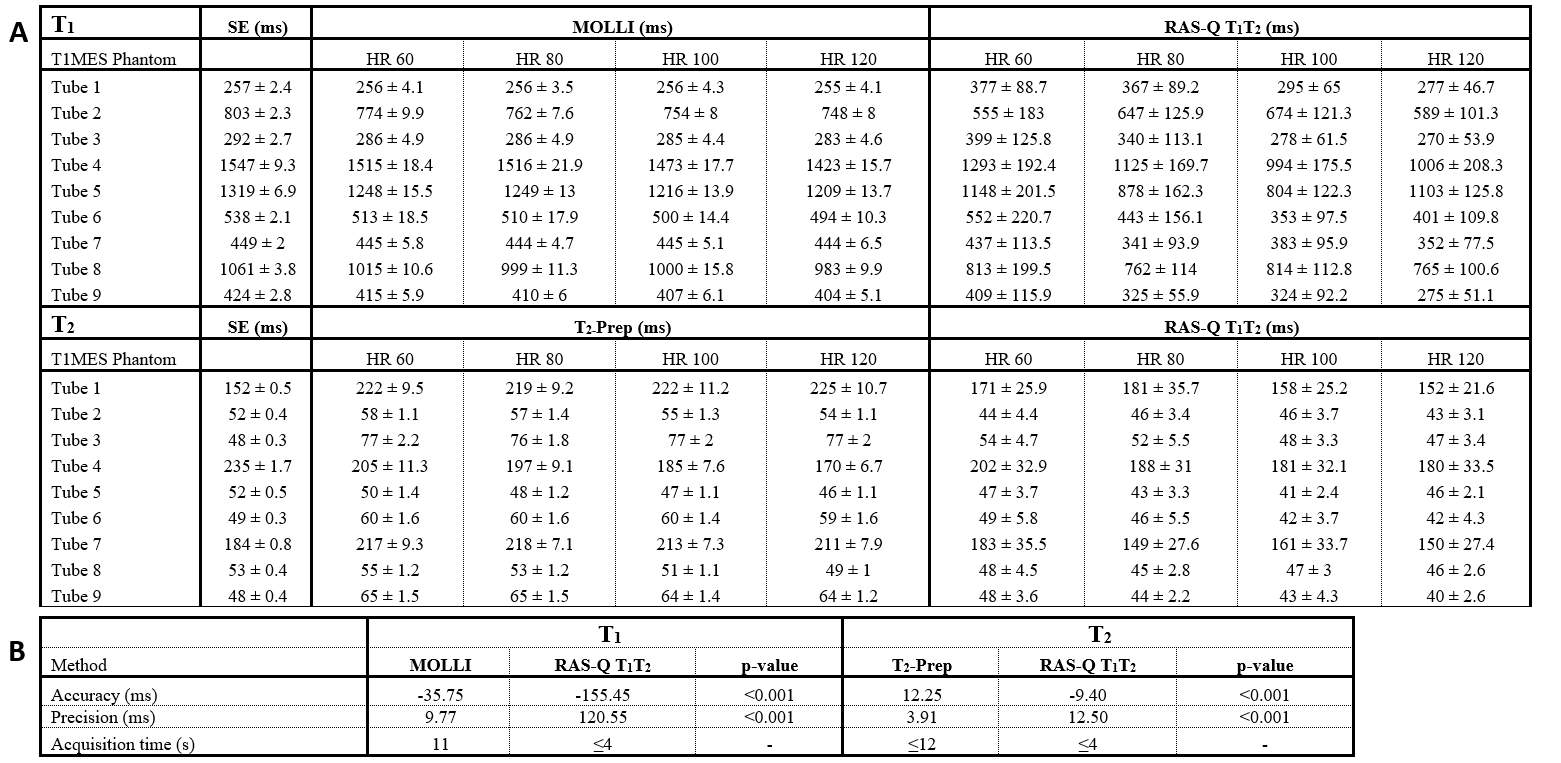
We systematically investigated the feasibility of the novel RAS-Q T1T2 approach with a numerical simulation, as well as a phantom and in vivo study. The phantom study was performed to compare the proposed sequence to T1 and T2 of the gold-standard spin echo (SE) (T1 Acquisition: TR/TE:10000/11ms, 17 inversion times: 50-5000ms (min-max), FA: 90°; T2 Acquisition: TR/TE: 10000/32*10ms, FA: 90°), and Modified Look-Locker IR (MOLLI)13 (TR/TE: 2.53/1.27ms, FA: 35°, scheme: 5(3s)3, total acquisition time (TAT): 11s) for T1 evaluation, and T2-Prep14 (TR/TE: 2.65/1.33ms, FA: 35°, rest period: 2 heartbeats, T2-Prep delay: 0, 25, 50, and 75ms, TAT: ≤12s) for T2 evaluation. The experiments were performed on the T1MES phantom15 at 4 different heartrates (60, 80, 100, 120 bpm) with FOV: 200 (RL) × 200 (AP) × 10 (FH) mm, CS-SENSE 3, and 10 startup pulses for all methods. We performed an in vivo feasibility study in 2 patients for RAS-Q T1T2. All scans were performed on a 1.5T Philips scanner (1.5T Achieva d-stream). The quantification algorithms were implemented in MATLAB (MathWorks Inc., Natick, MA, USA). Method evaluation was based on accuracy (mean error compared to SE) and precision (pixel-wise standard deviation within region-of-interest). A paired student t-test was used for statistical analysis and a p-value≤0.05 was assumed statistically significant.
Results
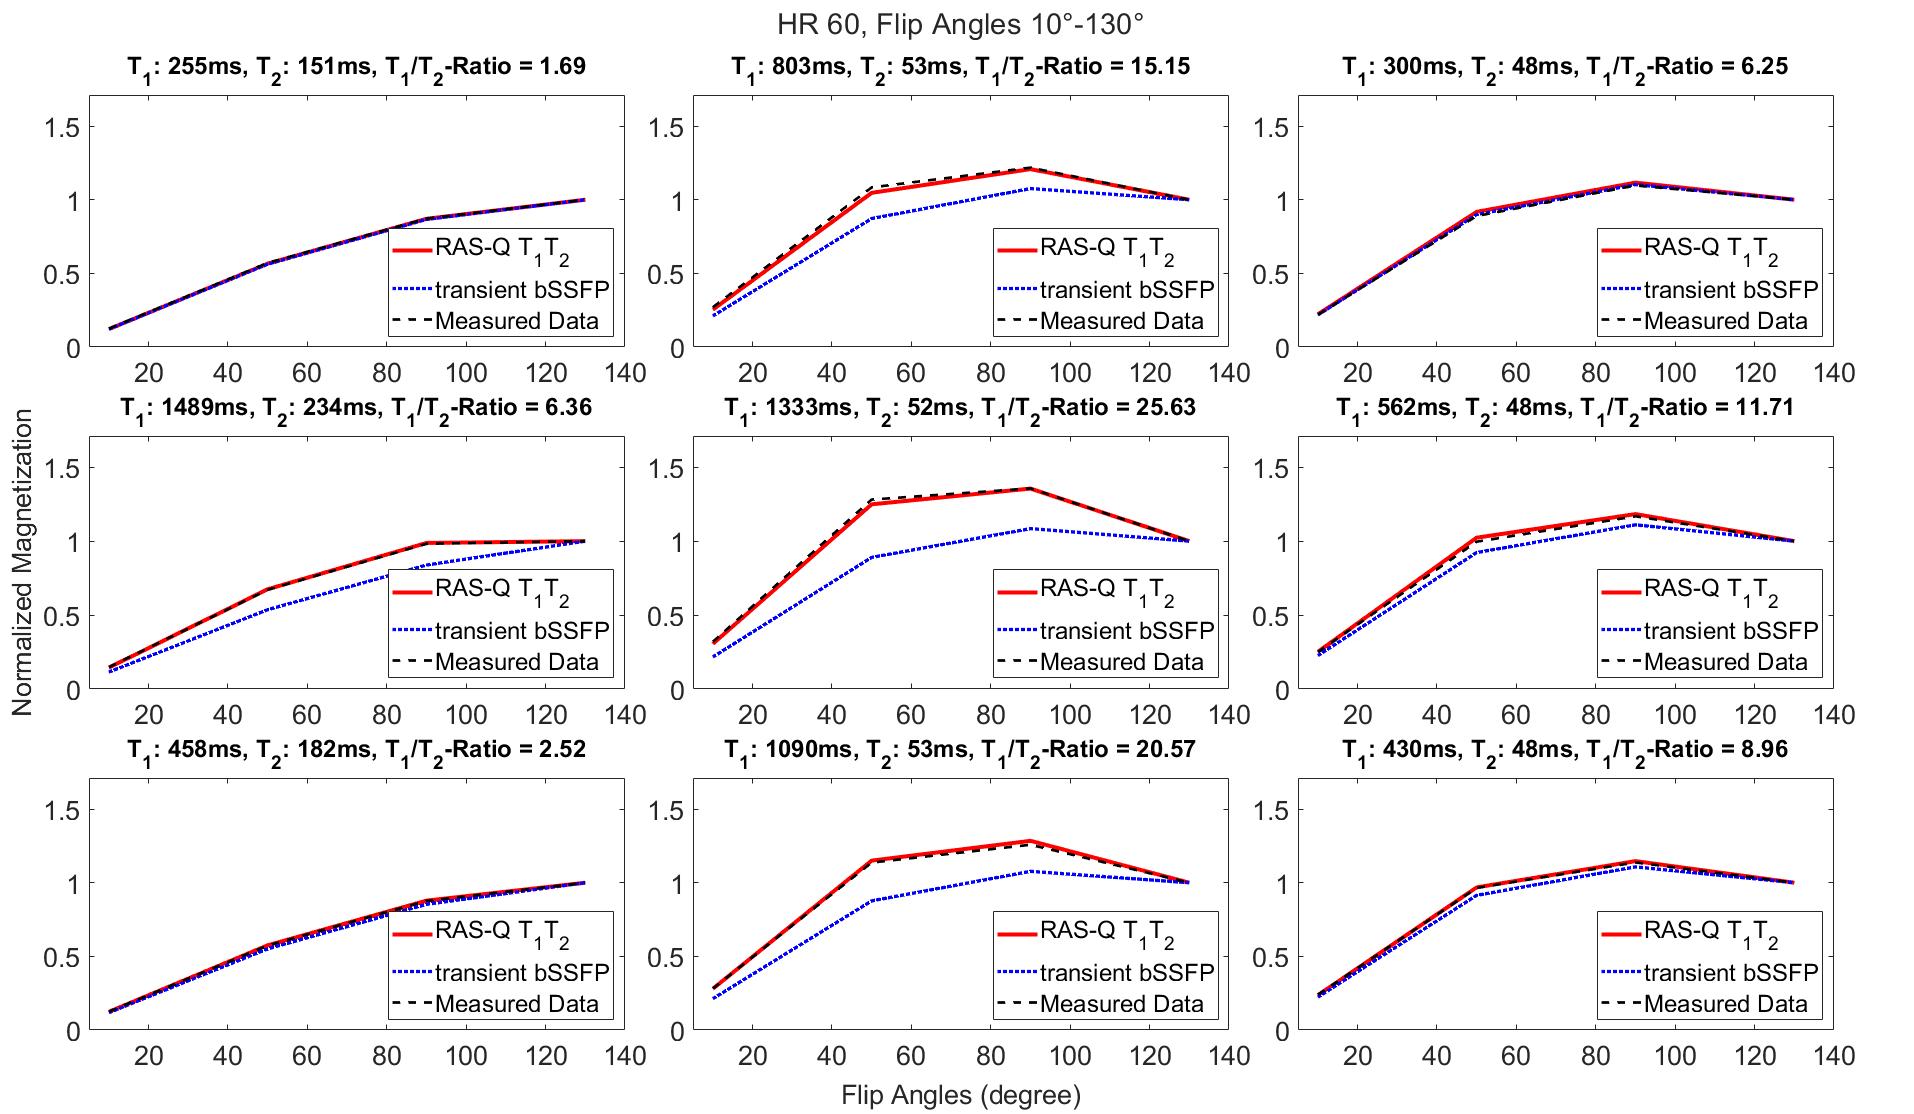
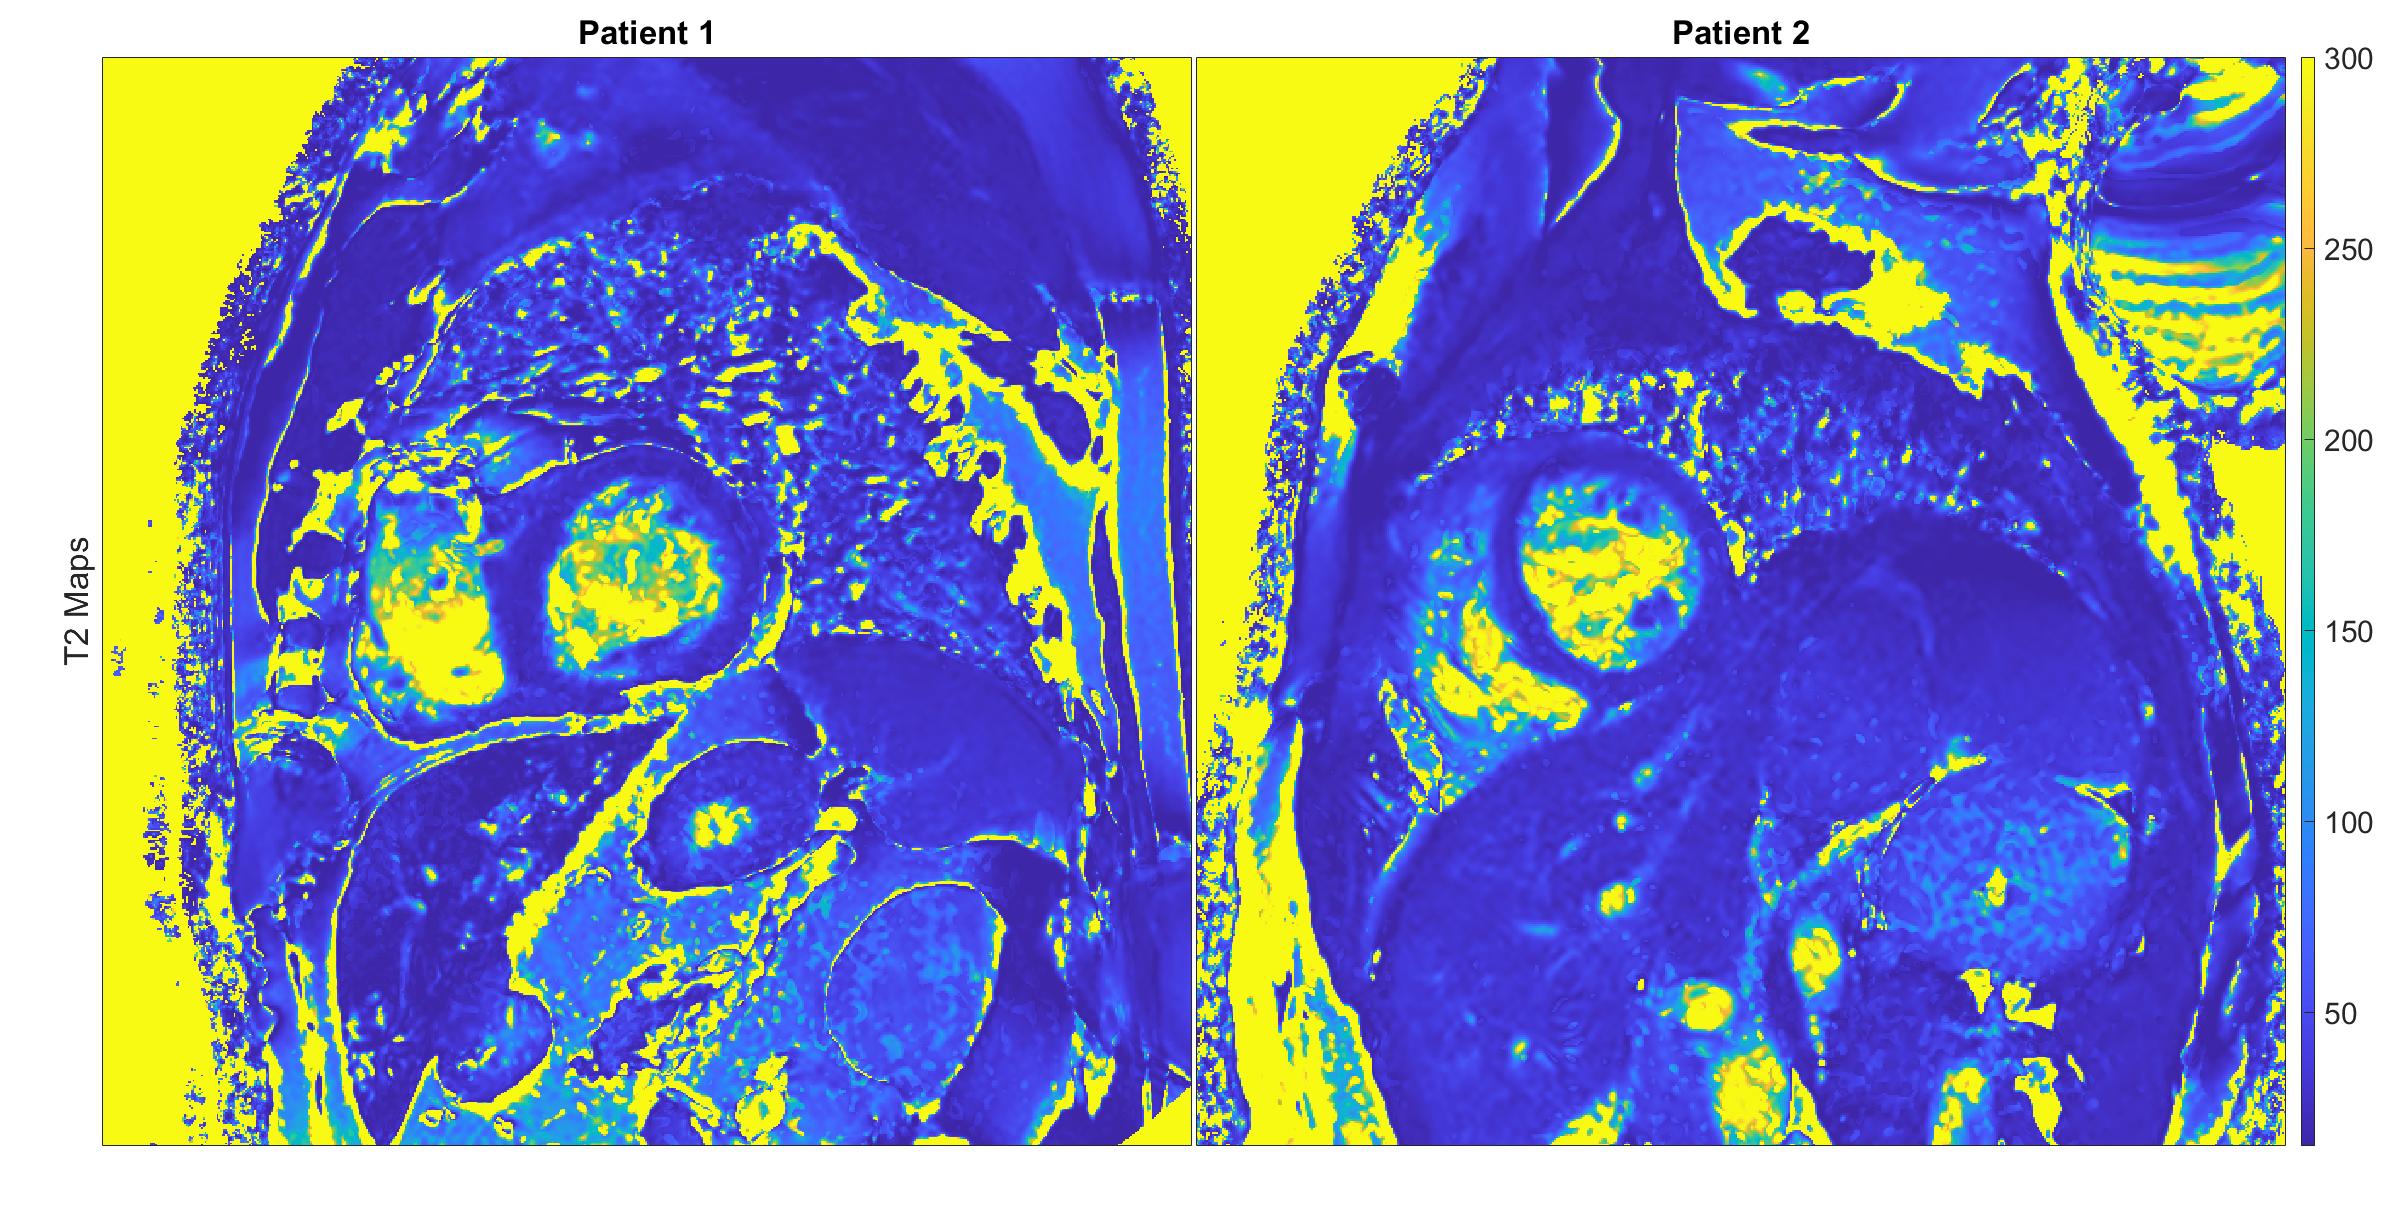
For the phantom study, the gold-standard SE yielded the following ranges for T1 = [257-1547ms] and T2 = [48-235ms]. T1 quantification with MOLLI demonstrated an accuracy/ precision of -35.8ms/ 9.8ms compared to SE. The comparison of RAS-Q T1T2 to SE for T1 resulted in an accuracy/ precision of -155.5ms/ 120.6ms. T2 quantification with T2-Prep demonstrated an accuracy/precision of 12.3ms/ 3.9ms compared to SE. The comparison of RAS-Q T1T2 to SE for T2 resulted in an accuracy/ precision of -9.4ms/ 12.5ms (Table 1). Figure 2 shows the RAS-Q T1T2 magnetization curves for the phantom study at heartrate 60 bpm. Figure 3 shows the T1 and T2 maps of the phantom for all sequences. Figure 4 demonstrates the T2 maps of 2 patients calculated with RAS-Q T1T2.Discussion
RAS-Q T1T2 allows rapid myocardial T1 and T2 quantification in 4 heartbeats. RAS-Q T1T2 shows lower accuracy and precision compared to MOLLI. RAS-Q T1T2 shows higher accuracy and lower precision compared to T2-Prep-based T2 mapping, which is considered a trade-off for a much shorter scan time and simultaneous estimation of T1. Depending on the patient’s heartrate, the acquisition time of RAS-Q T1T2 is 2.75-6 times faster than for MOLLI or T2-Prep.Conclusion
We demonstrate technical feasibility of myocardial T1 and T2 mapping with RAS-Q T1T2. Clinical applicability of T1 quantification needs to be investigated further. The estimation of myocardial T2 in the phantom results in accurate values with acceptable precision compared to T2-Prep. Future studies to improve T1 quantification to establish RAS-Q T1T2 as a method to simultaneously quantify T1 and T2 are warranted.Acknowledgements
This project was supported by a scholarship of the Harvard Scholarship Foundation Germany e.V.References
1. Moon JC, Messroghli D, Kellman P, et al. Myocardial T1 mapping and extracellular volume quantification: a Society for Cardiovascular Magnetic Resonance (SCMR) and CMR Working Group of the European Society of Cardiology consensus statement. Journal of Cardiovascular Magnetic Resonance. 2013;15(1):92-92.
2. Spieker M, Haberkorn S, Gastl M, et al. Abnormal T2 mapping cardiovascular magnetic resonance correlates with adverse clinical outcome in patients with suspected acute myocarditis. Journal of Cardiovascular Magnetic Resonance. December 2017;19.
3. Nishii T, Kono AK, Shigeru M, et al. Cardiovascular magnetic resonance T2 mapping can detect myocardial edema in idiopathic dilated cardiomyopathy. The International Journal of Cardiovascular Imaging. April 2014;30.
4. Santini F, Kawel-Boehm N, Geiser A, Bremerich J, Bieri O. Simultaneous T1 and T2 quantification of the myocardium using cardiac balanced-SSFP inversion recovery with interleaved sampling acquisition (CABIRIA). Magnetic Resonance in Medicine. 2015;74:365-371.
5. Akcakaya M, Weingärtner S, Basha TA, Roujol S, Bellm S, Nezafat R. Joint myocardial T1 and T2 mapping using a combination of saturation recovery and T2-preparation. Magnetic Resonance in Medicine. September 2016;76(3):888-896.
6. Qi H, Bustin A, Cruz G, et al. Free-running simultaneous myocardial T1/T2 mapping and cine imaging with 3D whole-heart coverage and isotropic spatial resolution. Magnetic Resonance Imaging. 2019;63:159-169.
7. Hamilton JI, Jiang Y, Chen Y, et al. MR fingerprinting for rapid quantification of myocardial T1, T2, and proton spin density. Magnetic Resonance in Medicine. 2017;77(4):1446-1458.
8. Oppelt A, Graumann R, Barfuss H, Fischer H, Hartl W, Schajor W. FISP: eine neue schnelle Pulssequenz fuer die Kernspintomographie. Electromedica. 1986;54(1):15-18.
9. Bieri O, Scheffler K. Fundamentals of balanced steady state free precession. Journal of Magnetic Resonance Imaging. 2013;38:2-11. 10. Scheffler K. On the Transient Phase of Balanced SSFP Sequences. Magnetic Resonance in Medicine. April 2003;49(4):781-783.
11. Worters P, Hargreaves B. Balanced SSFP transient imaging using variable flip angles for a predefined signal profile. Magnetic Resonance in Medicine. November 2010;64(5):1404-1412.
12. Srinivasan S, Ennis DB. Variable flip angle balanced steady-state free precession for lower SAR or higher contrast cardiac cine imaging. Magnetic Resonance in Medicine. March 2014;71(3):1035-1043.
13. Messroghli D, Radjenovic A, Kozerke S, Higgins DM, Sovananthan MU, Ridgway JP. Modified Look-Locker inversion recovery (MOLLI) for high-resolution T1 mapping of the heart. Magnetic Resonance in Medicine. June 2004;52(1):141-146.
14. Giri S, Chung YC, Merchant A, et al. T2 quantification for improved detection of myocardial edema. Journal of Cardiovascular Magnetic Resonance. December 2009;11:56.
15. Captur G, Gatehouse PD, Kellman P, et al. A T1 and ECV phantom for global T1 mapping quality assurance: The T1 mapping and ECV standardisation in CMR (T1MES) program. Journal of Cardiovascular Magnetic Resonance. 2016;18(1):1-3.
Figures