0891
Lipid and water separation through an SMS-like approach in 7T to reduce SAR in brain EPI
Amir Seginer1, Edna Furman-Haran2,3, Ilan Goldberg4, and Rita Schmidt3,5
1Siemens Healthcare, Rosh Ha'ayin, Israel, 2Life Sciences Core Facilities, Weizmann Institute of Science, Rehovot, Israel, 3The Azrieli National Institute for Human Brain Imaging and Research, Weizmann Institute of Science, Rehovot, Israel, 4Deparment of Neurology, Wolfson medical center, Holon, Israel, 5Neurobiology Department, Weizmann Institute of Science, Rehovot, Israel
1Siemens Healthcare, Rosh Ha'ayin, Israel, 2Life Sciences Core Facilities, Weizmann Institute of Science, Rehovot, Israel, 3The Azrieli National Institute for Human Brain Imaging and Research, Weizmann Institute of Science, Rehovot, Israel, 4Deparment of Neurology, Wolfson medical center, Holon, Israel, 5Neurobiology Department, Weizmann Institute of Science, Rehovot, Israel
Synopsis
We examine the potential to significantly reduce SAR in 7T fMRI (GRE-EPI) by circumventing the fat-suppression pulse. The resulting (shifted) lipid artifact is resolved by a parallel-imaging based reconstruction which separates the lipid and water images. Simulations, phantom experiments, and fMRI experiments were performed with the suggested method. SAR was shown to be reduced to less than half, allowing to shorten the repetition time and/or increase the volume coverage in fMRI studies.
Introduction
Gradient-echo echo-planar imaging (GRE-EPI) has become the method of choice for functional MRI (fMRI) due to its ultrafast acquisition and T2* sensitivity. However, EPI is also noted for its low effective bandwidth along the phase encoding (PE) direction1. One consequence of this low bandwidth is a large apparent spatial shift of the lipids due to the chemical shift between the lipids and water, resulting in artifacts in the image. The shift artifact is commonly removed by prepending an RF pulse to suppress the lipid signal. In this study, we examine the potential to significantly reduce the SAR by circumventing the fat-suppression pulse at 7T. To compensate for the removal of the fat-suppression pulse we implement a reconstruction based on parallel imaging to separate the lipid and water images. By reducing SAR, an EPI scan without fat suppression can offer fMRI studies greater flexibility to shorten the repetition time and/or increase the volume coverage.Methods
Separate lipid and water images can be recovered by considering the acquisition as a simultaneous multi slice (SMS) problem with a built in CAIPIRINHA shift – due to the chemical shift – as was demonstrated in Ref. 2. The substantial lipid-water spatial shift at 7T, for commonly used scan parameters, allows for a reliable separation. In this study we implemented a reconstruction method for three parallel imaging aspects: (i) in-plane PE acceleration, (ii) SMS acceleration, and (iii) lipid-water separation. We used BART3 with L1 norm to reconstruct the final images. The scans in this study were performed on a 7T MAGNETOM Terra (Siemens Healthcare, Erlangen, Germany) using a commercial 1Tx/32Rx head coil (Nova Medical, Wilmington, MA), and a head phantom which includes both a brain-like compartment and a neck + outer layer (skin, lipids, and muscle) compartment4. A set of simulations was performed to examine the effect of the lipid artifact. The simulations were based on brain GRE water and lipid images, shifting the lipid image to match the EPI shift. These images and matching sensitivity maps (generated from the images) were used to reconstruct and simulate an image without Fat Suppression, as well as a water-only image using the fat separation technique. The lipid image was scaled to match the different T2* decay (at the EPI TE) of the lipid and the gray matter (estimated as 12.5±2.5 msec and 24.8±1.4 msec, respectively). An additional analysis on phantom was performed to examine – as a function of the Fat Suppression flip angle – both the lipid artifact strength and the energy contribution of the Fat Suppression pulse. Finally, resting-state fMRI and an fMRI motor-task experiment were repeated to compare both the tSNR and the t-test between Fat Suppression and Fat Separation.Results
Figure 1 shows schematically the equivalence of lipid-water separation (and in analogy also of SMS) to in-plane parallel imaging (e.g. SENSE).Figure 2 shows the dependence of the lipid artifact strength on the phase of the lipid signal in simulations. Without fat suppression the artifact reaches a 23% error. Using “fat separation” a root-mean-square-error (rmse) of less than 1.7% is reached. The simulation also test the effect of shifting the sensitivity maps by one pixel to simulate motion during an fMRI experiment. This increased the lipid error without Fat Suppression to 32%, but the rmse of the water image (after fat separation) only increased to 3.3%.
Figure 3 shows the (relative) strength of the lipid signal as a function of the Fat Suppression flip angle. A lipid signal close to zero was found at ~125°, compared to the sequence’s default flip angle of 110° which contributes ~66% of the total energy (product GRE-EPI). SAR can be reduced by lowering the flip angle. For example, 80° will introduce only ~7% lipid artifact, but will still contribute 60% of the total energy, reducing SAR by only 15%.
Figure 4 gives the g-factor maps for different acceleration factors, demonstrating a local increase at the lipid artifact region.
Figure 5 demonstrates human imaging at two representative slices out of 60, acquired with ×3 in-plane acceleration and ×2 slice acceleration. SAR levels were 97% with fat suppression, but only 33% without. SNR and tSNR were estimated in a resting-state fMRI scenario and demonstrated a respective increase of 30% and 12%-50% upon removal of the fat-suppression pulse.
Figure 6 summarizes the fMRI motor-task study exhibiting improved statistics using Fat Separation: the number of voxels with t-test≥2.4 (p=0.99) increased by ×1.45 in one region and ×1.9 in another.
Discussion
In this study, we demonstrated a method which allows to avoid fat suppression in EPI for 7T brain imaging. This can reduce the GRE-EPI SAR to less than a half. A robust reconstruction based on SMS-like parallel imaging was demonstrated to separate the water and lipid images. fMRI scans at 7T can benefit extensively from this SAR reduction. However, the fat separation method eventually competes for the limited resources available (multi-channel information) used to accelerate the acquisition. Further research is required to optimize the FOV shift chosen for CAIPIRINHA when combined with lipid-water separation.Acknowledgements
No acknowledgement found.References
[1] Schmitt, F.et al., (1998) Springer Berlin Heidelberg, [2] Uecker M, Lustig M. Proc. Intl. Soc. Mag. Reson. Med. 20 (2012), 2490. [3] https://mrirecon.github.io/bart, [4] Jona et. al, NMR BioMed 2020.Figures
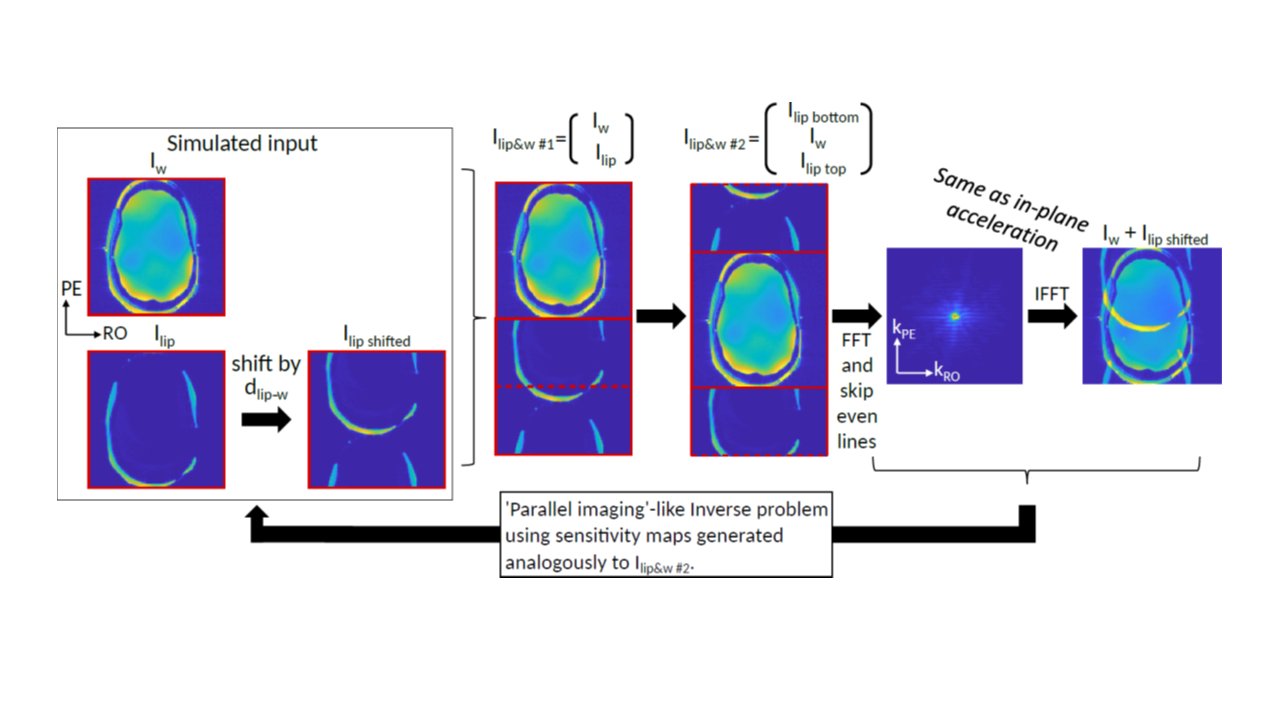
Figure 1: Extended
formulation unifying three parallel imaging aspects:
(i) in-plane PE acceleration, (ii) SMS acceleration and (iii)
lipid-water separation. The steps show how an EPI image (far right) is
equivalent to an SMS of water and lipid “slices” (Iw and Ilip) and to an in-plane PE acceleration (Ilip&w #2 vs. Iw+Ilip shifted). The formulation can be extended
to any number of slices and fat/water images.
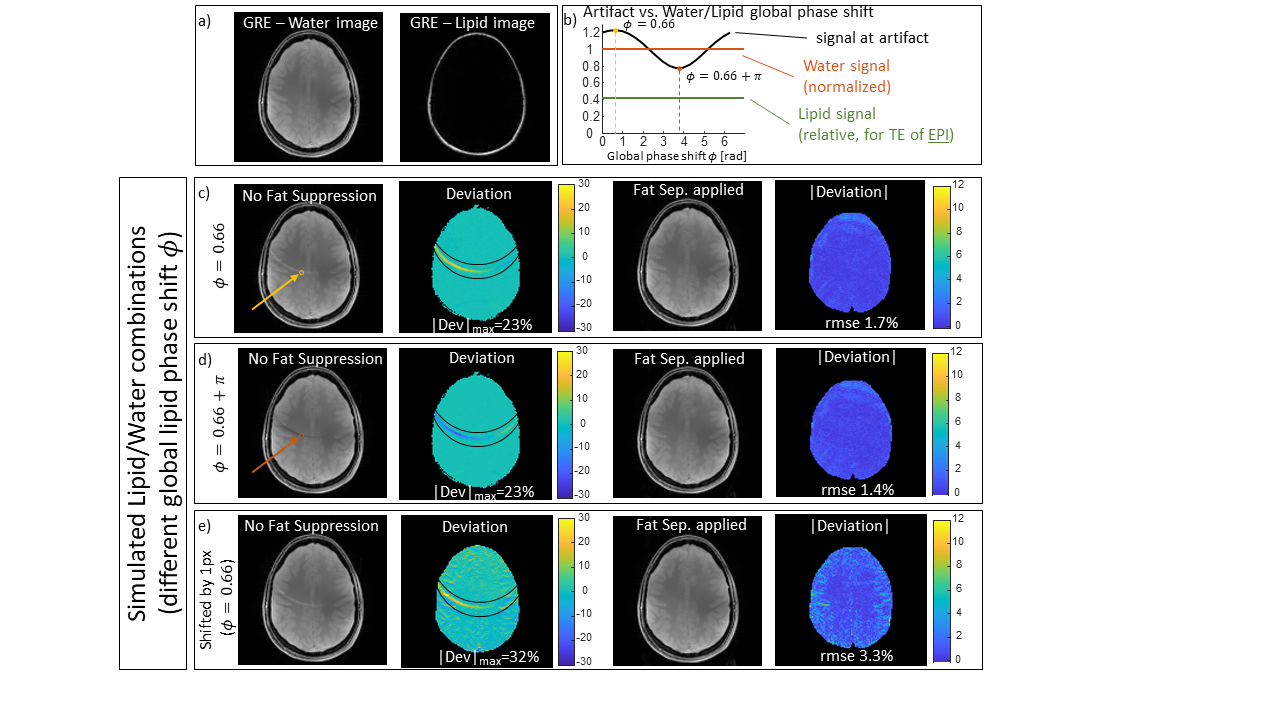
Figure 2: Simulated Lipid/Water combined signals. a) GRE water and lipid source images for “EPI” image. b) Artifact strength (at marked point) vs. lipid image phase. c) Simulated results for φ=0.66 rad, d) simulated results for φ=0.66+π rad, e) simulated results for φ=0.66 rad + a one pixel shift up (relative to sensitivity maps). The images from left to right: image without Fat Suppression, the resulting deviation from the water reference image, the water image reconstructed by the fat-water separation formalism, and the resulting absolute deviation from the water reference image.
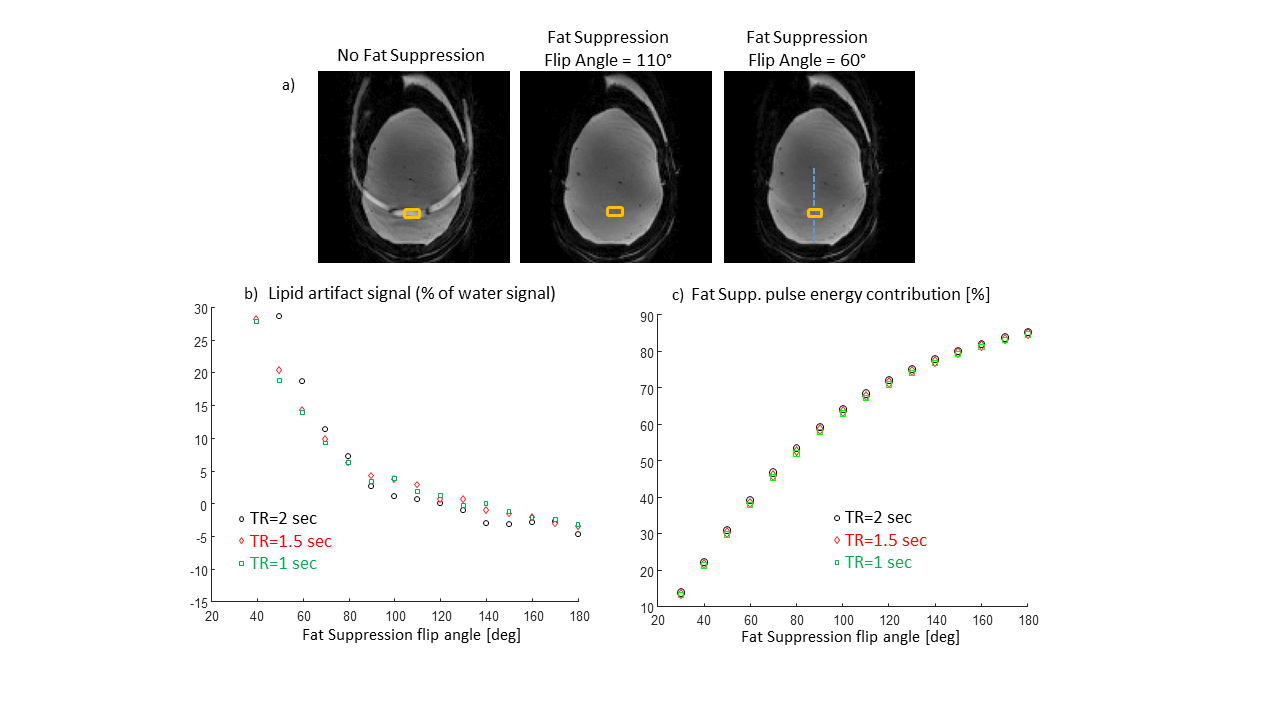
Figure
3: Effect of the Fat Suppression pulse flip angle. a) Examples of images without Fat
Suppression and with Fat Suppression applying different flip angles. b) The
lipid artifact magnitude (relative to the water signal) as a function of the
flip angle of the Fat Suppression pulse. c) The Fat Suppression pulse energy
contribution relative to the total energy of the pulse-sequence.
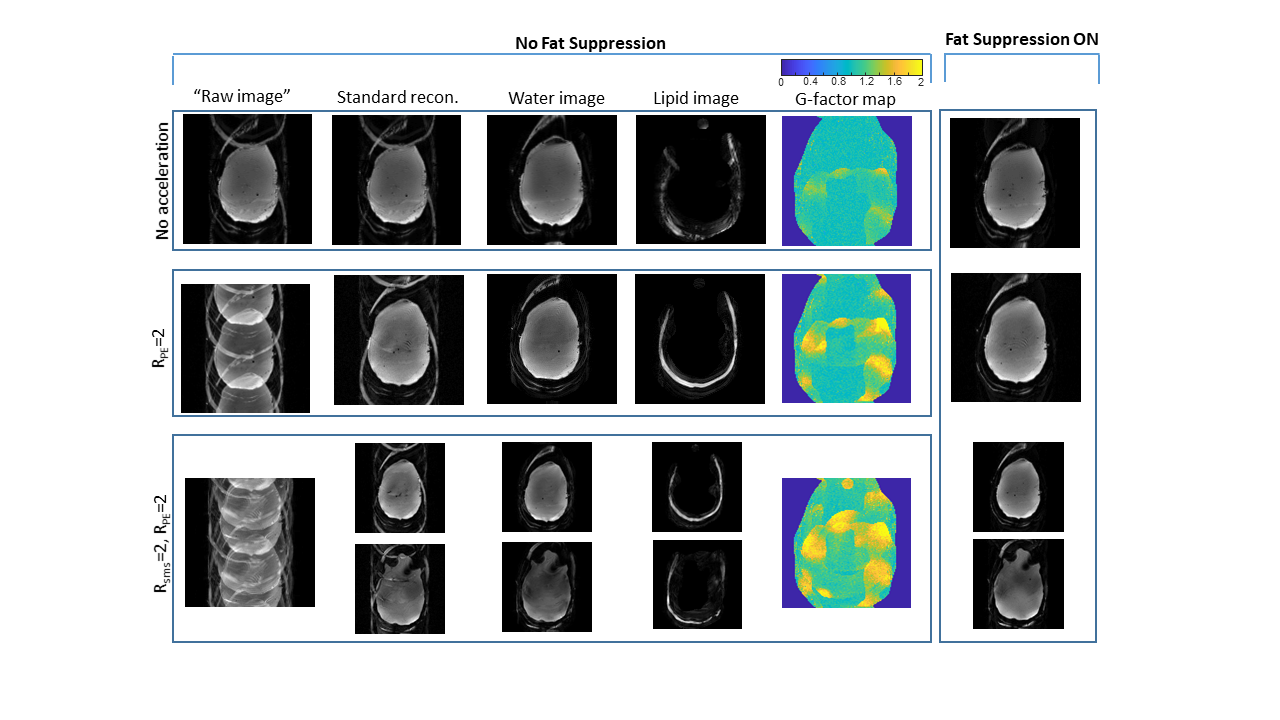
Figure
4:
Phantom scanning – combining in-plane acceleration, SMS, and lipid-water
separation. Top to bottom: Rtot=2 no acceleration (Lipid/Water
separation); Rtot=4 (Lipid/Water, RPE =2); and Rtot=8 (Lipid/Water,
RPE =2, Rsms=2). Left to right:
“raw image” (FFT applied directly to the acquired signal); “standard recon.”
(Siemens product reconstruction); images reconstructed with the extended fat
separation formulation - separate water and lipid images; g-factor maps for the
slice common to all cases; and the image acquired with fat suppression, for
reference.
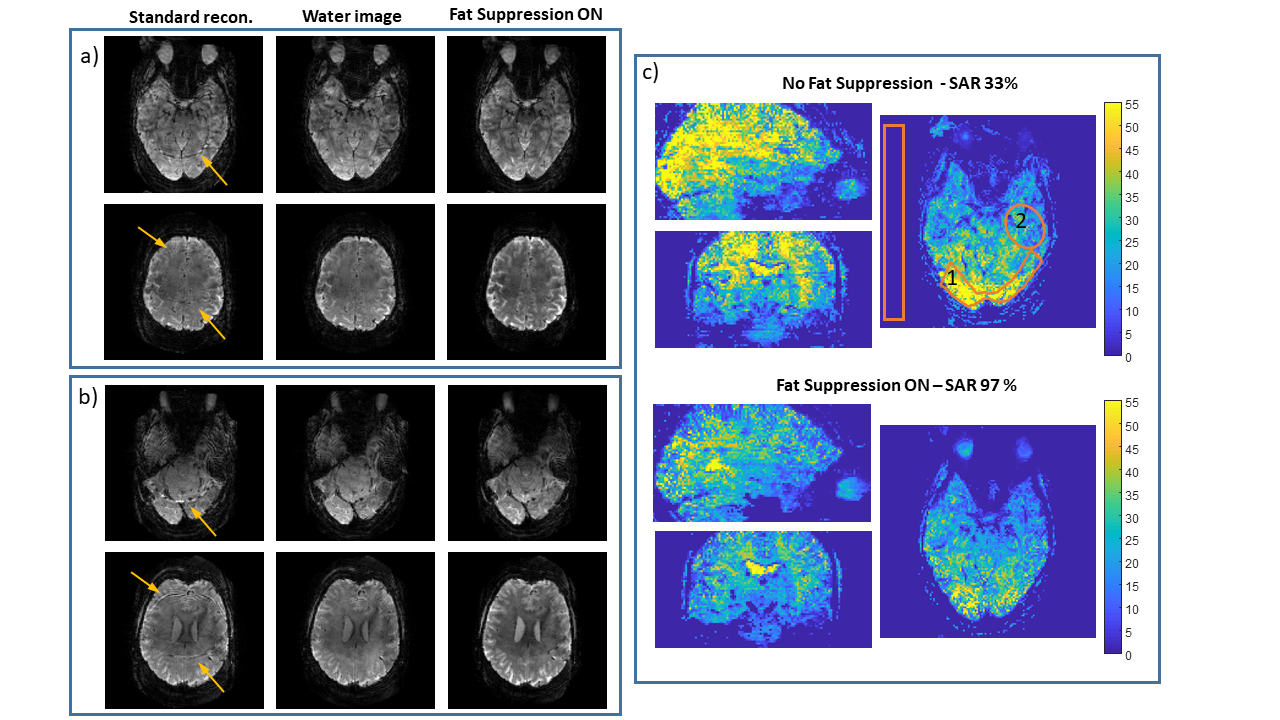
Figure 5: Resting-state fMRI. a),b) Examples of simultaneously acquired slices. Left to right: standard reconstruction, water image after lipid separation, and a fat suppressed image. Arrows mark artifacts from the lipids. (c) tSNR on three orthogonal planes. SNR and tSNR in main text where estimated from marked regions. SAR was 33% without fat-suppression and 97% with fat-suppression (reference amplitude of 240 V for a 1 ms 180° hard pulse). Scan parameters: in-plane accelerations ×3, SMS ×2, FOV=220×220 mm2, resolution = 1.7×1.7 mm2, slice thickness = 1.7 mm, TR/TE = 1500/22 ms.
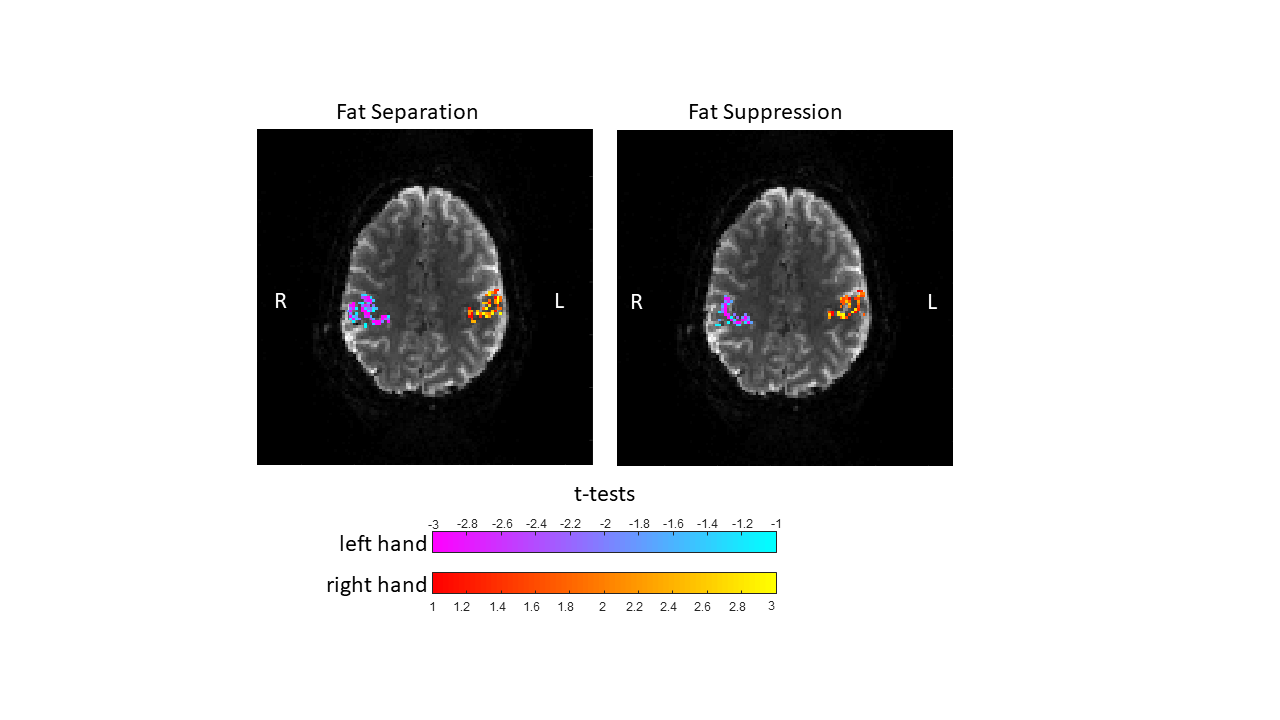
Figure 6: fMRI motor-task experiment – comparison of the
t-test results between Fat Separation and Fat Suppression cases. The t-test
overlay is shown on top of the representing slice (the left hand t-test with
“autumn” colormap and the right hand with “cool” colormap). The fMRI experiment
included 17 right hand and 17 left hand blocks of finger tapping with total
scan time of 4 minutes. The block durations were randomized, resulting in 12±3
sec block durations.