0889
3D choline metabolite imaging in the liver by MRSI with selective excitation using spectral-spatial RF pulses at 7T1Radiology Department, UMC Utrecht, Utrecht, Netherlands
Synopsis
MR measurement of increased concentrations of choline containing compounds (tCho) in the liver could be used as a non-invasive tumor tissue biomarker. However, 3D 1H-MRSI with conventional water suppression and volume selection does not yield the sensitivity gain expected at higher fields like 7T. As a result, it cannot be performed in clinically feasible scan times with full coverage of the liver and at sufficient spatial resolution to detect tumor metastases. With spectral-spatial pulses, it is possible to spatially map tCho much faster and at higher SNR than with conventional MRSI, with excellent suppression of both water and lipid signals.
Introduction
To assess the effectiveness of tumor treatment, a biomarker is required which is indicative for the presence of viable tumor tissue and/or tumor growth. In the liver, increased concentrations of choline containing compounds (tCho) could potentially be used as a tumor tissue biomarker [1]–[3]. The use of high-field MR realizes a gain in sensitivity, allowing tCho concentrations to be spatially mapped with 3D 1H-MR spectroscopic imaging (MRSI) [4], potentially in very short scan times. However, using conventional water suppression the large lipid signals in the liver are not suppressed. Moreover, volume preselection techniques generally used in MRSI (STEAM/PRESS/etc.) come with high RF power deposition, and constrain the TE and TR, which is suboptimal for SNR efficiency. Here we propose a two-dimensional spectral-spatial (SPSP) excitation pulse to selectively excite spins at the Ernst angle within a narrow spectral frequency range around the tCho resonance and within a transversal slice in the liver, to suppress unwanted signals from water and lipids, and to avoid artefacts resulting from B0 inhomogeneities outside of the liver (e.g. in lungs and bowels). The aim was to reliably map tCho in the liver with 3D 1H-MRSI with maximum sensitivity.Methods
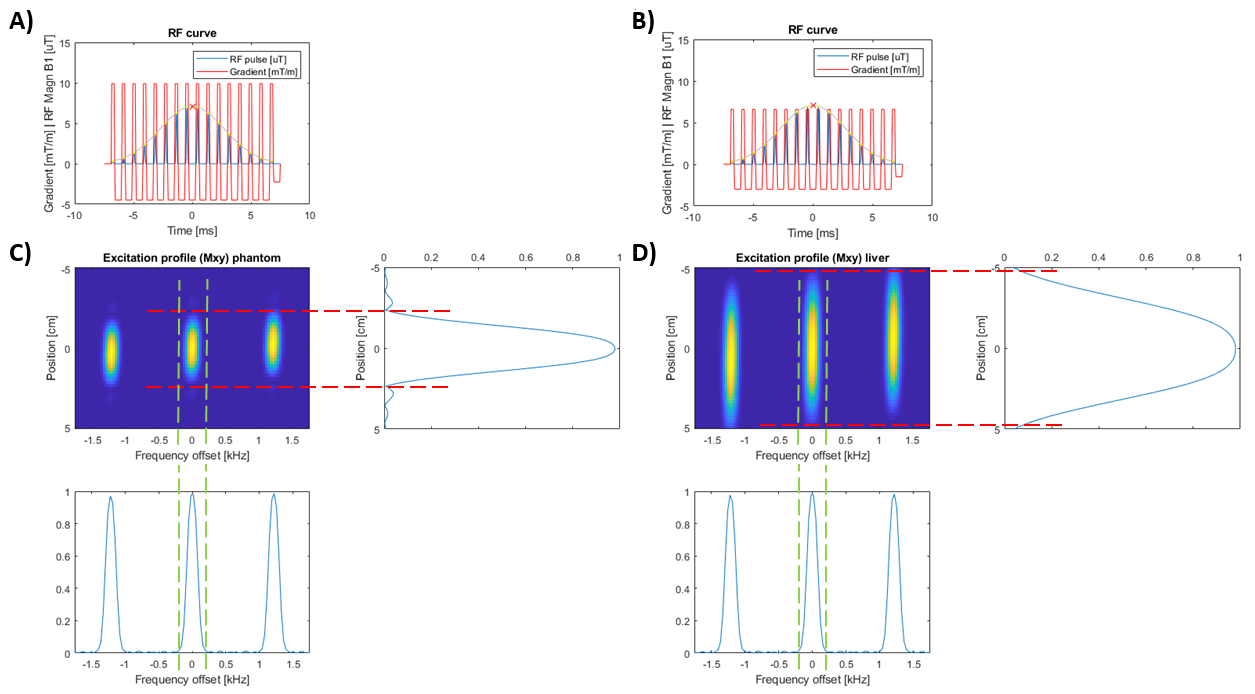
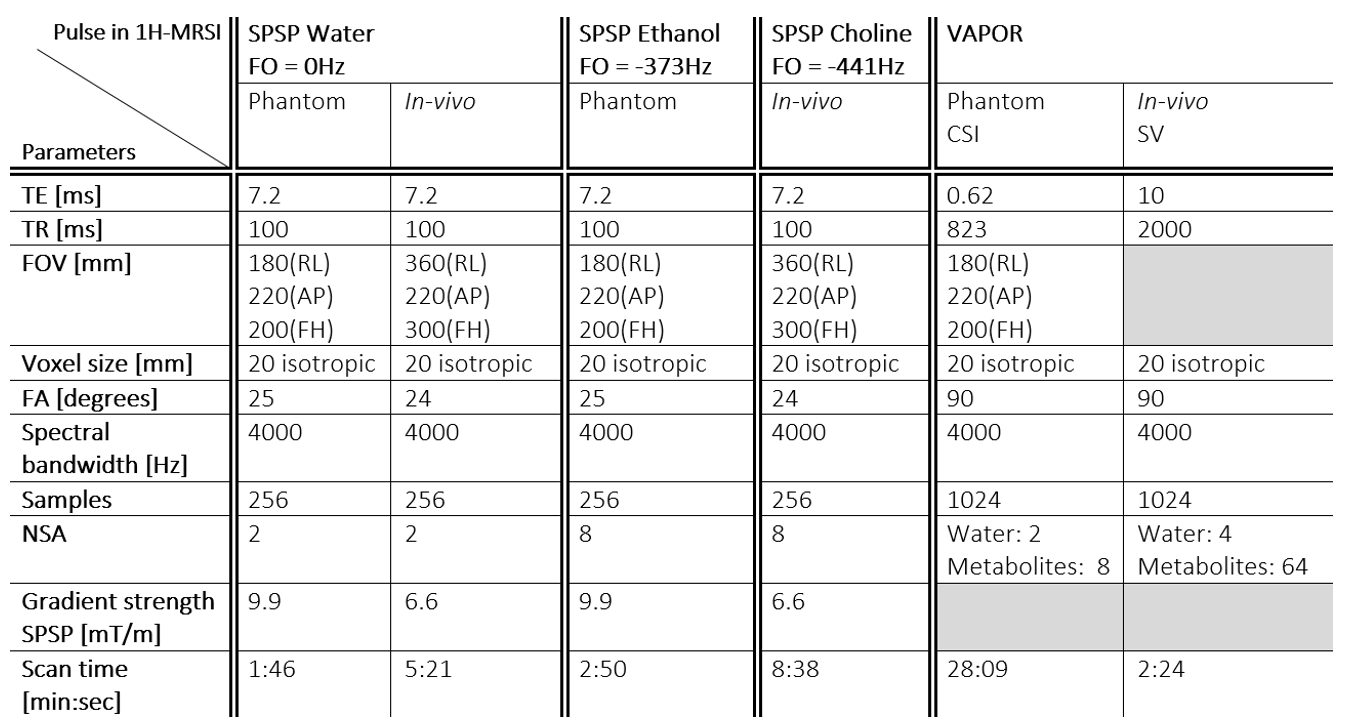
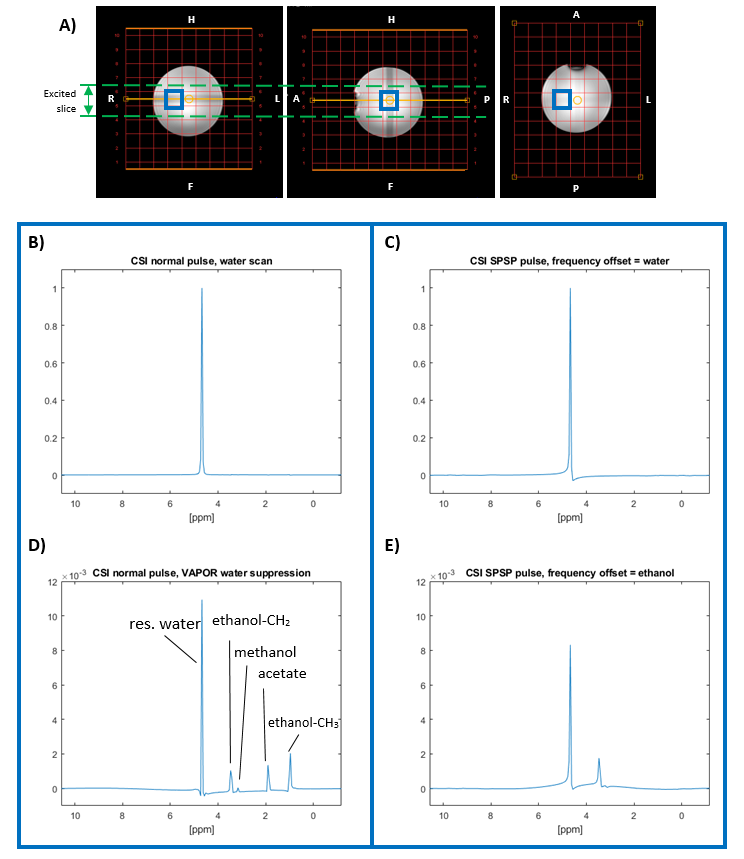
Simulations were performed for 2D SPSP pulses using Bloch equations (PulseWizard; Matlab R2019a, MathWorks, Natrick, Massachusetts). The designed SPSP pulse (16 subpulses of 0.2ms, with 0.7ms spacing) has a Gaussian shaped amplitude profile in the spectral as well as in the spatial dimension (Figure 1A/B). A whole-body 7T MR scanner equipped with a multi-transmit RF system (Achieva, Philips Healthcare, Best, Netherlands) was used to acquire 3D 1H-MRSI in a phantom and two healthy volunteers. For the phantom measurement, we used an 8-channel transmit, quadrature head coil with 32-channel receive (NOVA Medical, Houston, Texas, USA) with scanning parameters shown in Figure 2. The spherical phantom contains ethanol (1.6%), acetate, and methanol in arquad solution with CuSO4. The frequency offset of the SPSP pulse in the 1H-MRSI scans was set at the water frequency (0Hz) and at the ethanol-CH2 frequency (-373Hz), and a transversal slice was selected. 1H-MRSI scans with SPSP pulses were compared with conventional 1H-MRSI with and without VAPOR water suppression (Figure 2). For the in-vivo measurements, eight transceiver fractionated dipole antennas with 16 additional receive loops were positioned symmetrically around the body at the position of the liver [5]. SPSP 1H-MRSI scans were performed at the water (0Hz) and tCho (-441Hz) frequency, with transversal slice selection (Figure 2). In addition, a single-voxel measurement with VAPOR water suppression was performed. For all measurements, RF phase and B0 shimming were performed in the region of interest and in-vivo measurements were performed with free breathing. The channels were combined using the WSVD method [6].Results
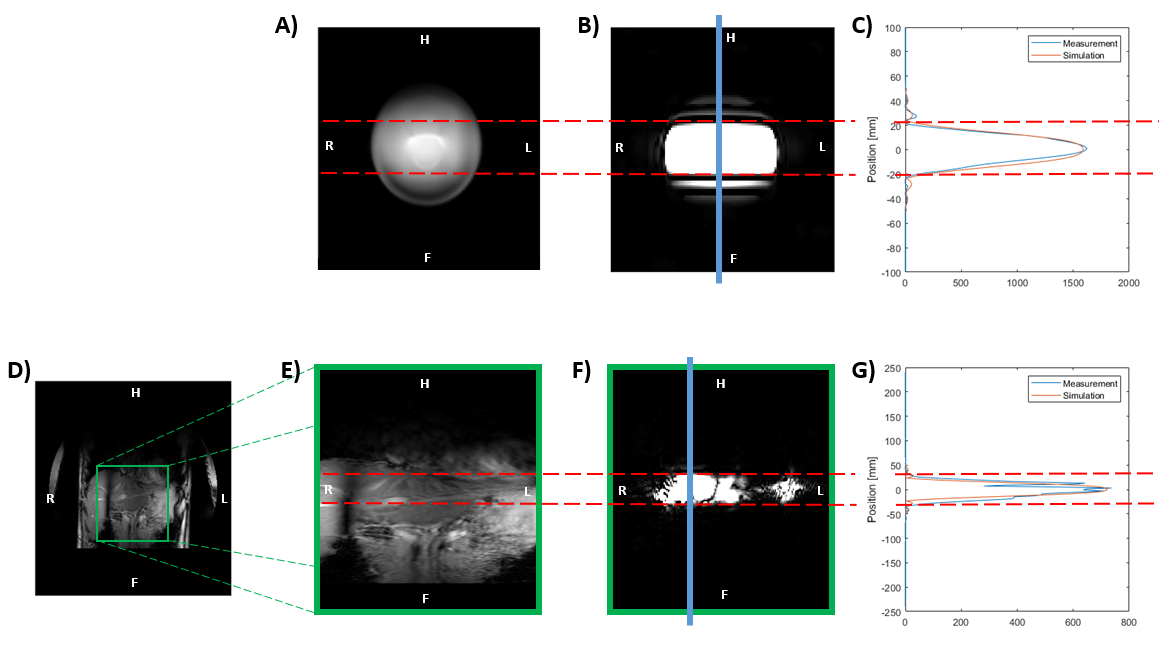
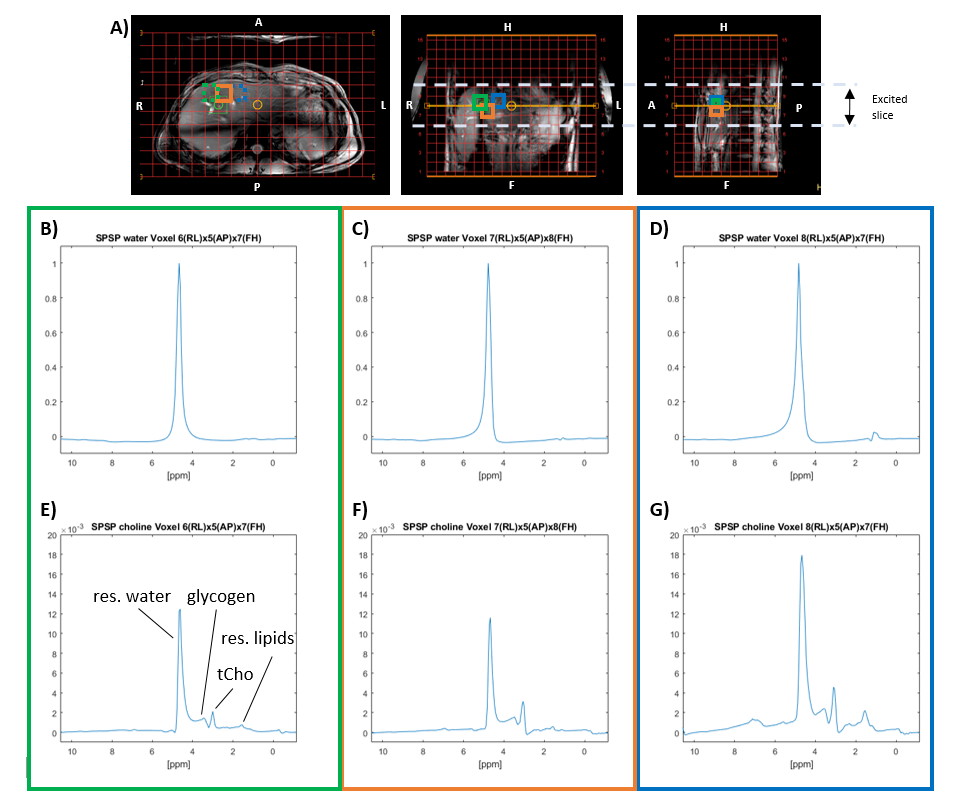
The Bloch simulations (Figure 1) predicted a spectral bandwidth of ~0.37kHz, and a slice thickness of ~4cm/~8cm for the SPSP pulse used in the phantom/liver. The measured slice profiles and positions were in good agreement with the simulation, both for the phantom and in-vivo (Figure 3). For the 1H-MRSI SPSP measurement in the phantom with the offset set to the ethanol-CH2 frequency, all metabolite signals other than the ethanol-CH2, methanol and some residual water signal were effectively suppressed (Figure 4). Using the SPSP pulse, water suppression was in fact better as compared with VAPOR water suppression (Figure 4). The ethanol/water peak intensity ratios were similar (~1.0×10⁻³) for the conventional 1H-MRSI and the SPSP measurements. In-vivo 1H-MRSI SPSP measurements with the offset set to the tCho frequency showed excellent water suppression (50- to 75-fold) and lipid suppression, and a well-resolved tCho signal (Figure 5). The tCho/water peak intensity ratio was ~4.6×10⁻³ and ~1.2×10⁻³ for the two volunteers, respectively. In comparison, the tCho/water ratio in the single-voxel STEAM spectra was ~0.6×10⁻³.Discussion and Conclusion
We showed that both for phantom and in-vivo liver measurements, the performance of the SPSP pulses in the spatial as well as in the spectral domain was in excellent agreement with the Bloch simulations. Care was taken that the spectral sidebands of the SPSP pulse (Figure 1C/D) fall outside of the spectral region of interest and do not excite unwanted resonances. When the offset of the SPSP pulse was set to the ethanol/tCho frequency, this resulted in excellent water and lipid suppression and the signal of interest was well resolved. Differences in tCho/water ratio between the 1H-MRSI and single-voxel measurements may indicate a higher contribution of short-T2 components, such as taurine, in 1H-MRSI with shorter TE, but interpretation needs a more careful analysis with fitting and T1 and T2 corrections. With the proposed technique, it is possible to spatially map tCho (or another tumor marker) much faster than with a conventional 3D 1H-MRSI sequence with water suppression, because the repetition time can be kept short and sensitivity is maximized. Moreover, as SNR is very high, acceleration techniques like EPI and SENSE can be applied to either facilitate very short scans or increase spatial resolution. In conclusion, 1H-MRSI with the designed SPSP pulse allows capturing detailed metabolic information with full 3D liver coverage at 7T.Acknowledgements
H2020-FETopen:NICIReferences
[1] K. Glunde, C. Jie, and Z. M. Bhujwalla, “Molecular Causes of the Aberrant Choline Phospholipid Metabolism in Breast Cancer,” Cancer Res., vol. 64, pp. 4270–4276, 2004.
[2] K. Glunde, E. Ackerstaff, N. Mori, M. A. Jacobs, and Bhuj, “Choline Phospholipd Metabolism in Cancer: Consequences for Molecular Pharmaceutical Interventions,” Mol. Pharm., vol. 3, no. 5, pp. 496–506, 2006.
[3] H. J. Shin, H.-M. Baek, J. H. Cha, and H. H. Kim, “Evaluation of Breast Cancer Using Proton MR Spectroscopy: Total Choline Peak Integral and Signal-to-Noise Ratio as Prognostic Indicator,” Am. J. Roentgenol., vol. 198, no. 5, pp. W488–W497, 2012.
[4] R. Otazo, B. Mueller, K. Ugurbil, L. Wald, and S. Posse, “Signal-to-Noise Ratio and Spectral Linewidth Improvements Between 1.5 and 7 Tesla in Proton Echo-Planar Spectroscopic Imaging,” Magn. Reson. Med., vol. 56, pp. 1200–1210, 2006.
[5] B. R. Steensma et al., “An 8-channel Tx Rx dipole array combined with 16 Rx loops for high-resolution functional cardiac imaging at 7 T,” Magn. Reson. Mater. Physics, Biol. Med., vol. 31, pp. 7–18, 2018.
[6] C. T. Rodgers and M. D. Robson, “Receive array magnetic resonance spectroscopy: Whitened singular value decomposition (WSVD) gives optimal Bayesian solution,” Magn. Reson. Med., vol. 63, no. 4, pp. 881–891, 2010.
Figures