0881
Fast $$$T_{2}^{*}$$$ Mapping Using Complementary Poisson Disk Sampling and ADMM Reconstruction1Electrical and Computer Engineering, University of Arizona, Tucson, AZ, United States, 2Microsoft Research, Redmond, WA, United States, 3Department of Medical Imaging, University of Arizona, Tucson, AZ, United States
Synopsis
Using Complementary Poisson Disk (CPD) sampling, we accelerate multi-echo gradient recalled echo acquisitions (ME GRE) by efficiently undersampling k-space in such a way that lends itself to practically realizable sampling trajectories. We reconstruct $$$T_{2}^{*}$$$ maps from these undersampled acquisitions and validate against fully sampled data.
Introduction
$$$T_{2}^{*}$$$ and quantitative susceptibility mapping are increasingly employed clinically for their diagnostic utility. They have been applied to the analysis of iron deposition in brain tissue as a potential indicator of Parkinson's disease1,2 , as a means of hemorrhage detection3,4 , and has shown promise in identifying age-related biomarkers of neurodegeneration5-7. Three dimensional (3D) multi-echo gradient-recalled echo (ME GRE) MRI sequences are typically used as the basis for $$$T_{2}^{*}$$$ mapping. However, acquiring high resolution 3D ME GRE data requires undesirably long scan times, particularly at high spatial resolution ($$$< 1$$$mm$$$^{3}$$$ ). Thus, acquisition methods that reduce scan times while preserving the quality of reconstructed parameter maps are of significant clinical value. In this work, we propose the use of a novel Complementary Poisson Disk8 (CPD) strategy that allows for k-space to be undersampled incoherently and sparsely as required for compressed sensing (CS) -based reconstruction while simultaneous ensuring practical implementation, by prohibiting large k-space jumps that could induce eddy current artifacts.Methods
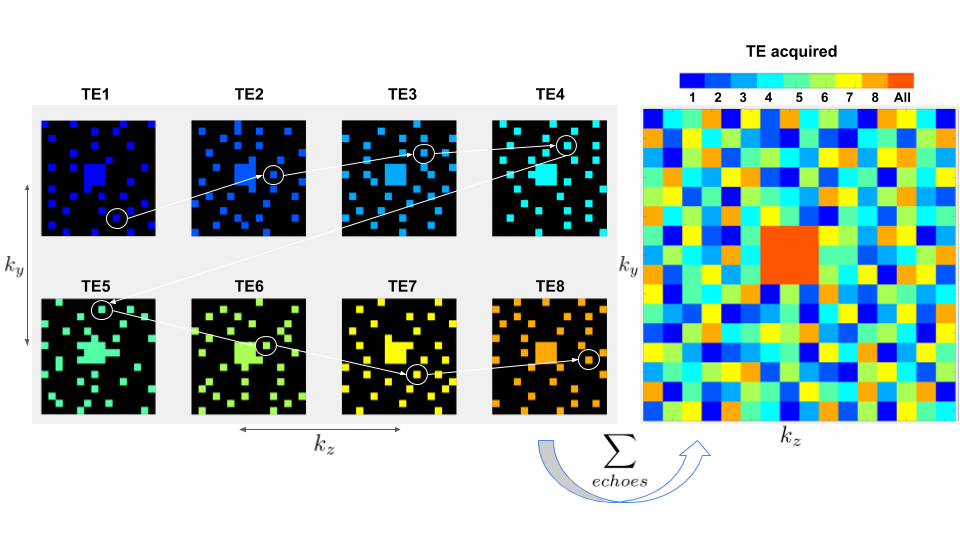
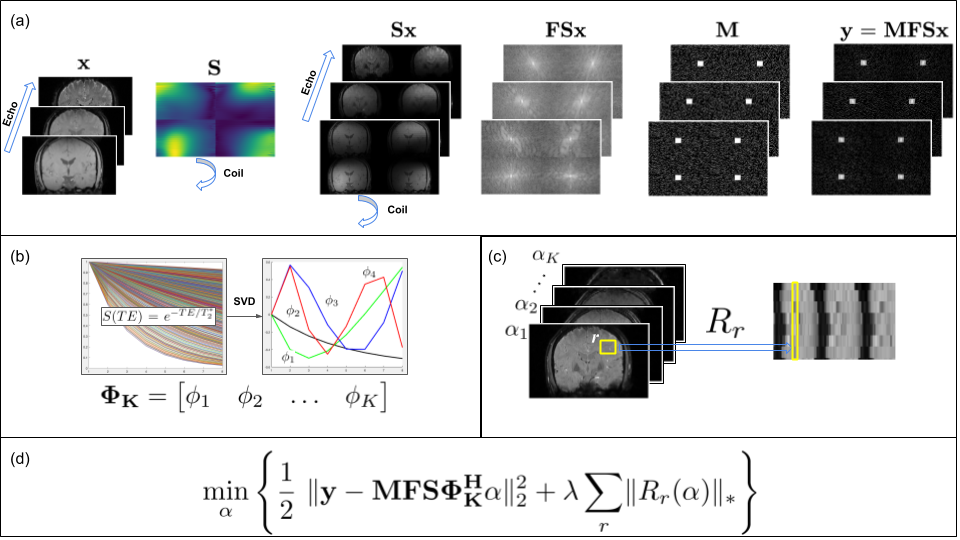
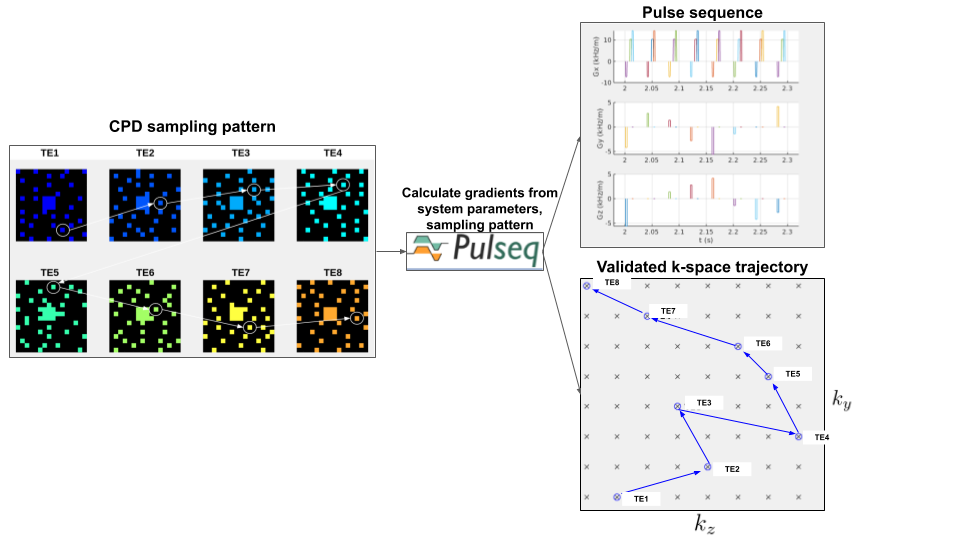
CPD was developed to simultaneously satisfy the requirements of CS and view sharing (VS). CPD satisfies relaxed minimum sample distance requirements (like Poisson Disk sampling) with the added benefit of sampling every $$$(k_{y},k_{z})$$$ point at exactly one echo as shown in Figure 1. We used CPD to generate complementary sampling patterns, then created sampling trajectories from these patterns designed to minimize k-space displacement between echoes. This will allow for practical implementation, as these minimal displacements can be realized by blipped gradients in $$$y$$$ and $$$z$$$ in between multi-echo readouts.A fully-sampled ME GRE acquisition from the Cornell QSM study9 was used for retrospective undersampling: Siemens 3T scanner, TE 5.91 ms, 24cm FOV, ETL 8, 0.94 x 0.94 x 2.0 mm voxel size. A sampling mask generated via CPD was designed to sample each $$$(k_{y},k_{z})$$$ point at exactly one echo, save for a rectangular patch at the center of k-space which was fully sampled at every echo (Figure 1). The sampling pattern was replicated across x to simulate full sampling along the readout dimension. To create a retrospectively undersampled k-space array $$$\mathbf{y}$$$, the time domain images $$$\mathbf{x}$$$ were multiplied by the coil sensitivities, Fourier transformed, and subsequently sampled: $$$\mathbf{y} = \mathbf{M}\mathbf{F}\mathbf{S}\mathbf{x}$$$, where $$$\mathbf{S}$$$ is the channel-wise application of coil sensitivities to each time domain image, $$$\mathbf{F}$$$ is the forward Fourier Transform operator, and $$$\mathbf{M}$$$ is the sampling mask applied to the $$$k-t-channel$$$ data array (Figure 2a). Simulated signal evolutions from a monoexponential decay model were employed to derive a temporal subspace basis (Figure 2b). The principal components of the signal ensemble were calculated by Singular Value Decomposition and the $$$K = 4$$$ principal components with the largest singular values were selected to form the temporal subspace basis. The reconstruction objective function was then formulated as
$$\min_{\alpha} \Bigg \{ \frac{1}{2}\ \lVert \mathbf{y} - \mathbf{M}\mathbf{F}\mathbf{S}\mathbf{\Phi^{H}_{K}}\alpha \rVert^{2}_{2} + \lambda\sum_{r} \lVert R_{r}(\alpha) \rVert_{*} \Bigg \}$$
where $$$\mathbf{\Phi^{H}_{K}}\alpha$$$ is the projection of the principal component coefficient image $$$\alpha$$$ into the TE image domain via the truncated subspace basis $$$\mathbf{\Phi^{H}_{K}}$$$. A locally low-rank regularization method (Figure 2c) was used to further exploit local redundancies in the $$$\alpha$$$ images. Thus, the objective function was posed to optimize for $$$\alpha$$$ by weighting data fidelity against coefficient image local sparsity. Reconstruction was performed iteratively via ADMM in a modified version of the BART Toolbox10 to obtain reconstructed images at each TE. $$$M_{0}$$$ and $$$T_{2}^{*}$$$ were computed from reconstructed temporal signal evolutions and true TE images using least squares estimation.
Results
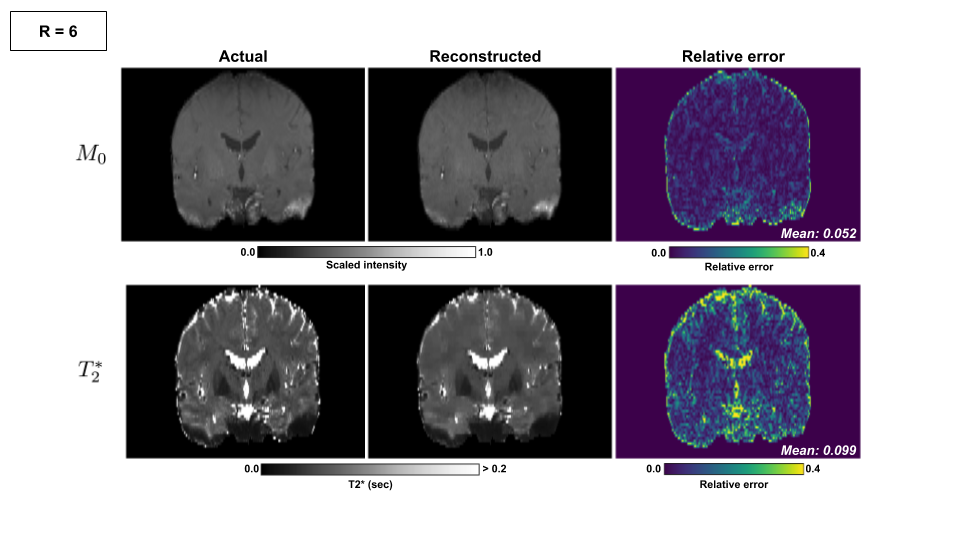
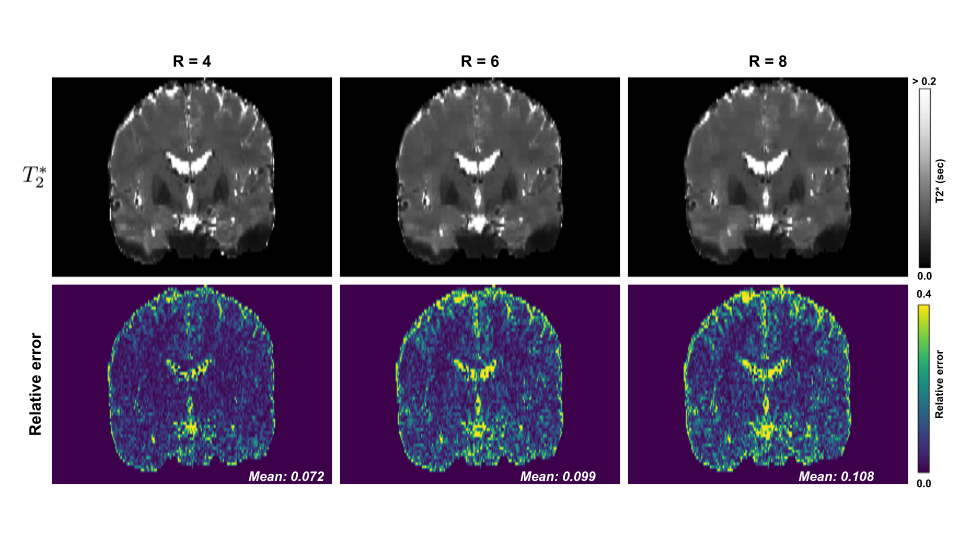
Mean absolute relative error $$$\bar{e}$$$ was computed between true and estimated $$$T_{2}^{*}$$$ across all brain voxels: $$$\bar{e} = \frac{1}{N} \sum{\frac{\lvert \hat{T_{2}^{*}} - T_{2}^{*}\rvert}{T_{2}^{*}}}$$$. Figure 3 shows reconstructed $$$M_{0}$$$ and $$$T_{2}^{*}$$$ images for an acceleration ratio of $$$R = 6$$$ versus corresponding images from the fully sampled dataset. $$$M_{0}$$$ mean absolute relative errors for $$$R = 4, 6,$$$ and $$$8$$$ were $$$0.075, 0.052, 0.151$$$, (resp.), while $$$T_{2}^{*}$$$ errors were $$$0.072, 0.099,$$$ and $$$0.108$$$. Performance was best for acceleration ratios of $$$R = 4$$$ and $$$6$$$, while $$$M_{0}$$$ quality in particular declined between $$$R = 6$$$ and $$$8$$$. Most of the larger $$$T_{2}^{*}$$$ errors were confined to regions bordering or containing cerebrospinal fluid (CSF), as illustrated in the periphery of the brain and in the lateral, third, and fourth ventricles in figures 3-4. With $$$T_{2}^{*}$$$ errors sufficiently low in gray matter regions of interest such as the subthalamic nuclei for $$$R = 4$$$ and $$$6$$$, this method shows promise as a means of accelerating image acquisition while preserving quantitative accuracy. To test the feasibility of practical implementation, Pulseq11 was used. Figure 5 shows the pulse sequence diagram for a CPD scheme. Note the small blips in y and z during the readout. CPD ensures these blips are small for both minimizing eddy currents and not prolonging the echo-spacing.Conclusion
We have successfully demonstrated proof of concept of a novel means of accelerating $$$T_{2}^{*}$$$ mapping via CPD-based undersampling and ADMM reconstruction. Parameter estimates from reconstructed images exhibit excellent performance even at $$$R=6$$$ and acceptable performance at $$$R=8$$$.Acknowledgements
No acknowledgement found.References
1. Naying He, Pei Huang, Huawei Ling, Jason Langley, Chunlei Liu, Bei Ding, Juan Huang, Hongmin Xu, Yong Zhang, Zhongping Zhang, et al., “Den- tate nucleus iron deposition is a potential biomarker for tremor-dominant parkinson’s disease,” NMR in Biomedicine, vol. 30, no. 4, pp. e3554, 2017.
2. Qiqi Chen, Yiting Chen, Yue Zhang, Furu Wang, Hongchang Yu, Caiyuan Zhang, Zhen Jiang, and Weifeng Luo, “Iron deposition in parkinson’s disease by quantitative susceptibility mapping,” BMC neuroscience, vol. 20, no. 1, pp. 1–8, 2019.
3. Franz Fazekas, Reinhold Kleinert, Gudrun Roob, Gertrude Kleinert, Pe- ter Kapeller, Reinhold Schmidt, and Hans-Peter Hartung, “Histopatho- logic analysis of foci of signal loss on gradient-echo t2*-weighted mr im- ages in patients with spontaneous intracerebral hemorrhage: evidence of microangiopathy-related microbleeds,” American Journal of Neuroradiol- ogy, vol. 20, no. 4, pp. 637–642, 1999.
4. Mohammad I Zia, Nilesh R Ghugre, Kim A Connelly, Bradley H Strauss, John D Sparkes, Alexander J Dick, and Graham A Wright, “Characterizing myocardial edema and hemorrhage using quantitative t2 and t2* mapping 3 at multiple time intervals post st-segment elevation myocardial infarction,” Circulation: Cardiovascular Imaging, vol. 5, no. 5, pp. 566–572, 2012.
5. Alisdair McNeill, D Birchall, SJ Hayflick, Allison Gregory, JF Schenk, EA Zimmerman, H Shang, H Miyajima, and PF Chinnery, “T2* and fse mri distinguishes four subtypes of neurodegeneration with brain iron accumulation,” Neurology, vol. 70, no. 18, pp. 1614–1619, 2008.
6. Domenico Aquino, Alberto Bizzi, Marina Grisoli, Barbara Garavaglia, Maria Grazia Bruzzone, Nardo Nardocci, Mario Savoiardo, and Luisa Chi- apparini, “Age-related iron deposition in the basal ganglia: quantitative analysis in healthy subjects,” Radiology, vol. 252, no. 1, pp. 165–172, 2009.
7. Martina F Callaghan, Patrick Freund, Bogdan Draganski, Elaine An- derson, Marinella Cappelletti, Rumana Chowdhury, Joern Diedrich- sen, Thomas HB FitzGerald, Peter Smittenaar, Gunther Helms, et al., “Widespread age-related differences in the human brain microstructure re- vealed by quantitative magnetic resonance imaging,” Neurobiology of aging, vol. 35, no. 8, pp. 1862–1872, 2014.
8. Evan Levine, Bruce Daniel, Shreyas Vasanawala, Brian Hargreaves, and Manojkumar Saranathan, “3d cartesian mri with compressed sensing and variable view sharing using complementary poisson-disc sampling,” Mag- netic resonance in medicine, vol. 77, no. 5, pp. 1774–1785, 2017.
9. Yi Wang and Tian Liu, “Quantitative susceptibility mapping (qsm): de- coding mri data for a tissue magnetic biomarker,” Magnetic resonance in medicine, vol. 73, no. 1, pp. 82–101, 2015.
10. Jonathan I Tamir, Martin Uecker, Weitian Chen, Peng Lai, Marcus T Alley, Shreyas S Vasanawala, and Michael Lustig, “T2 shuffling: sharp, multicontrast, volumetric fast spin-echo imaging,” Magnetic resonance in medicine, vol. 77, no. 1, pp. 180–195, 2017.
11. Kelvin J Layton, Stefan Kroboth, Feng Jia, Sebastian Littin, Huijun Yu, Jochen Leupold, Jon-Fredrik Nielsen, Tony St ̈ocker, and Maxim Zaitsev, “Pulseq: a rapid and hardware-independent pulse sequence prototyping framework,” Magnetic resonance in medicine, vol. 77, no. 4, pp. 1544– 1552, 2017.
Figures