0878
Clinical Research of Multi-modal MRI in Ischemic Stroke: Cerebral Oxygen Extraction Fraction, Nonblood Susceptibility and Blood Flow1Radiology, Tongji Hospital, Tongji Medical College, Huazhong University of Science and Technology, Wuhan, Hubei, China, 2MR Research, GE Healthcare, Beijing, China, Beijing, China
Synopsis
This study aims to investigate oxygen metabolic, neuroinflammatory and hemodynamic parameters in different parts of the ischemic stroke lesions using multi-modal MRI. Significant difference of cerebral blood flow (CBF) was found between patients with and without penumbra. The oxygen extraction fraction (OEF) and nonblood susceptibility of tissue in the penumbra were significantly different from ischemic core, revealing benign oxygen metabolic compensation and less neuroinflammation in the penumbra. OEF in the diffusion lesion was positively correlated with clinical severity and continuously decreased with time. Multi-modal MRI-based markers can accurately reflect the pathophysiologic discrepancy in different regions of the ischemic stroke lesions.
Introduction
Ischemic stroke is one of the leading causes of disability and mortality with complex pathophysiology worldwide. The tissue outcomes after ischemic stroke were determined by synergistic effects of hemodynamics, oxygen metabolism, neuroinflammation, etc. In the present study, we aim to assess these factors with multi-modal MRI in different parts of ischemic stroke lesions and explore their correlations with clinical severity.Materials and methods
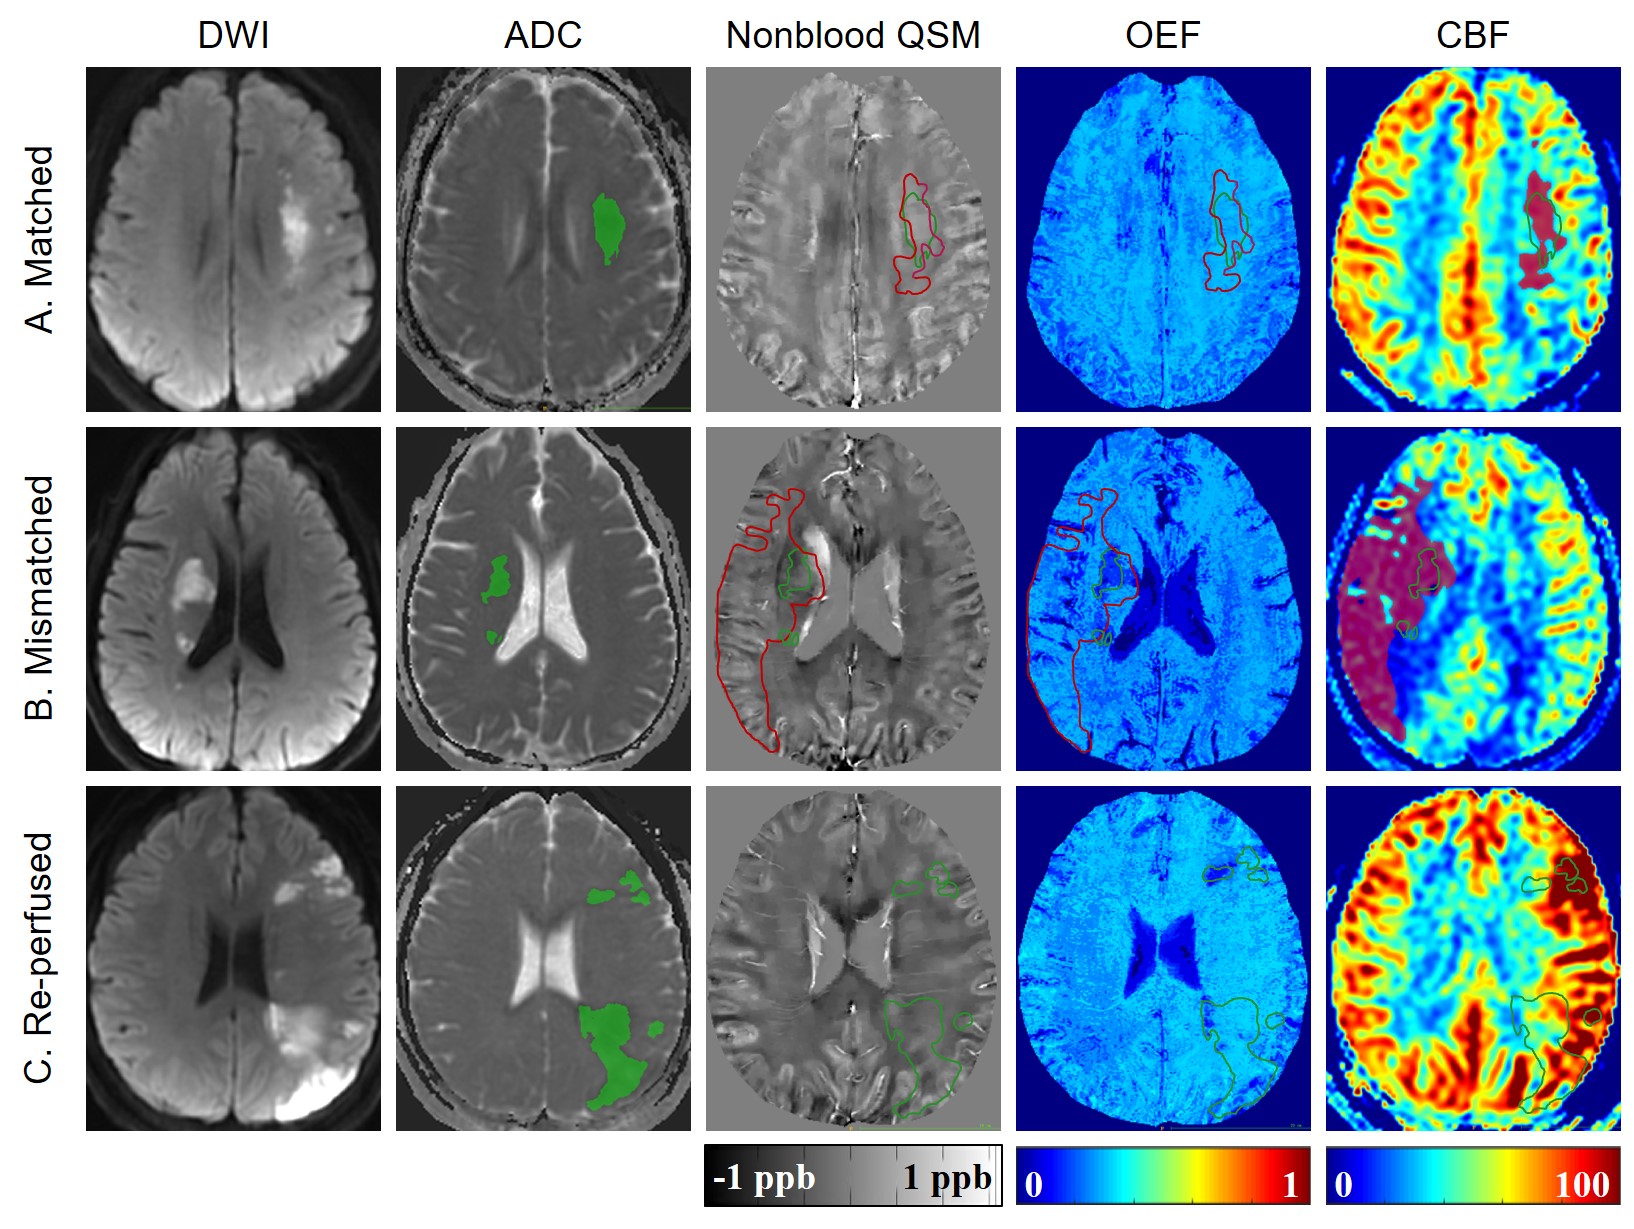
Patients: With approval of the local Institutional Review Board, 28 patients (25 males, 33–72 years) diagnosed with first-ever unilateral ischemic stroke were recruited. None of them received intravascular therapy. National Institutes of Health Stroke Scale (NIHSS) and modified Ranking Scale (mRS) were recorded right before MR scan. Image protocol: On a 3 Tesla MRI scanner (Discovery MR750, GE Healthcare) with a 32-channel head coil, conventional T1-Weighted Image (T1WI), T2 Fluid Attenuated Inversion Recovery (T2FLAIR), Diffusion-Weighted Image (DWI), 3D multi-echo Gradient Echo (GRE) and single delay pseudocontinuous Arterial Spin Labeling (ASL) images were acquired. Image processing: Apparent diffusion coefficient (ADC, ×10-6mm2/s) and cerebral blood flow (CBF, mL/100 g/min) maps were generated automatically from the DWI and ASL data on the GE workstation. Oxygen extraction fraction (OEF, %) maps and nonblood quantitative susceptibility mapping that eliminate susceptibility effect of blood (nonblood QSM, ppb) were reconstructed from 3D multi-echo GRE data using a cluster analysis of time evolution for QSM and quantitative blood oxygen level-dependent magnitude (qBOLD) method.1 All maps were co-registered. Region of interests (ROI): A threshold of 5-30 ml/100g/min was used to guide the delineation of the perfusion lesion (PL) on the CBF maps.2 Diffusion lesion (DL) were generated using a threshold of 600 × 10-6mm2/s of the ADC data.3 The automated PL and DL were manually inspected and corrected if necessary. Patients were then divided into 3 groups according to modified The Endovascular Therapy Following Imaging Evaluation for Ischemic Stroke (DEFUSE 3) criteria (Fig. 1)4: (1) “matched” (PL volume > 70% but <180% of DL volume); (2) “mismatched” (PL volume >180% of DL volume); (3) “re-perfused” (PL volume < 70% of DL volume). For the mismatched group, the mismatch area between PL and DL was drawn and defined as penumbra. ROIs were overlaid to co-registered OEF, nonblood QSM and CBF maps for extraction of corresponding parameter values. Statistical analyses within and between groups were carried out using IBM SPSS Statistics 26 (Armonk, NY, USA).Results
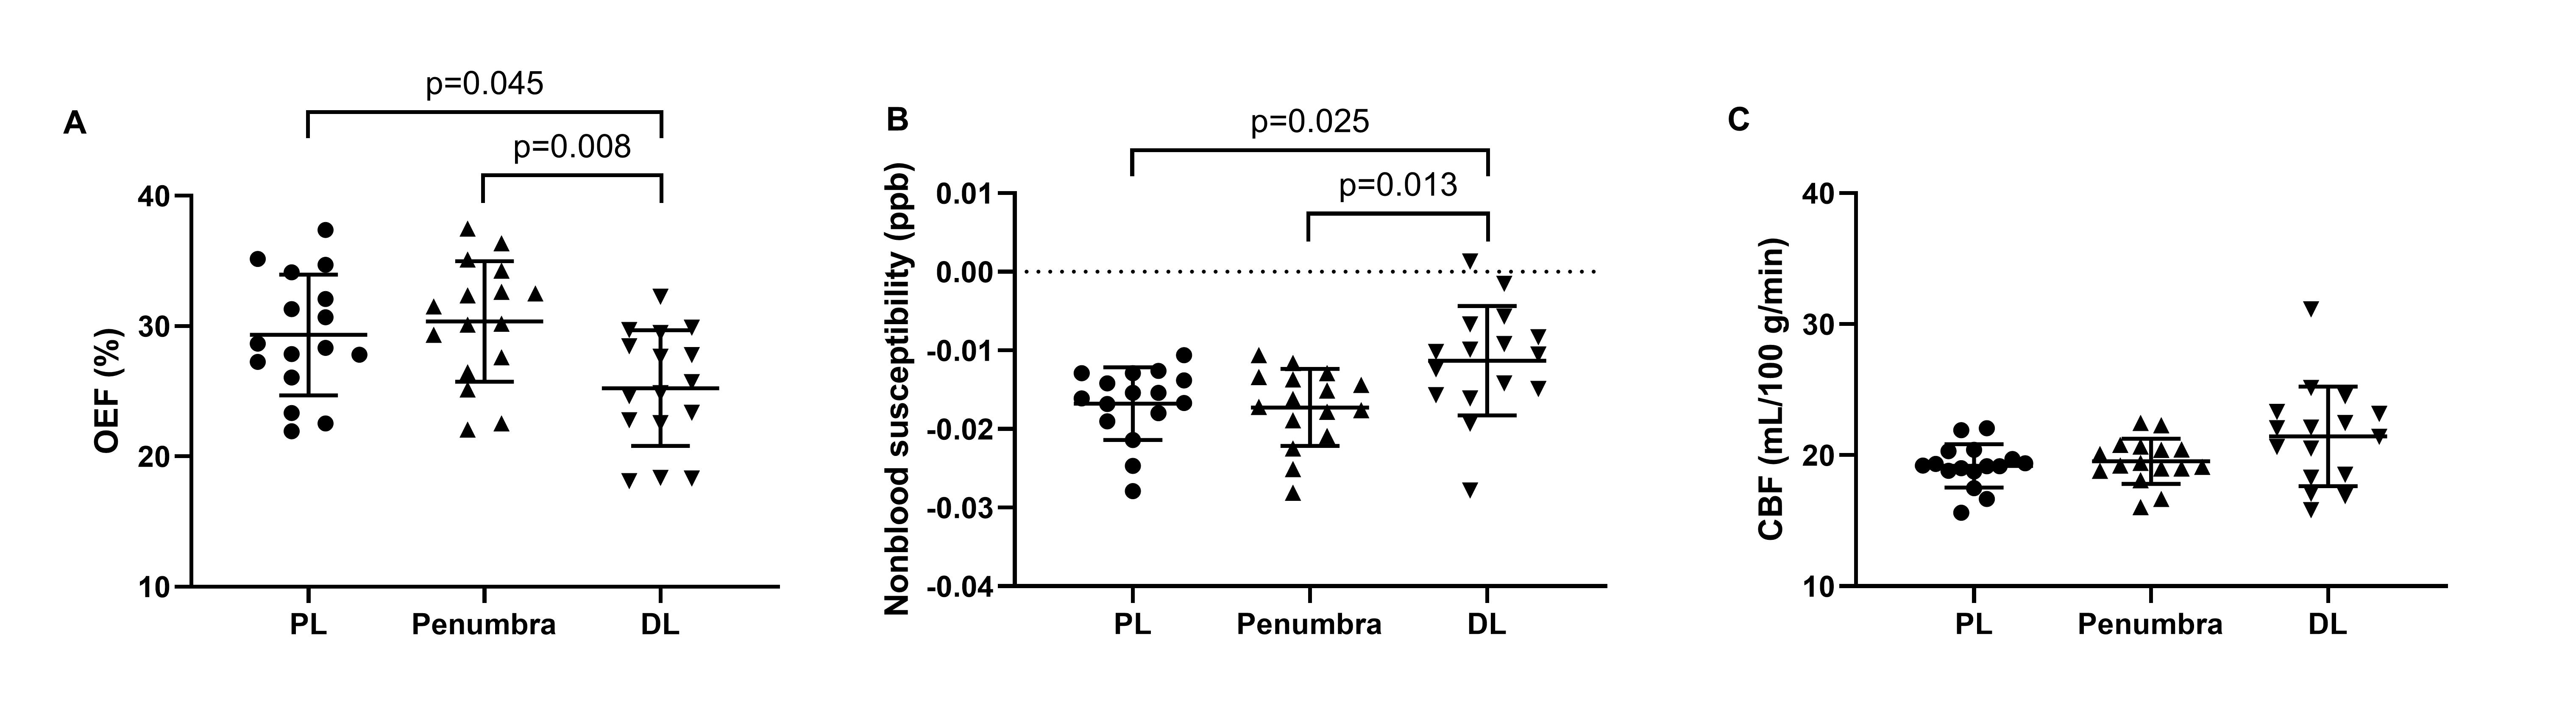
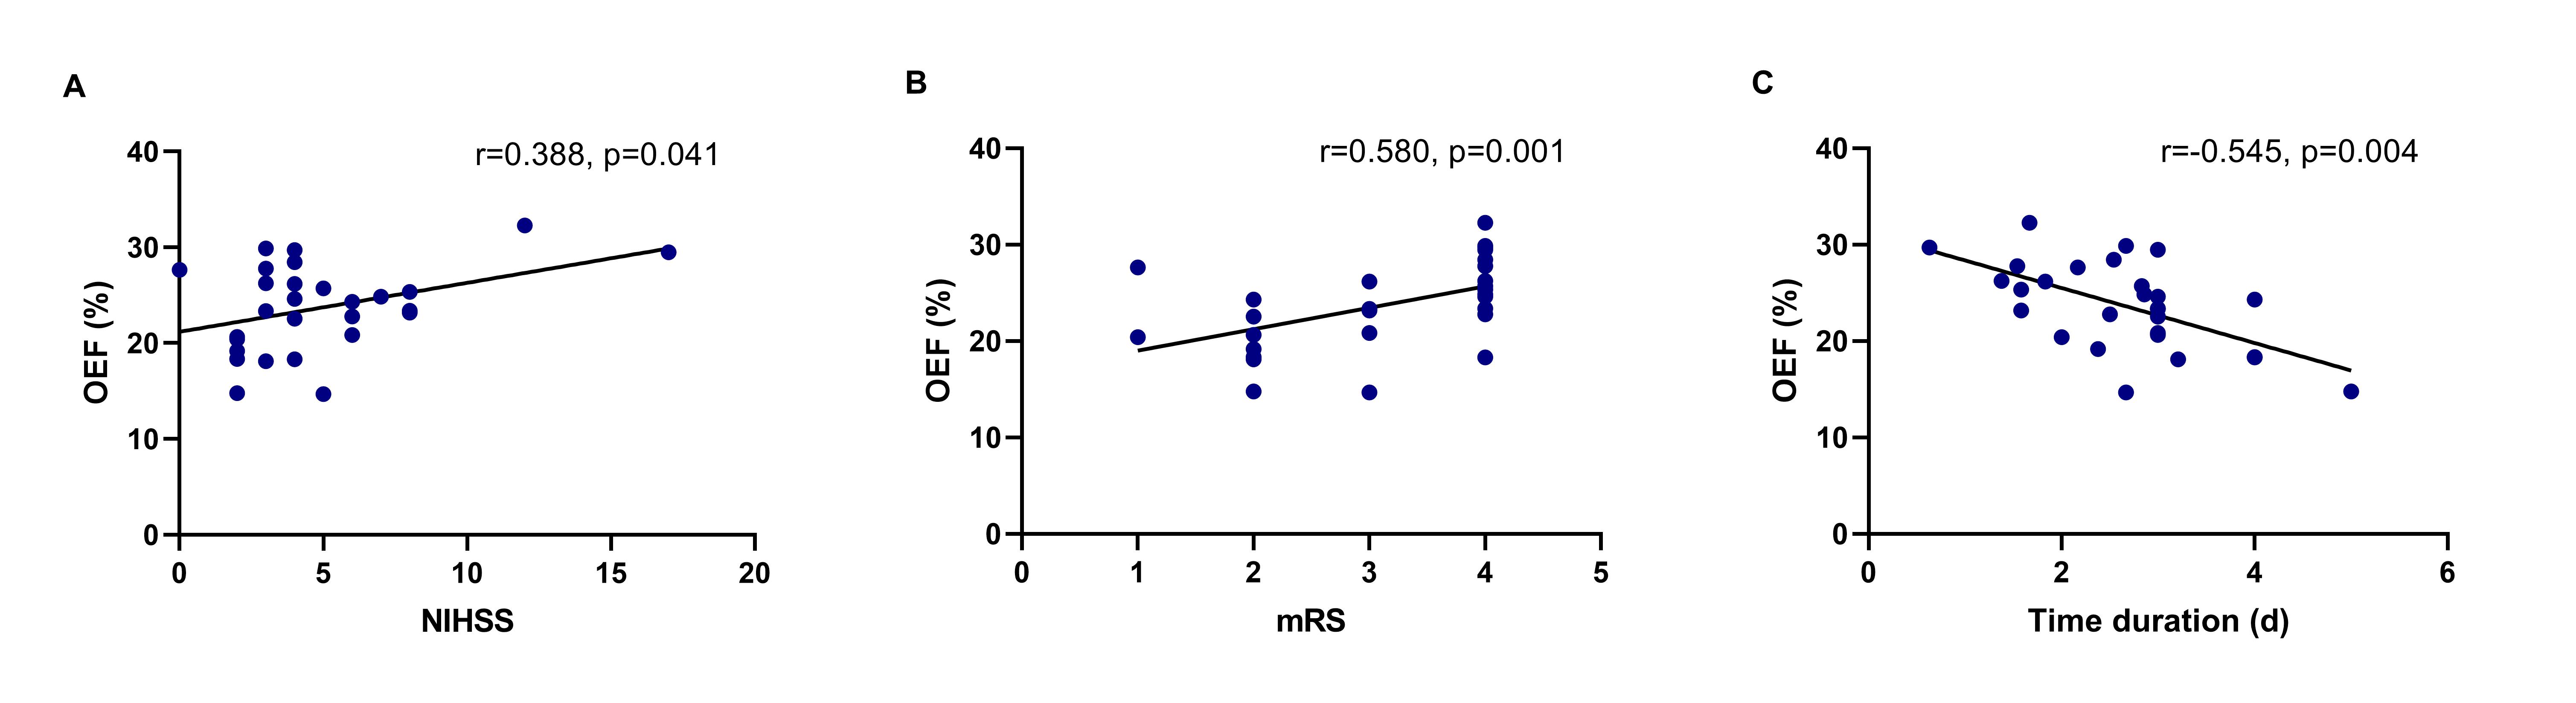
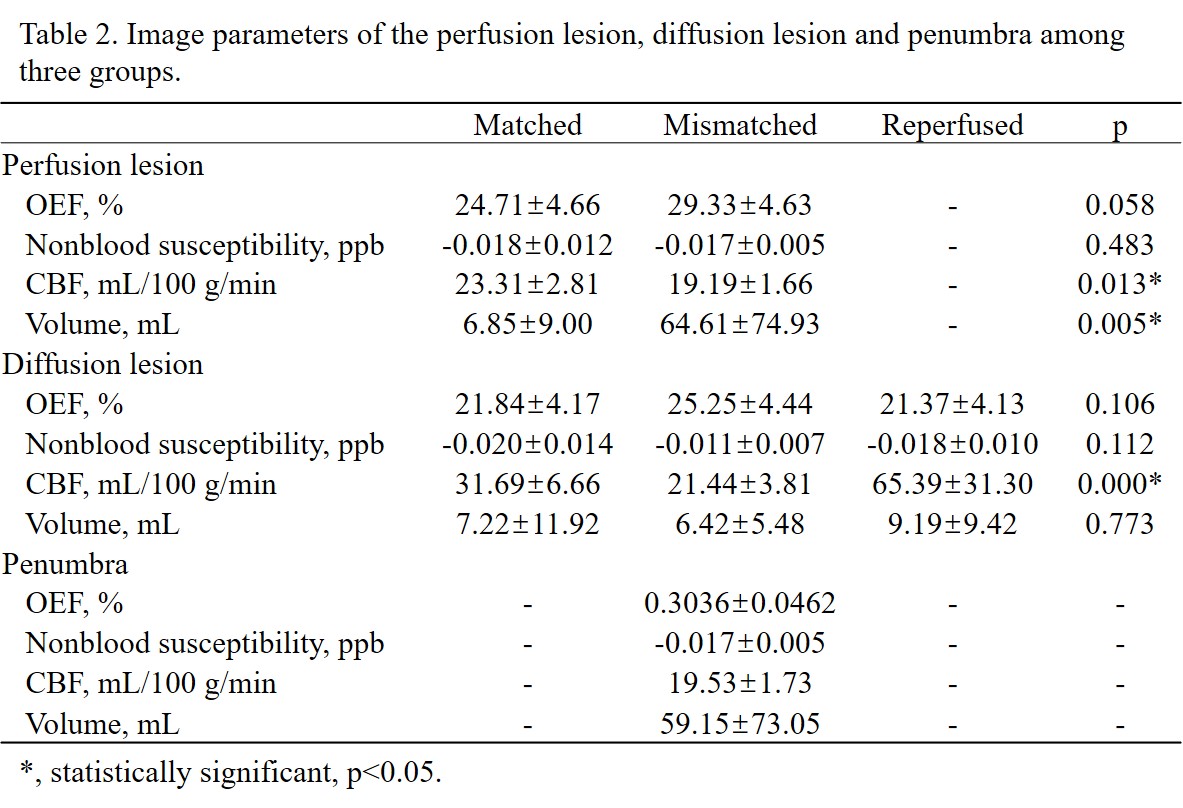
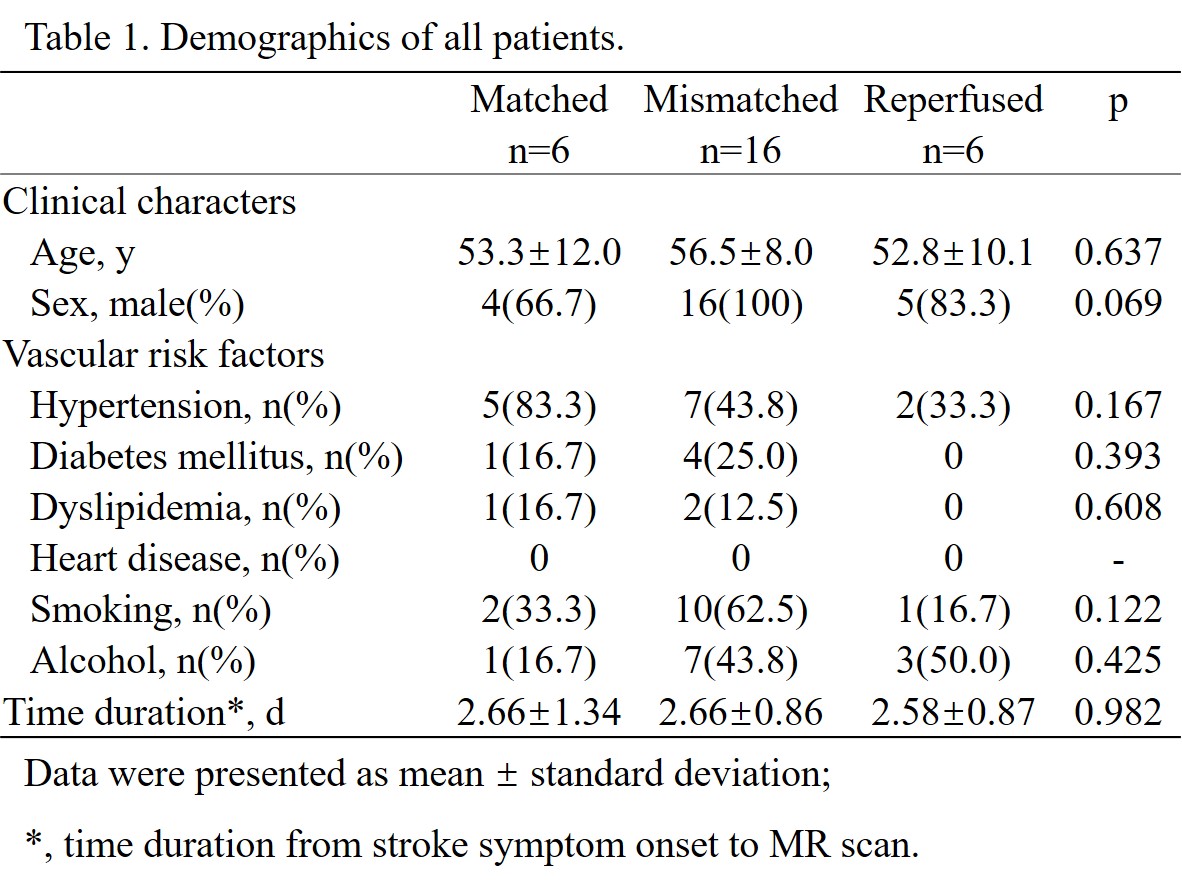
Demographic information was shown in Table 1. Among three groups, only CBF value of the PL and DL were significantly different between matched and mismatched group (p = 0.013 and 0.000, respectively) (Table. 2). In the mismatched group, OEF value of the DL was significantly lower than that of the PL (p = 0.045) and the penumbra (p = 0.008). Meanwhile, the nonblood susceptibility of the DL was significantly higher than that of the PL (p = 0.025) and penumbra (p = 0.013) (Fig. 2, A and B). Among all cases, OEF value of the DL was negatively correlated with time duration from symptom onset to MR scan (r = -0.545, p = 0.004) and positively correlated with NIHSS and mRS (r = 0.388, p = 0.041; r = 0.580, p = 0.001, respectively) (Fig. 3).Discussion
The time duration from stroke symptom onset to MR scan of most patients in our study was more than 1 day, and thus the blood flow was more likely to have recovered before imaging in the matched group due to better collateral circulation. Our study applied a new method for measurement of the nonblood susceptibility of brain tissue that eliminates susceptibility effect of blood and for measurement of OEF. Within minutes of stroke onset, microglia possibly with irons are activated and paramagnetic reactive oxygen species are generated.5 These neuroinflammatory factors may lead to increased nonblood magnetic susceptibility of the brain tissue in the ischemic core as our data. The ischemic penumbra was defined as the brain tissue that suffers perfusion deficit but maintains morphological integrity, of which the oxygen extraction fraction increases for compensation.6 While in the ischemic core, defined as DL in our study, the tissue was irreversibly damaged; therefore, the oxygen metabolism continues to break down with time.7 In the early stage of ischemic stroke, the tissue struggles to extract more oxygen from blood which may contribute to severe clinic symptoms.Conclusion
Different parts of the ischemic stroke lesion have different pathophysiological characteristics and outcomes. Accordingly, multi-modal MRI with our new method for OEF and nonblood QSM reconstruction could precisely capture oxygen metabolic, neuroinflammatory and hemodynamic discrepancy.Acknowledgements
Funding: This project was supported by the National Natural Science Funds of China (Grants No.81801666, 81570462 and 81730049).References
1. Cho J, Zhang S, Kee Y, et al. Cluster analysis of time evolution (CAT) for quantitative susceptibility mapping (QSM) and quantitative blood oxygen level-dependent magnitude (qBOLD)-based oxygen extraction fraction (OEF) and cerebral metabolic rate of oxygen (CMRO2 ) mapping. Magnetic resonance in medicine. 2020; 83: 844-57.
2. Wang DJ, Alger JR, Qiao JX, et al. The value of arterial spin-labeled perfusion imaging in acute ischemic stroke: comparison with dynamic susceptibility contrast-enhanced MRI. Stroke. 2012; 43: 1018-24.
3. Olivot JM, Mlynash M, Thijs VN, et al. Relationships Between Cerebral Perfusion and Reversibility of Acute Diffusion Lesions in DEFUSE Insights from RADAR. Stroke. 2009; 40: 1692-7.
4. Albers GW, Marks MP, Kemp S, et al. Thrombectomy for Stroke at 6 to 16 Hours with Selection by Perfusion Imaging. New Engl J Med. 2018; 378: 708-18.
5. Jayaraj RL, Azimullah S, Beiram R, Jalal FY and Rosenberg GA. Neuroinflammation: friend and foe for ischemic stroke. Journal of neuroinflammation. 2019; 16: 142.
6. Sette G, Baron JC, Mazoyer B, Levasseur M, Pappata S and Crouzel C. Local brain haemodynamics and oxygen metabolism in cerebrovascular disease. Positron emission tomography. Brain : a journal of neurology. 1989; 112 ( Pt 4): 931-51.
7. Zhang S, Cho J, Nguyen TD, et al. Initial Experience of Challenge-Free MRI-Based Oxygen Extraction Fraction Mapping of Ischemic Stroke at Various Stages: Comparison With Perfusion and Diffusion Mapping. Frontiers in neuroscience. 2020; 14: 535441.
Figures