0877
Longitudinal Changes in Neurometabolite Levels from Acute to Subacute Stroke: A Pilot Study Using Fast High-resolution 3D 1H-MRSI1School of Biomedical Engineering, Shanghai Jiao Tong University, Shanghai, China, 2Radiology Department, The Fifth People's Hospital of Shanghai, Fudan University, Shanghai, China, 3Beckman Institute for Advanced Science and Technology, University of Illinois at Urbana-Champaign, Urbana, IL, United States, 4Department of Electrical and Computer Engineering, University of Illinois at Urbana-Champaign, Urbana, IL, United States, 5Department of Biomedical Engineering, Case Western Reserve University, Cleveland, OH, United States
Synopsis
Detection of neurometabolic alterations in stroke patients from acute to subacute stages could provide useful information for brain tissue salvage therapy. Fast high-resolution 3D 1H-MRSI by SPICE has previously provided nearly whole-brain neurometabolic mapping in acute stroke patients. In this pilot study, we investigated the alterations of neurometabolites in a longitudinal cohort of ischemic stroke patients. Our preliminary results showed observable changes of different neurometabolites in different regions within the hypoperfused tissue of stroke patients from acute to subacute stages. Our study may lay a foundation for further investigation of temporal changes of neurometabolic biomarkers during stroke progression.
Introduction
Stroke is a leading cause of mortality and disability worldwide.1 Understanding pathophysiological changes in ischemic tissue after stroke is of great importance to help design and apply therapeutic interventions.2 Impaired neuronal metabolism is a pathological hallmark of ongoing tissue injury during ischemic stroke.3 Therefore, detection of tissue-level longitudinal neurometabolic alterations in stroke patients could potentially provide useful insights for tissue salvage. MR spectroscopic imaging (MRSI) provides a noninvasive tool for simultaneous mapping of several important neurometabolites in ischemic stroke, such as N-acetylaspartate (NAA) as a marker of neuronal integrity, and lactate as a marker of anerobic metabolism.4 Previous studies applied 2D MRSI to investigate the temporal changes of different neurometabolites following ischemic stroke, yet with low spatial resolution (>10 mm) and limited detection sensitivity.5,6 Recently, a fast 3D high-resolution 1H-MRSI technology, known as SPICE (SPectroscopic Imaging by exploiting spatiospectral CorrElation), has achieved nearly whole-brain neurometabolites mapping at 2×3×3 mm3 resolution within an 8-min scan in acute stroke patients.7 In this pilot study, we used SPICE for 3D 1H-MRSI of a cohort of ischemic stroke patients and evaluated their longitudinal changes in neurometabolites.Methods
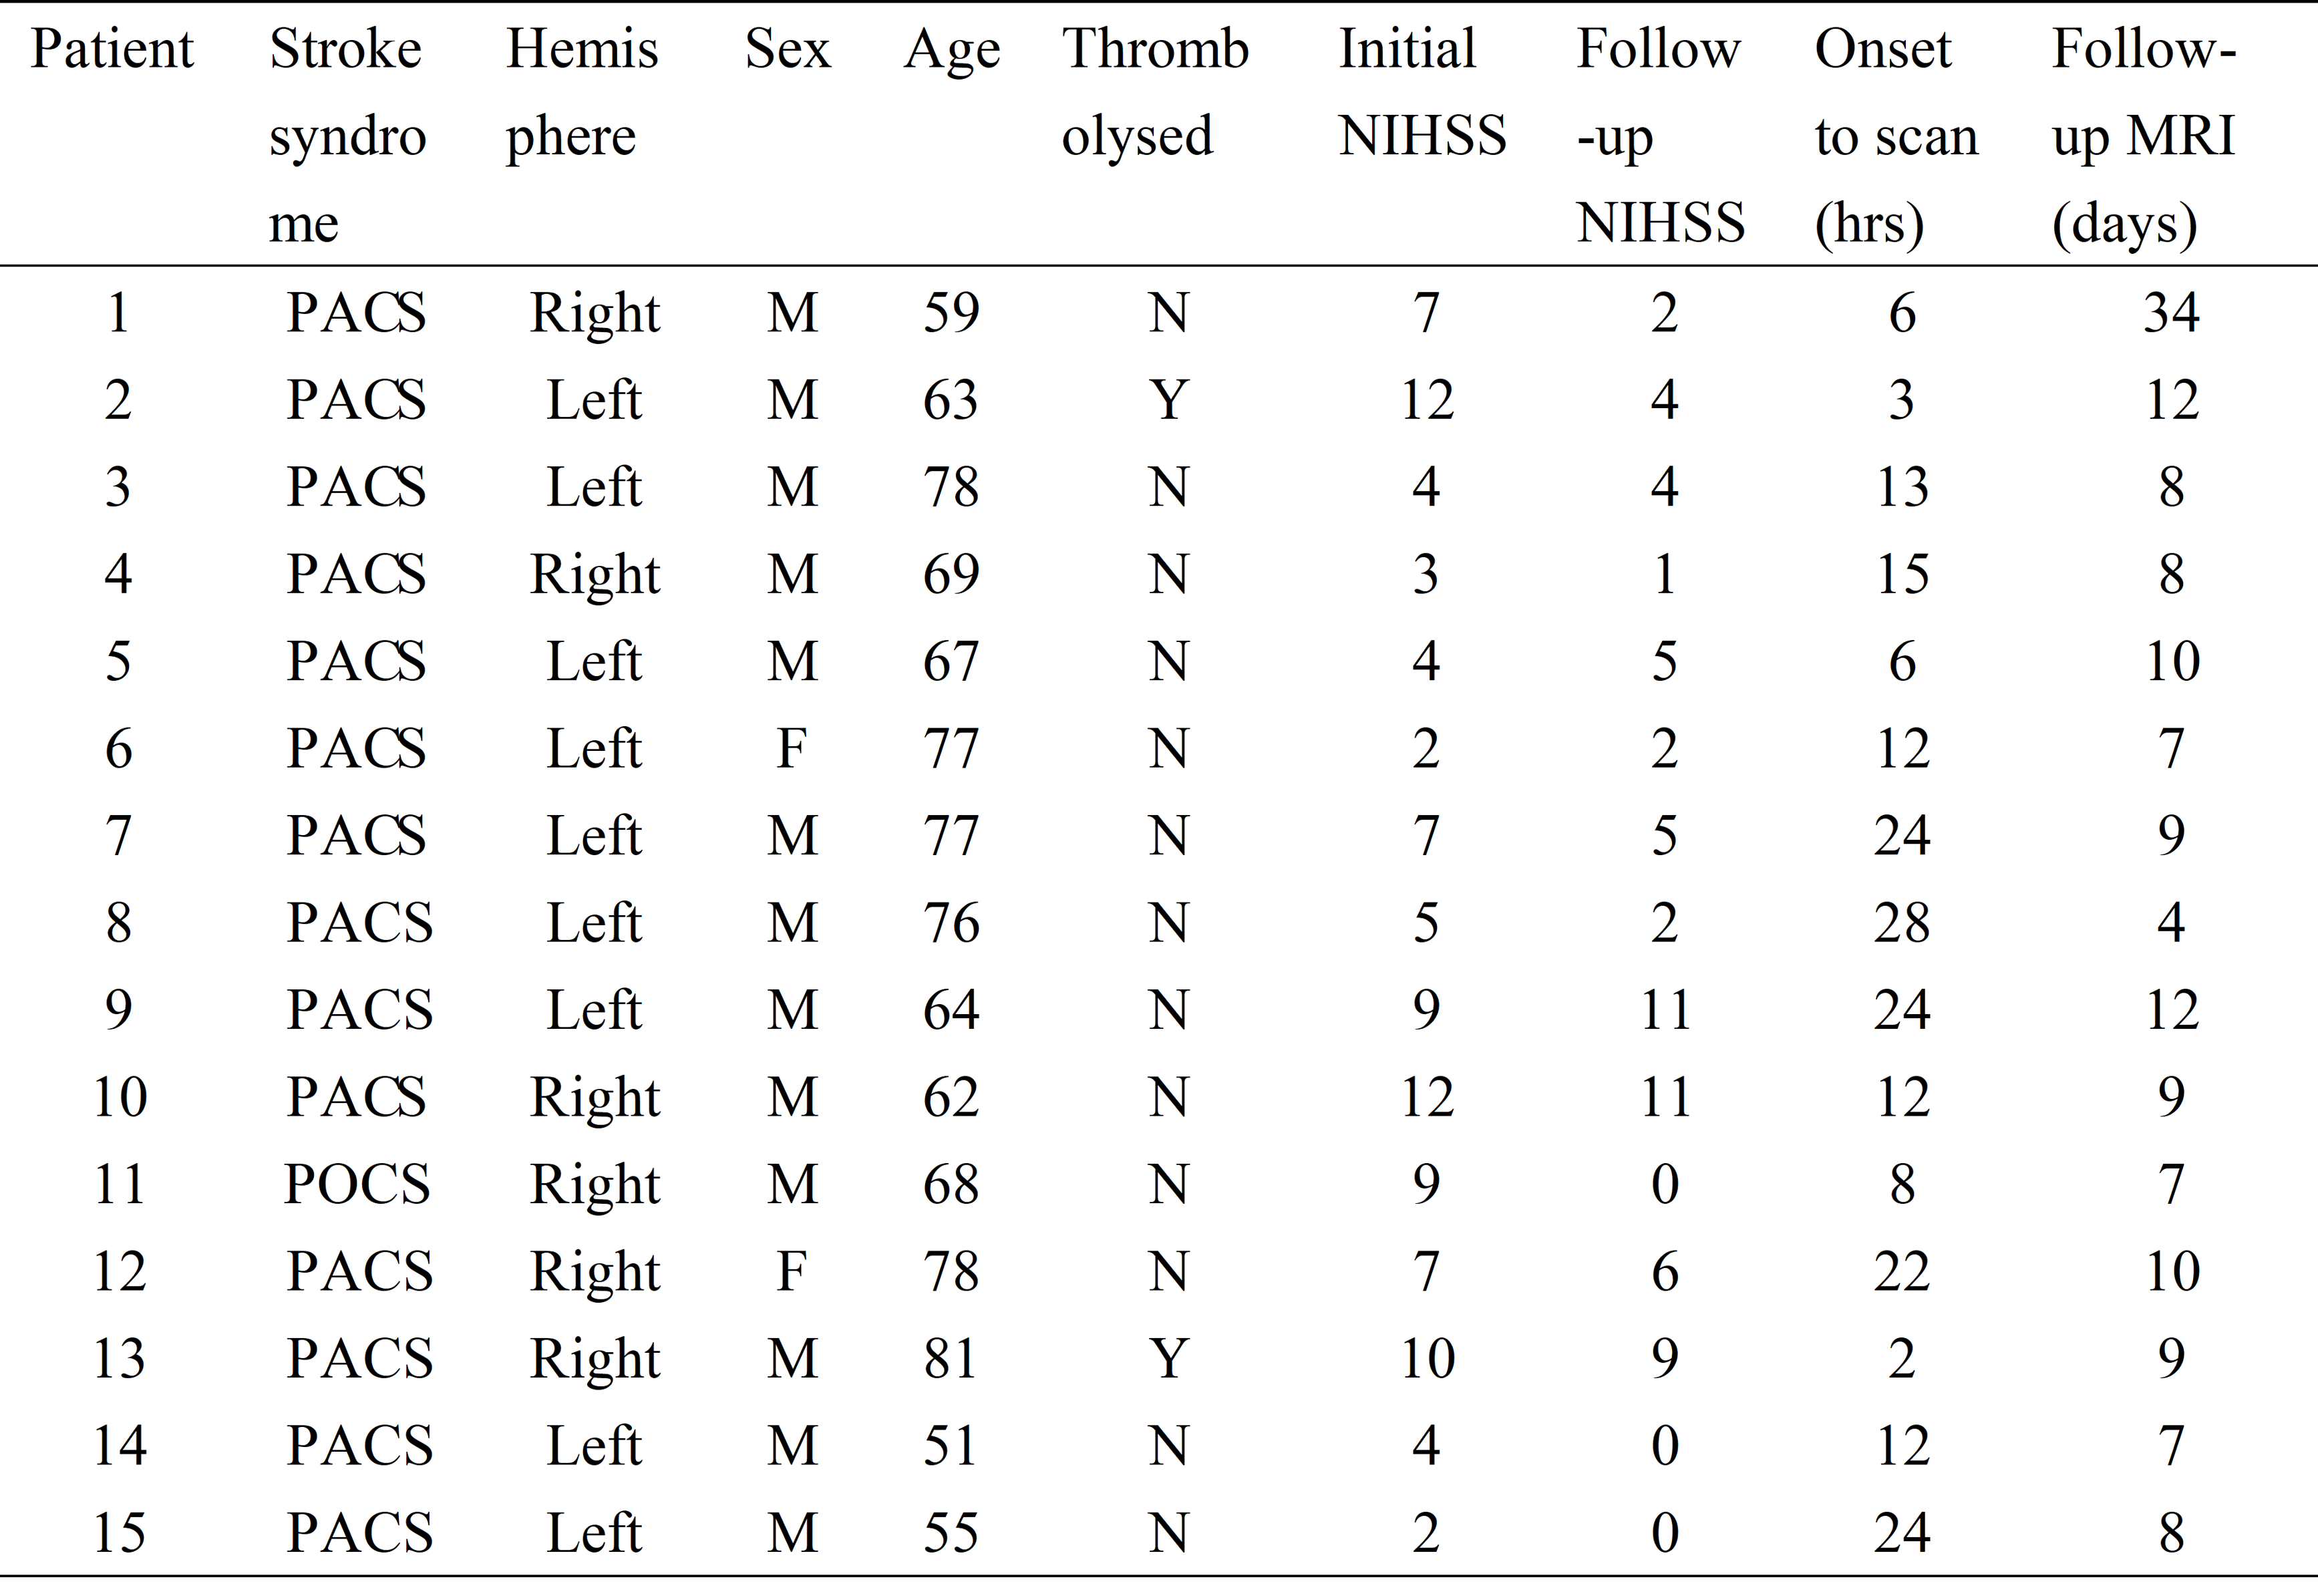
Fifteen acute ischemic stroke patients were recruited within 24 h of symptom onset. Eight patients received follow-up MRI scanning at 4-12 days after the initial scan. The characteristics of the included patients are summarized in Table 1. The study was approved by the Institutional Review Board of the Fifth People’s Hospital of Shanghai, China.The image acquisition protocols included high-resolution 3D MRSI using the SPICE sequence8 (2.0 × 3.0 × 3.0 mm3, FOV = 240 × 240 ×72 mm3, TE = 1.6 ms, TR = 160 ms), diffusion-weighted imaging (DWI) (1.3 x 1.3 x 4.0 mm3, FOV = 220 mm, b = 0 and b = 1000 s/mm2, TR = 5200 ms, TE = 64 ms), pCASL-PWI (3.75 × 3.75 × 3.75 mm3, FOV = 240 mm, TR = 3300 ms, TE = 10.3 ms, delays = 0.8 s, 1.0 s, 1.5 s, 2.2 s, 3.0 s), 3D MPRAGE imaging (1.0 × 1.0 × 1.0 mm3, FOV = 256 mm, TR = 2500 ms, TE = 2.26 ms) and T2-weighted Fluid-Attenuated Inversion Recovery (FLAIR) imaging (0.5 × 0.5 × 2.0 mm3, FOV = 240 mm, TR = 9000 ms, TE = 89 ms). All the scans were performed on a 3.0T Siemens Skyra scanner.
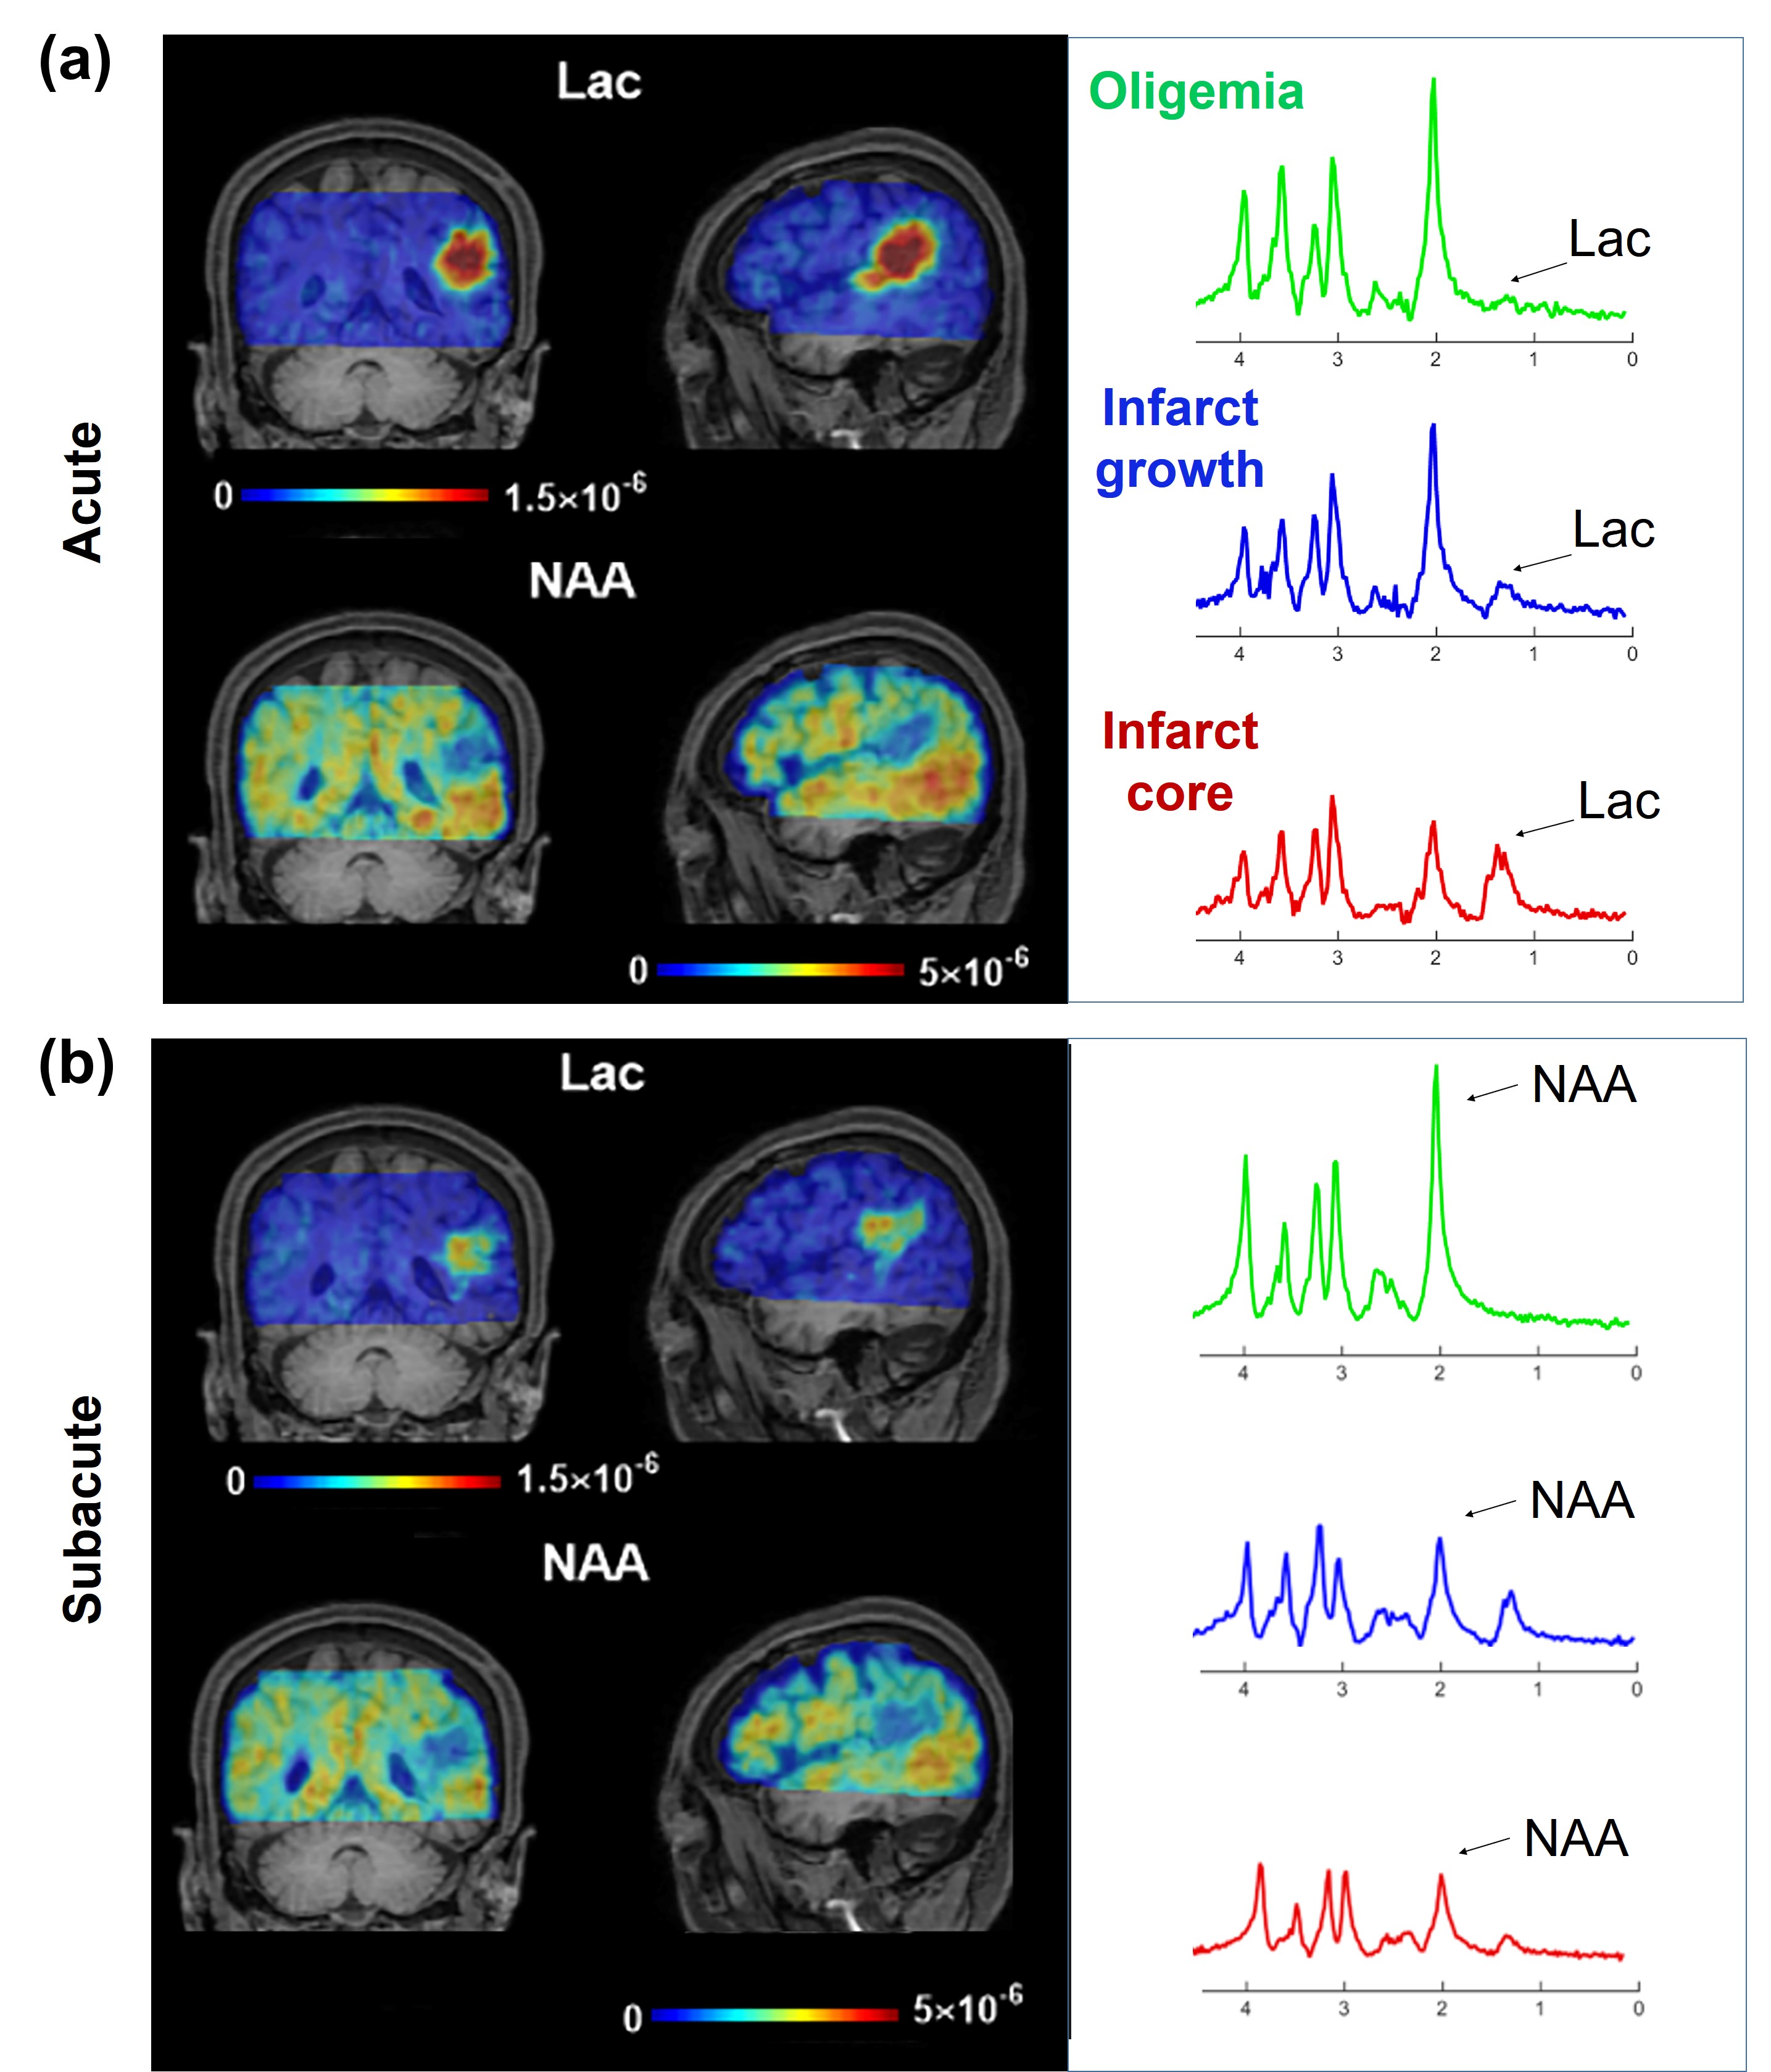
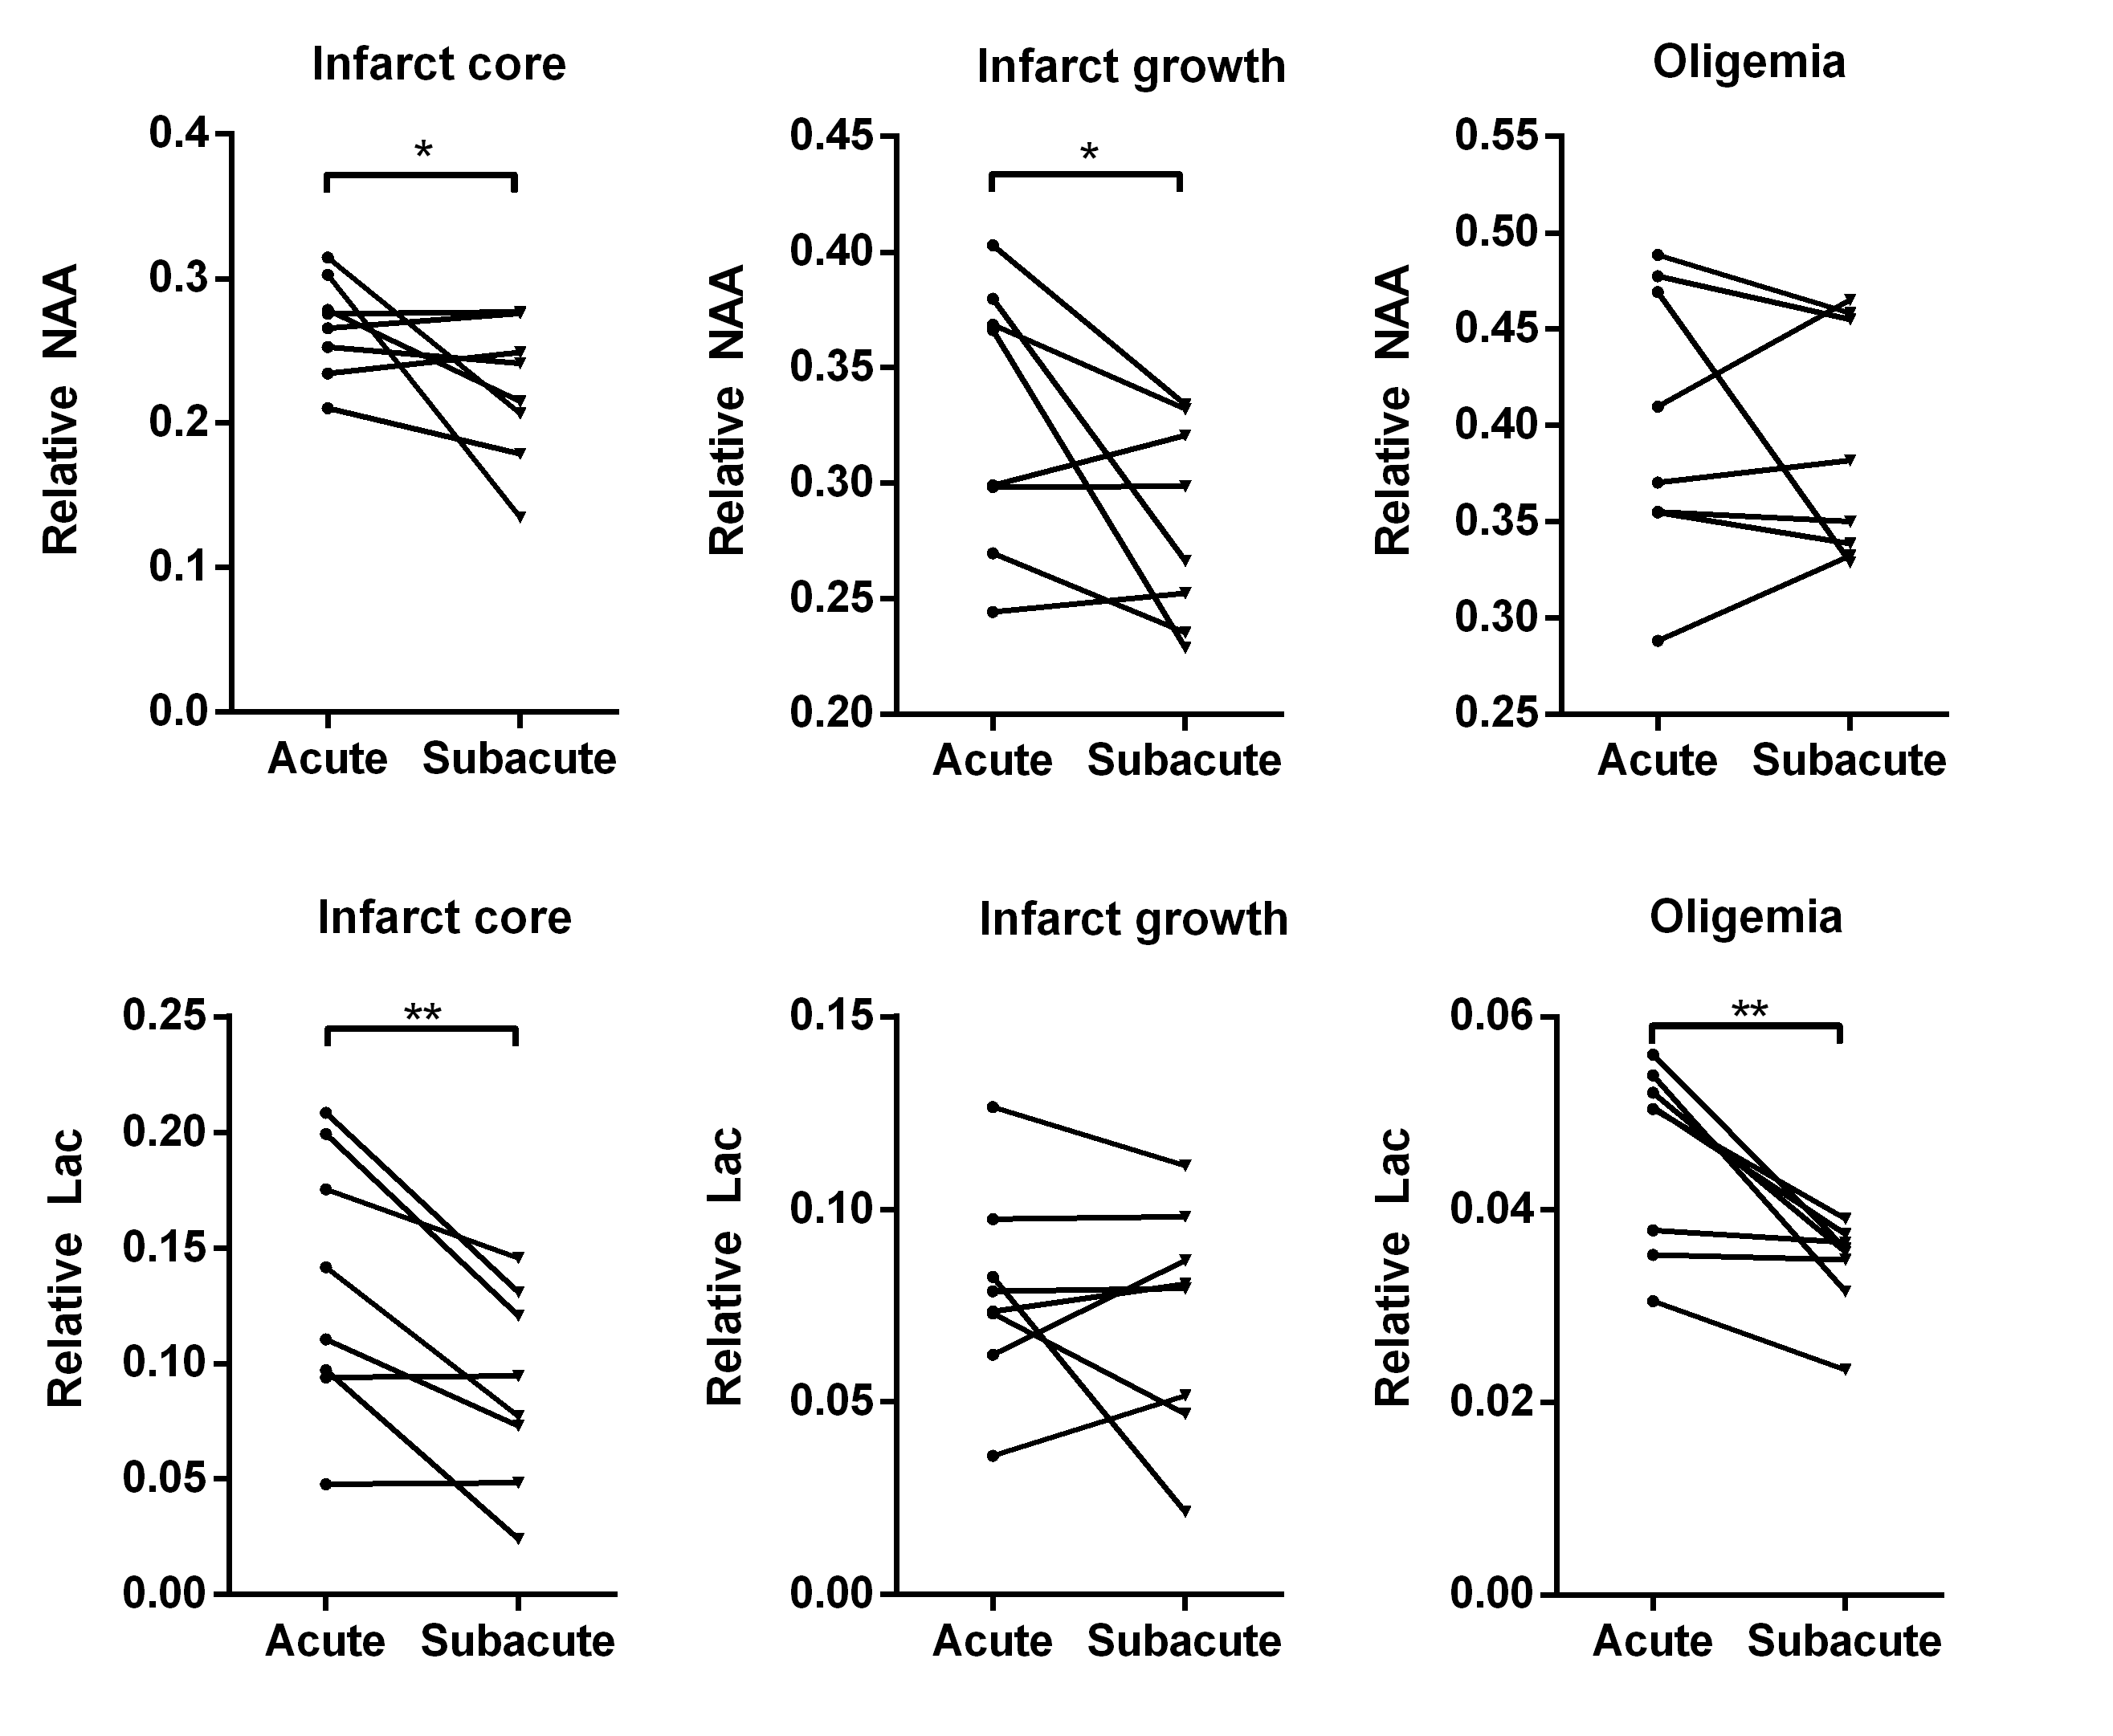
Neurometabolite maps were obtained using the standard processing pipeline of SPICE.9 All the images were coregistered to the T1-weighted images for both acute and subacute data. The tissue with ADC value below 620 × 10-6 mm2 /s was defined as the acute lesion, and the tissue with CBF below 20 ml/100g/min was defined as the hypoperfused area. The final infarct was manually defined on the follow-up FLAIR images. Three individual regions of interest (ROI) masks were generated based on the acute images: 1) infarct core: tissue present in both the acute lesion and the final infarct; 2) infarct growth: tissue present in the final infarct but not in the acute lesion; 3) oligemia: tissue present in the hypoperfused area but not the acute lesion or the final infarct.
Group comparisons were performed using SPSS v24. The Mann Whitney tests were used to compare the neurometabolites concentrations between different ROIs at each stage. Paired t-tests were applied to compare the mean neurometabolic levels between the acute and subacute stages.
Results
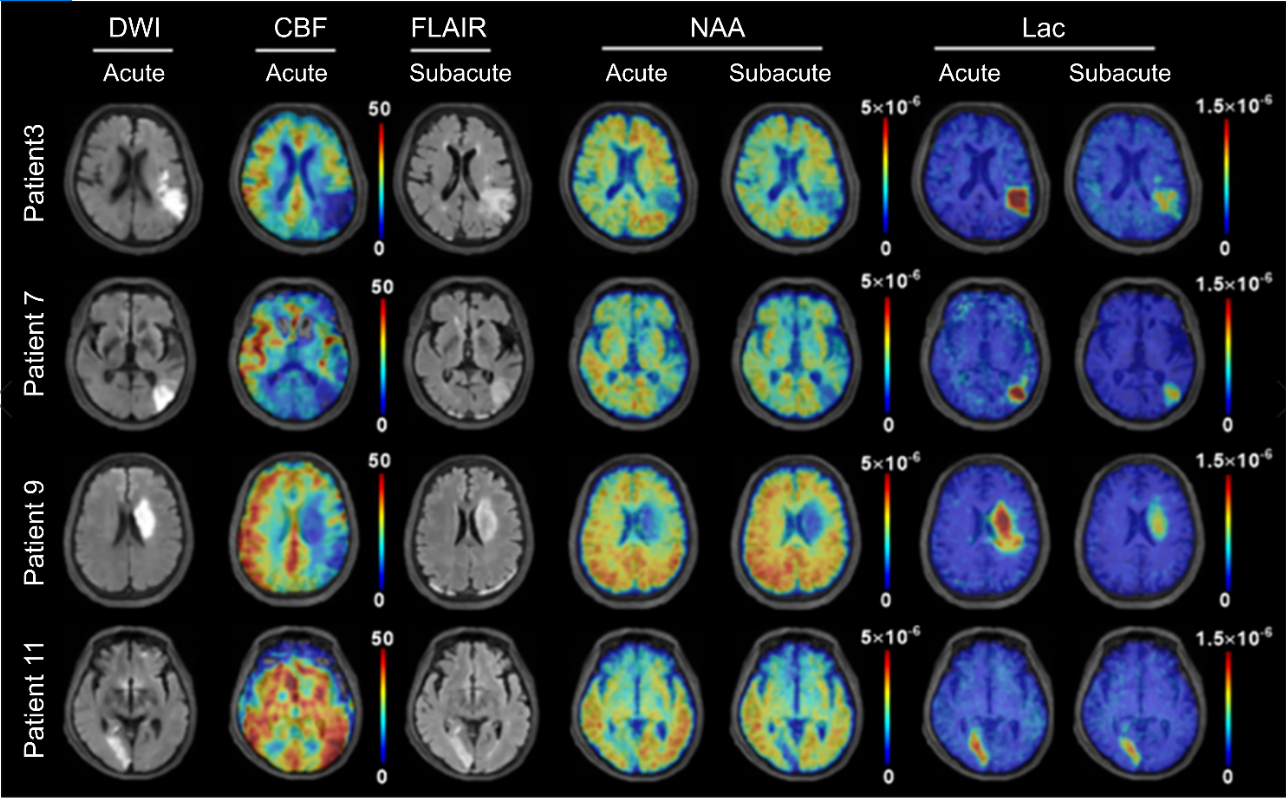
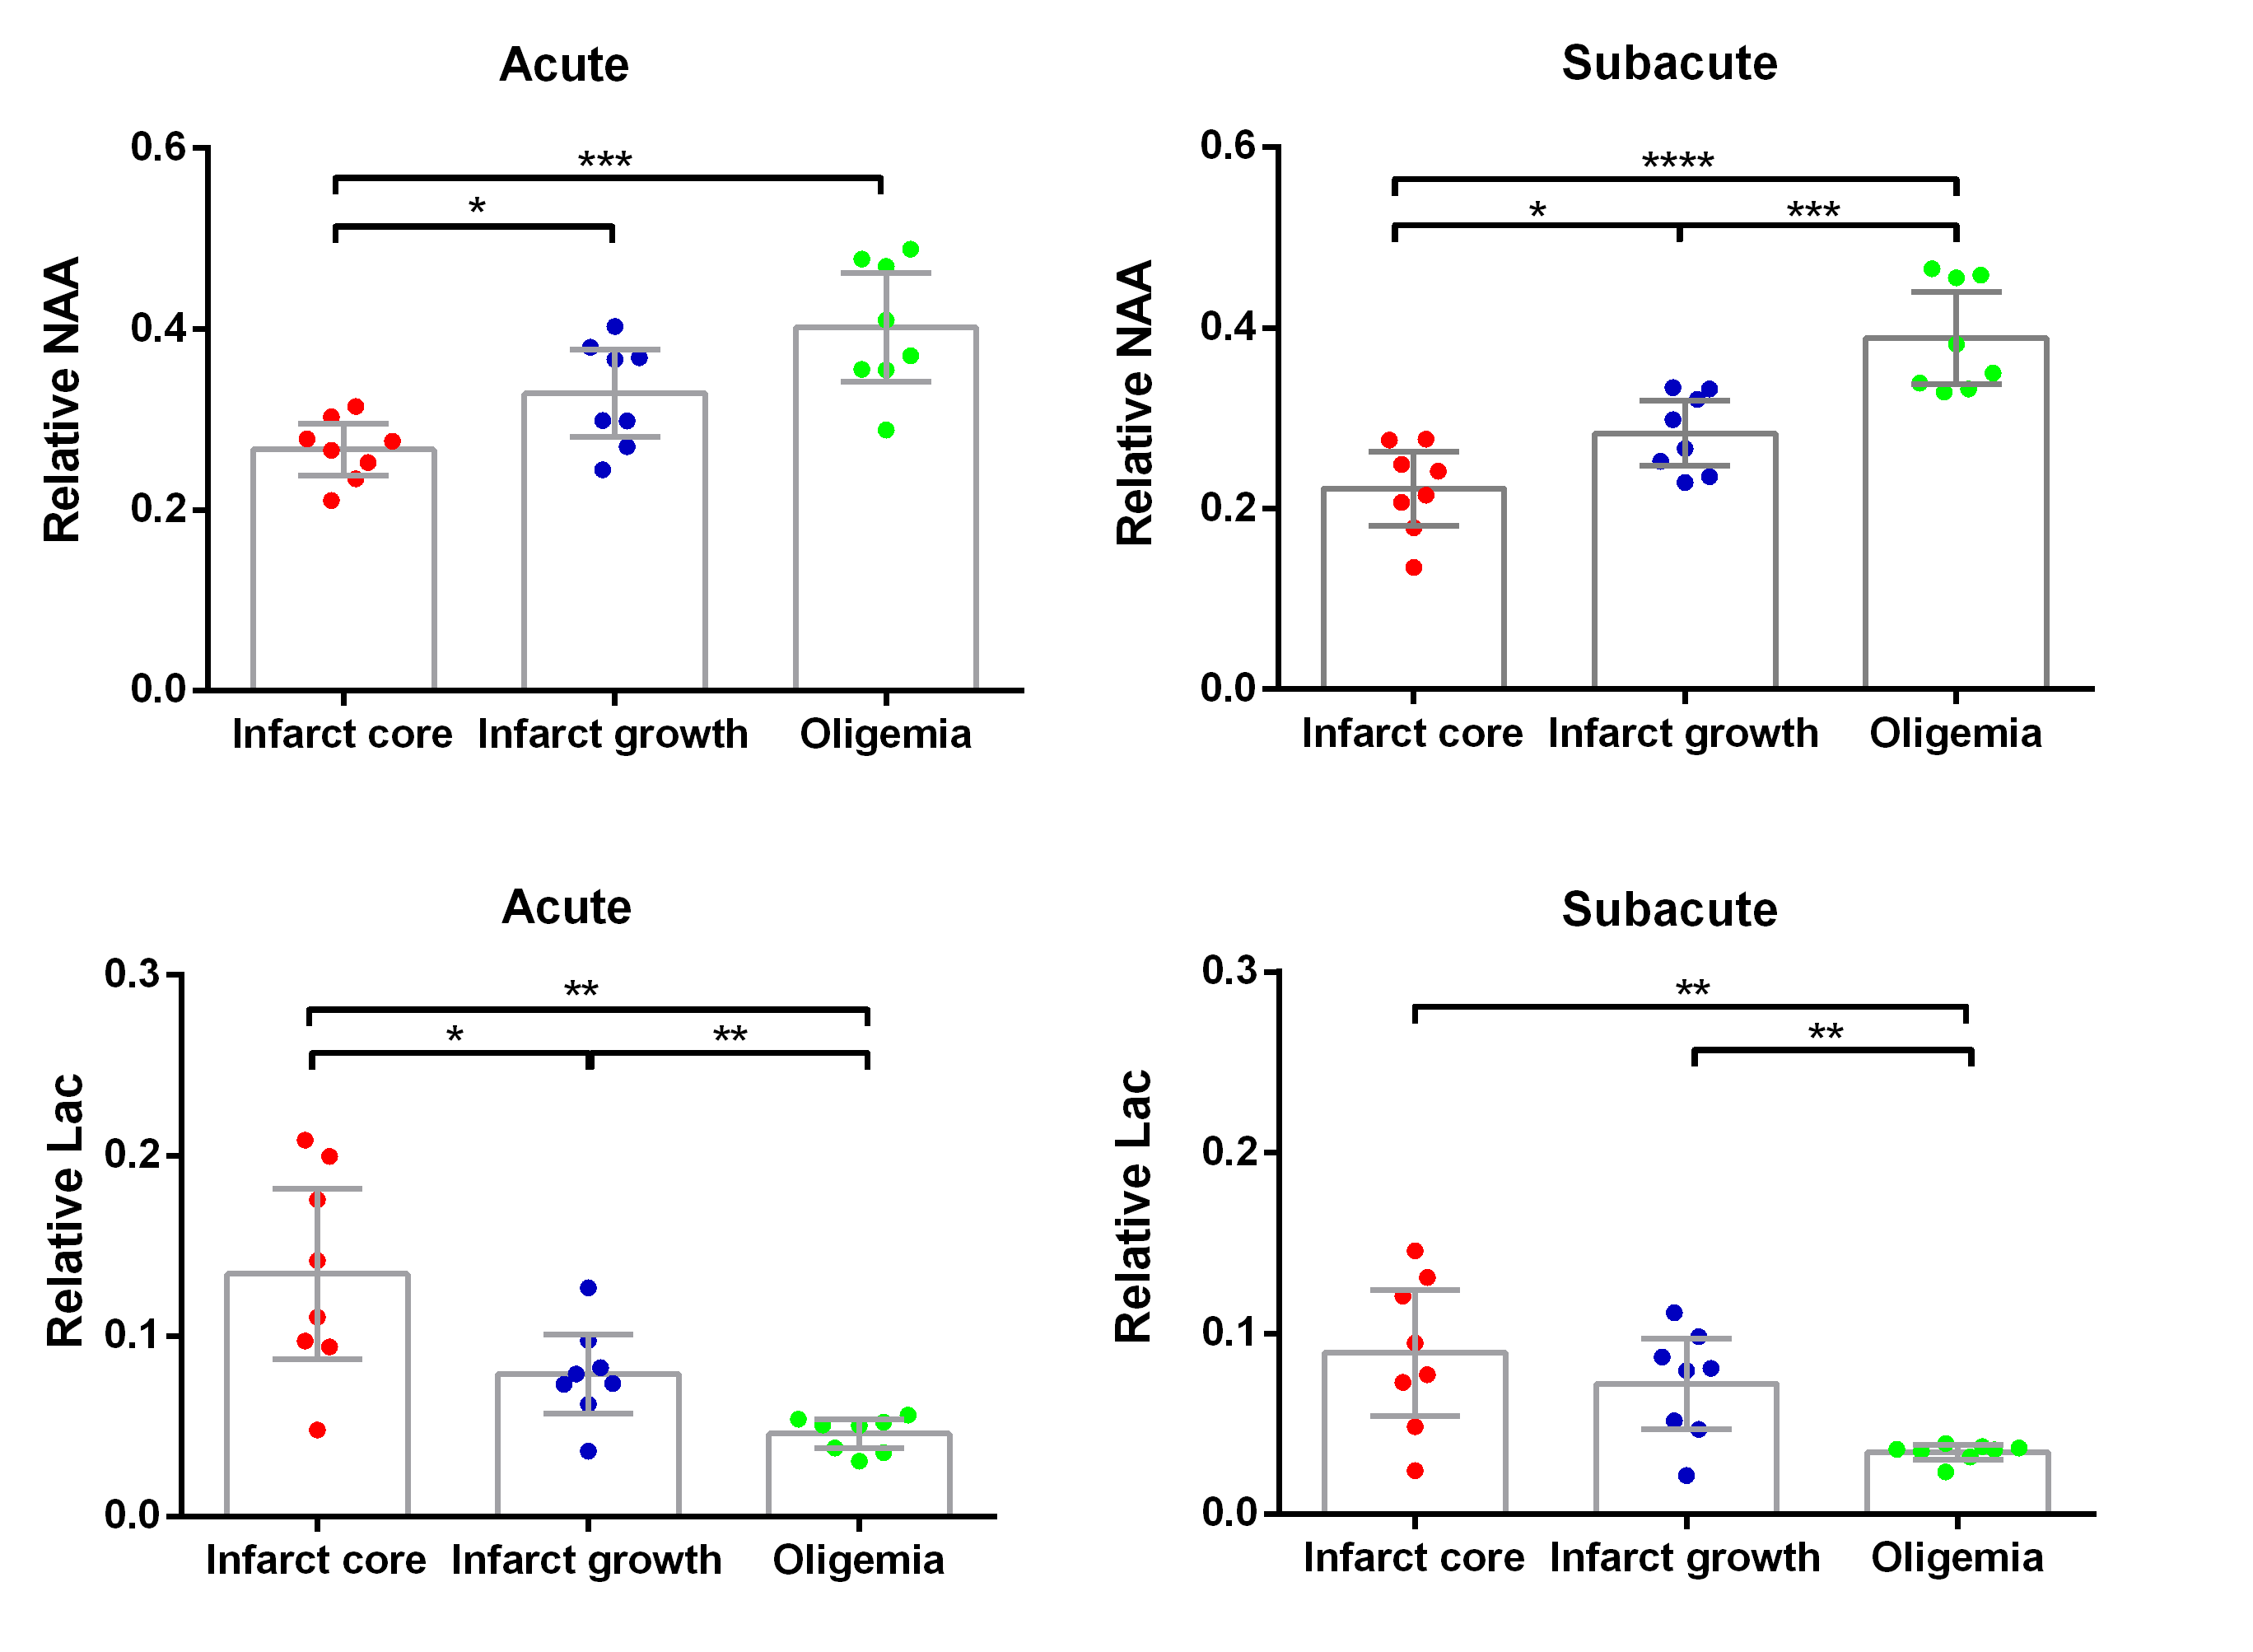
Figure 1 shows representative high-resolution metabolite maps with representative spectra from the infarct core, infarct growth and oligemia respectively, obtained at acute (13h) and subacute (8d) stages of an ischemic stroke patient. Figure 2 shows multimodal images obtained in this study from representative patients. Figure 3 shows group comparison results between different ROIs at the acute and subacute stages, respectively. In the acute stage, the infarct core exhibited lower NAA than the infarct growth region (p < 0.05). The lactate signal in the infarct core was higher than that in the infarct growth (p < 0.05), which was higher than that in the oligemia (p < 0.01). In the subacute stage, the infarct growth showed reduced NAA compared to oligemia (p < 0.001). The difference of lactate level between the infarct core and infarct growth was not significant. The longitudinal changes of NAA and lactate in each ROI are illustrated in Fig. 4. The NAA level reduced in the infarct core and infarct growth, while lactate reduced in the infarct core and oligemia. These results suggest that NAA and lactate may serve as useful biomarkers for assessing ongoing tissue damage during stroke progression, in line with previous literature.5Conclusion
We investigated the longitudinal changes of neurometabolites in ischemic stroke patients using fast 3D high-resolution 1H-MRSI. Our results showed noticeable temporal changes of different neurometabolites from acute to subacute stages in different regions within the hypoperfused tissue. Our study may lay a foundation for further investigation of temporal changes of neurometabolic biomarkers during stroke progression to help the design and application of therapeutic interventions for stroke patients.Acknowledgements
Y. L. is funded by National Science Foundation of China (No.61671292 and 81871083) and Shanghai Jiao Tong University Scientific and Technological Innovation Funds (2019QYA12).References
1. Feigin VL, Roth GA, Naghavi M, et al. Global burden of stroke and risk factors in 188 countries, during 1990–2013: a systematic analysis for the Global Burden of Disease Study 2013. Lancet Neurol, 2016;15(9):913-24.
2. George PM, Steinberg GK. Novel stroke therapeutics: unraveling stroke pathophysiology and its impact on clinical treatments. Neuron, 2015;87(2):297-309.
3. Dani KA, Warach S. Metabolic imaging of ischemic stroke: the present and future. AJNR Am J Neuroradiol, 2014;35(6 suppl): S37-43.
4. Barker PB, Gillard JH, Van Zijl PC, et al. Acute stroke: evaluation with serial proton MR spectroscopic imaging. Radiology, 1994;192(3):723-32.
5. Maniega SM, Cvoro V, Chappell FM, et al. Changes in NAA and lactate following ischemic stroke: a serial MR spectroscopic imaging study. Neurology, 2008;71(24):1993-9.
6. Muñoz Maniega S, Cvoro V, Armitage PA, et al. Choline and creatine are not reliable denominators for calculating metabolite ratios in acute ischemic stroke. Stroke, 2008;39(9):2467-9.
7. Li Y, Wang T, Zhang T, et al. Fast high-resolution metabolic imaging of acute stroke with 3D magnetic resonance spectroscopy. Brain, 2020;143(11):3225-33.
8. Lam F, Ma C, Clifford B, et al. High‐resolution 1H‐MRSI of the brain using SPICE: data acquisition and image reconstruction. Magn Reson Med, 2016;76(4):1059-70.
9. Li Y, Lam F, Clifford B, et al. A subspace approach to spectral quantification for MR spectroscopic imaging. IEEE Trans Biomed Eng, 2017;64(10):2486-9.
Figures