0875
Prediction of the Treatment Efficacy of Patients with Subacute Cerebral Infarction using the Heterogeneity of APT-weighted Signals1the First Affiliated Hospital of Dalian Medical University, Dalian, China, 2Philips Healthcare, Beijing, China
Synopsis
Amide proton transfer weighted (APTw) MRI has been increasingly applied in the study of stroke based on its ability to detect pH and intracellular proteins content. In subacute infarction, the heterogeneity of APTw signal may reflect the clinical treatment efficacy of patients. In this study, we found that there is negative correlation between the heterogeneity signals (APTwmax-min) in the ischemic regions and the difference of NIHSS scores on the day of hospital admission and leaving (∆NIHSS). Therefore, the heterogeneity of APTw signal is potentially an effective imaging biomarker to predict the efficacy of patients with subacute cerebral infarction.
Introduction
Ischemic stroke (IS) causes irreversible brain tissue infarction (infarct core, IC) and is the main causes of death or dysfunction[1]. As a conventional IS treatment, thrombolytic therapy increases the survival rate and reduce the disability of patients with cerebral infarction. However, the time window of intravenous thrombolysis for acute IS generally limited to within 4.5 hours after the onset of symptoms. Unfortunately, clinically, there are a large proportion of patients who fail to be sent to hospital within the "golden time". Studies have shown that ischemic penumbra (IP) may still exist in this phase[2]. As a branch of the chemical exchange saturation transfer (CEST) imaging method[3], amide proton transfer weighted (APTw) MRI has been increasingly applied in the study of IS to detect the changes of pH and intracellular proteins content. Recent studies have shown that APTw can be used to assess the severity of stroke and predict the long-term clinical outcome of AIS patients[4]. The heterogeneity of APTw signals can also be used as a biomarker to indicate prognosis. Therefore, evaluating the heterogeneity of APTw signal in ischemic tissue is of great significance for guiding clinical treatment. The goal of this study was to determine whether lower APTw signal heterogeneity in the ischemic regions of subacute infarction patients with better clinical efficacy, and the influencing factors of the APTw signal heterogeneity.Methods
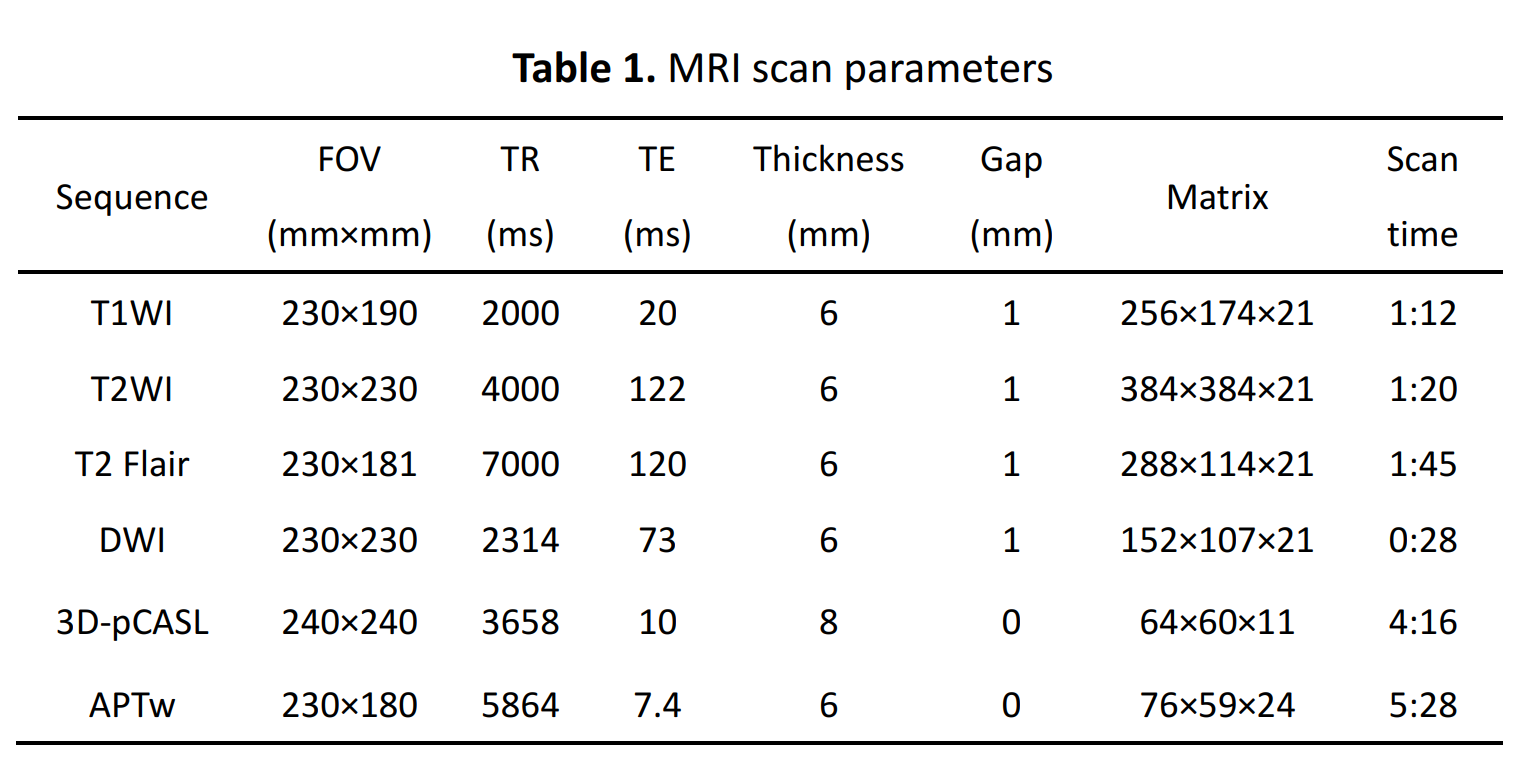
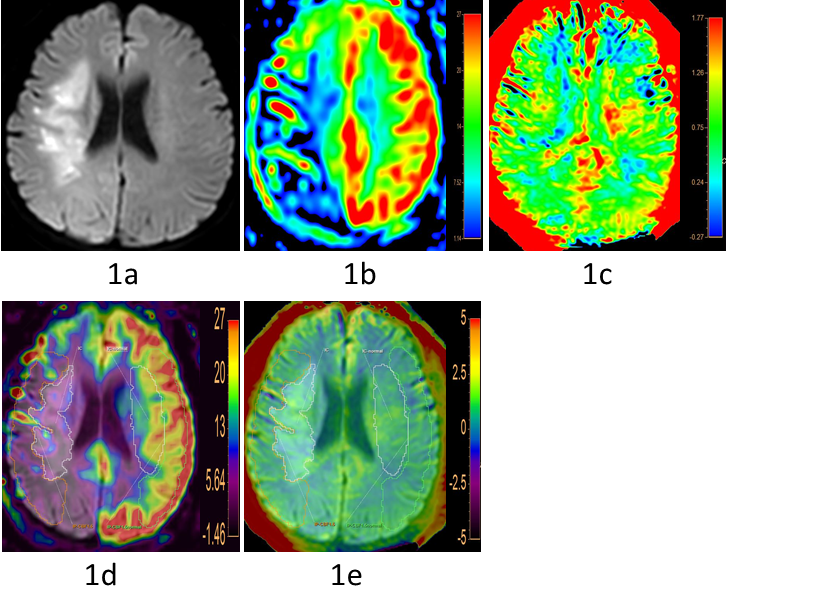
Twenty-three patients (mean age: 64.00 ± 10.70, range: 44-86 years; 14 male) were prospectively enrolled into this study from April 2019 to September 2019. All MR images were acquired on a 3.0-T MRI scanner (Ingenia CX, Philips Healthcare, Best, the Netherlands) with a 32-channel receive-only head coil. MR protocols and scan parameters were shown in Table 1. After scanning, all raw data were automatically transmitted to a workstation (IntelliSpace Portal, ISP, Philips healthcare, Netherlands) to generate CBF map and APTw map, and then measured independently by two radiologists with more than 5 years of diagnostic experience.IC was determined according to the high signal intensity on DWI and IP was defined as CBF-DWI mismatch area. APTw and CBF images were registered and overlaid with the DWI maps. 3D ROIs of IC and IP in APTw and CBF maps were semi-automatically drawn and fusion (Figure 1). Then the mean APTw signal intensity of the ischemic area (APTwmean), the relative cerebral blood flow (rCBFlesion) values and 3D volumes of IC and IP were measured. Other APTw signals were also recorded including the maximum APTw (APTwmax) and the minimum APTw (APTwmin). The APTw signal heterogeneity were calculated as the difference of the maximum APTw signal and the minimum values (APTwmax - APTwmin) [5].
NIHSS score of all patients were evaluated by at least a neurologist when they were admitted to the hospital (NIHSSadm) and discharged (NIHSSdis). ∆NIHSS was calculated as NIHSSadm - NIHSSdis. All statistical analyses were performed using the SPSS 22.0 software package. The interclass correlation coefficient (ICC) was used to evaluate measurement consistency between the two observers. The Pearson correlation test was applied to analyze the correlation between APTw signals and clinical-radiological findings. For all tests, values of P < 0.05 were considered to indicate statistical significance.
Results
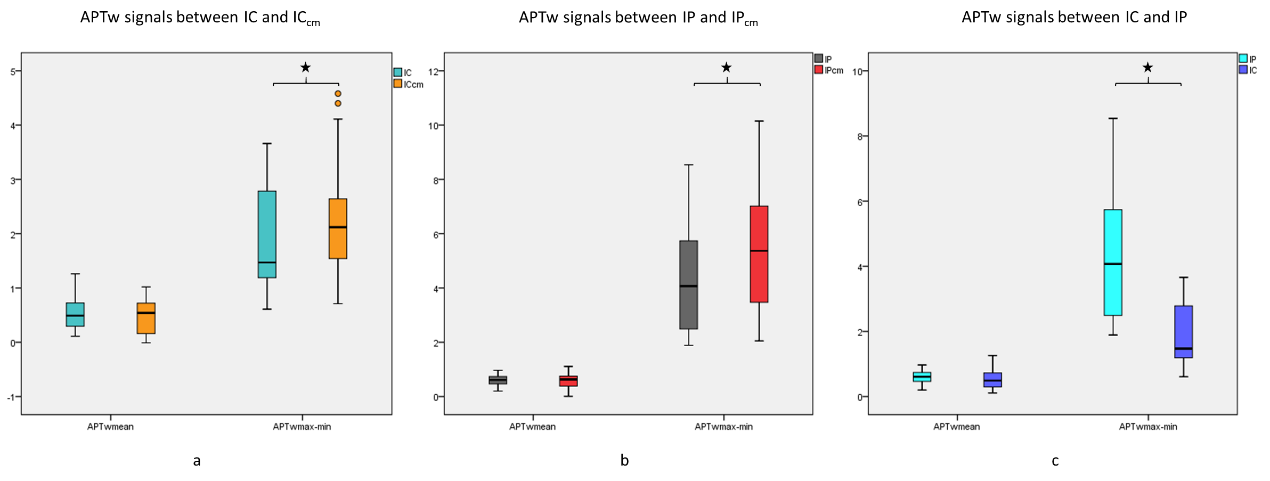
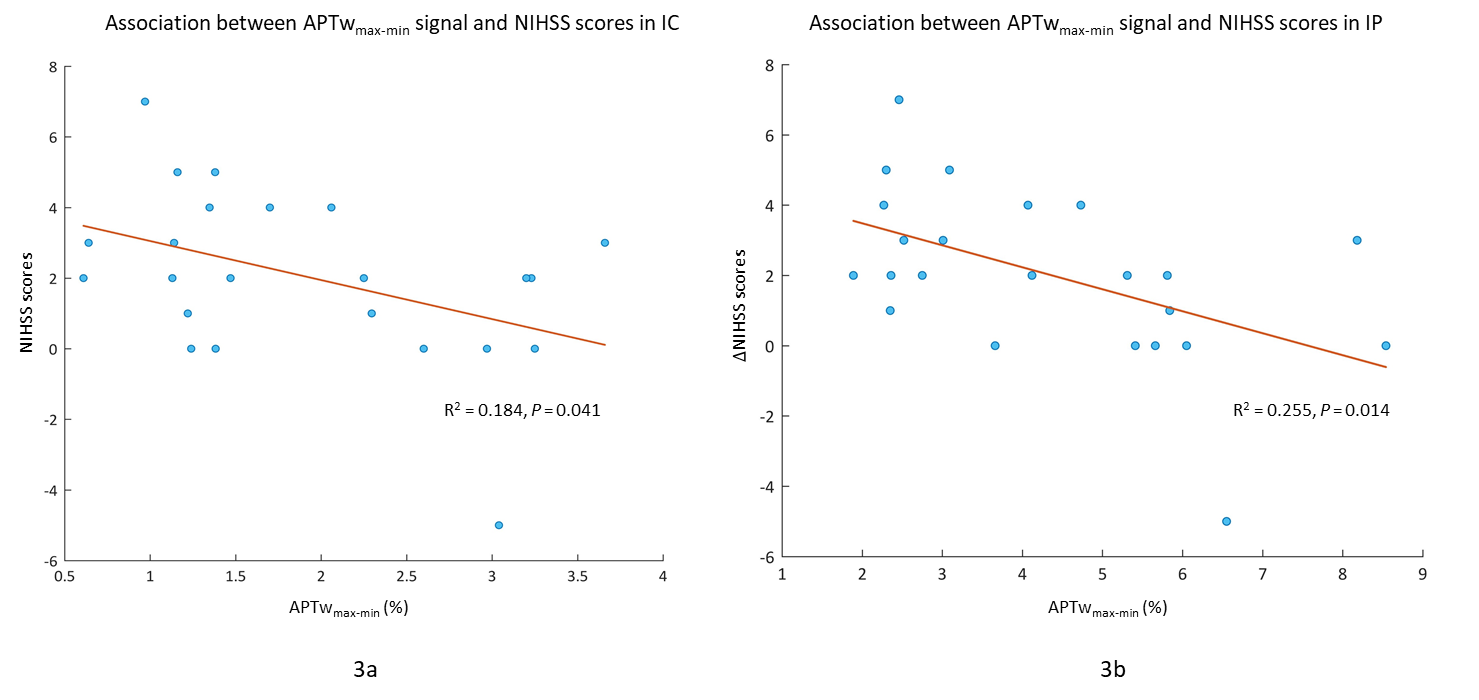
Measurement consistency between the two observers was good (ICC > 0.75). APTwmax-min signal were significantly lower in the IC and IP than the contralateral mirror side (P < 0.01) (Fig 2a-2b). APTwmax-min signal were significantly increased in the IP than the IC (P < 0.01) (Fig 2b). But there are no significant differences of APTwmean signal between the bilateral sides both in IC and IP. Pearson correlation test of the relationship between the APTwmax-min signal and ∆NIHSS score (Fig 3). The negative correlation was found between the ∆NIHSS score and APTwmax-min within IC (R2 = 0.184, P = 0.041) and IP (R2 = 0.255, P = 0.014).Discussion
In this study, we found that APTwmax-min in the IC and IP inversely correlated with the ∆NIHSS scores with significant statistic difference. The results indicate that the heterogeneity of APTw signals could assess the severity of cerebral infarction patients, and then reflect the efficacy of supportive treatment. The possible reasons for the inhomogeneity of APTw signals may contribute from the destruction of blood-brain barrier (BBB)[6], which will be seriously influence the prognosis of patients with cerebral infarction[7]. Furthermore, unlike hyperacute and acute infarction, the pathophysiological mechanism of subacute infarction is complicated, and the influencing factors of APTw signals should not be limited to the changes in tissue pH[8]. In general, patients with low APTw signal heterogeneity had a significant improvement in the severity of clinical symptoms when they were discharged from the hospital. Therefore, the heterogeneity of APTw signal can be used as a potential imaging marker to judge the severity and efficacy of cerebral infarction.Conclusion
Lower APTw signal heterogeneity in the ischemic regions of subacute infarction patients is a significant predictor of the clinical efficacy. It will have benefits in prediction of clinical treatment for patients with advanced thrombolytic therapy.Acknowledgements
No acknowledgement found.References
[1] Strong, K., Mathers, C., Bonita, R., 2007. Preventing stroke: saving lives around the world. Lancet Neurol. 6, 182–187.
[2] Hillis A. E. et al. Restoring blood pressure reperfused Wernicke’s area and improved language. Neurology 56, 670 (2001).
[3] Ward KM, Aletras AH, Balaban RS. A new class of contrast agents for MRI based on proton chemical exchange dependent saturation transfer (CEST). J Magn Reson. 2000 Mar;143(1):79-87. doi: 10.1006/jmre.1999.1956. PMID: 10698648.
[4] Lin G, Zhuang C, Shen Z, et al. APT Weighted MRI as an Effective Imaging Protocol to Predict Clinical Outcome After Acute Ischemic Stroke. Front Neurol. 2018; 9:901.
[5] Jiang S, Yu H, Wang X, et al. Molecular MRI differentiation between primary central nervous system lymphomas and high-grade gliomas using endogenous protein-based amide proton transfer MR imaging at 3 Tesla. [J]. European Radiology, 2016, 26(1):64-71.
[6] Horsch AD, Dankbaar JW, van Seeters T, et al. Relation between stroke severity, patient characteristics and CT-perfusion derived blood-brain barrier permeability measurements in acute ischemic stroke. Clin Neuroradiol. 2016;26(4):415-421. doi:10.1007/s00062-015-0375-1
[7] Cho KH, Kang DW, Kwon SU, Kim JS. Lesion volume increase is related to neurologic progression in patients with subcortical infarction. J Neurol Sci. 2009;284(1-2):163-167. doi: 10.1016/j.jns.2009.05.013
[8] Zhou J, Yan K, Zhu H. A simple model for understanding the origin of the amide proton transfer MRI signal in tissue. Appl Magn Reson. 2012 Apr;42(3):393-402. doi: 10.1007/s00723-011-0306-5.
Figures