0874
Assessment of Symptom Onset Time in Ischemic Stroke Patients Using Fast High-Resolution 3D 1H-MRSI1School of Biomedical Engineering, Shanghai Jiao Tong University, Shanghai, China, 2Radiology Department, The Fifth People's Hospital of Shanghai, Fudan University, Shanghai, China, 3Beckman Institute for Advanced Science and Technology, University of Illinois at Urbana-Champaign, Urbana, IL, United States, 4Department of Electrical and Computer Engineering, University of Illinois at Urbana-Champaign, Urbana, IL, United States, 5Department of Biomedical Engineering, Case Western Reserve University, Cleveland, OH, United States
Synopsis
Determination of ischemic stroke onset time is critical in ischemic stroke treatment. 1H-MRSI has been recognized as a potentially powerful tool for noninvasive metabolic imaging, which showed great promise for the assessment of stroke onset time. This study investigated changes of neurometabolite concentrations in lesion after different symptom onset time in ischemic stroke patients using a fast high-resolution 3D MRSI technique. Our results showed that NAA concentration within the ischemic lesion decreased in a time-dependent manner after stroke onset, which might provide a useful metabolic biomarker for assessment of symptom onset time.
Introduction
Determination of ischemic stroke onset time is critical since the treatment of acute stroke is highly dependent on the therapeutic time window, e.g., 4.5 hours for thrombolysis therapy,1 6 hours for intraarterial recanalization,2 and 9 hours for desmoteplase.3 Approximately 30% of stroke patients present with an unknown time of onset, including wake-up strokes and the ones not able to convey the onset time due to neurological deficits, which makes them ineligible for thrombolytic therapy.4 Therefore, fast and accurate estimation of ischemic stroke onset time in clinical settings is important for identifying eligible patients for therapeutic intervention. MRSI has long been recognized as a potentially powerful noninvasive tool for the detection of neurometabolic alterations in ischemic stroke, which showed great promise for the assessment of ischemia onset time.5,6 However, the poor spatial resolution of current MRSI techniques limits our capability to detect metabolic changes within the focal lesions. Moreover, the long acquisition time impedes its clinical utility in acute stroke imaging. In this study, we applied a fast high-resolution 3D MRSI technique, called SPICE (SPectroscopic Imaging by exploiting spatiospectral CorrElation),7-10 to investigate the relation of neurometabolic concentrations within the ischemic lesion to time after symptom onset in ischemic stroke patients. Our experimental results showed that NAA concentration within the ischemic lesion decreased in a time-dependent manner after stroke onset, which may provide a useful metabolic biomarker for assessment of symptom onset time.Methods
Thirty-eighty ischemic stroke patients were prospectively recruited in this study. Exclusion criteria included the presence of a contraindication for MRI, hemorrhage, or a non-stroke lesion on structural MRI. All the MR scans were performed on a 3.0T Siemens Skyra scanner. The patients were scanned at 2.25 to 134.78 hours after symptom onset. Six patients received follow-up scans at 50.28 to 167.92 hours after onset, thus yielding a total of 44 subject samples. This study was approved by the Institutional Review Board of the Fifth People’s Hospital of Shanghai, China. Written informed consent was obtained from all participants.The data acquisition protocol included 3D MRSI scan using the SPICE sequence (TR/TE = 160/1.6 ms, resolution = 2.0 x 3.0 x 3.0 mm3, FOV = 240 x 240 x 120 mm3, scan time = 8 min), 3D MPRAGE imaging (TR/TE/TI = 2400/2.13/1100 ms, resolution = 1.0 x 1.0 x 1.0 mm3, FOV = 256 mm, 192 slices), diffusion-weighted imaging (DWI) (TR/TE = 8300/74 ms, resolution = 2 x 2 x 2 mm3, FOV = 256 mm, 75 slices, b = 1000 s/mm2), and 3D Fluid-Attenuated Inversion Recovery (FLAIR) imaging (TR/TE/TI = 5000/395/1800 ms, resolution = 1.0 x 1.0 x 1.0 mm3, FOV = 256 mm, 192 slices).
The spatiospectral functions from the SPICE data were reconstructed using a union-of-subspaces model, incorporating pre-learned spectral basis functions.7,8 Spectral quantification was done using an improved LCmodel-based algorithm.9,10 For images acquired within 3 days of symptom onset, the ischemic lesions were defined by applying a threshold at 620×10-6 mm2/s to the ADC data.11 For images acquired after 3 days of symptom onset, the ischemic lesions were delineated manually on the FLAIR images. All of the masks were inspected by an experienced neuroradiologist and manually corrected where necessary. The ADC, DWI, FLAIR maps, and the corresponding tissue masks were all coregistered to the MRSI images (metabolic maps) using an affine linear transformation with 12 degrees of freedom.12
We performed statistical analysis using SPSS 25 (IBM). The neurometabolites concentrations over different time windows were compared using Mann Whitney tests. Pearson correlation analysis was performed to investigate the relationship between neurometabolic concentrations and time after stroke onset in the acute stage. A nonlinear model fitting was performed for the data points over the first week after stroke onset, considering the fact that signal changes reached an asymptote at later times.
Results
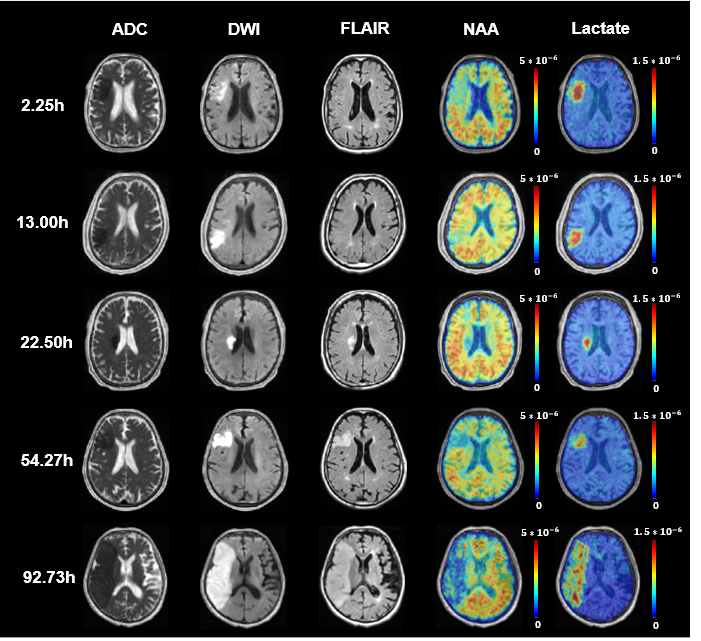
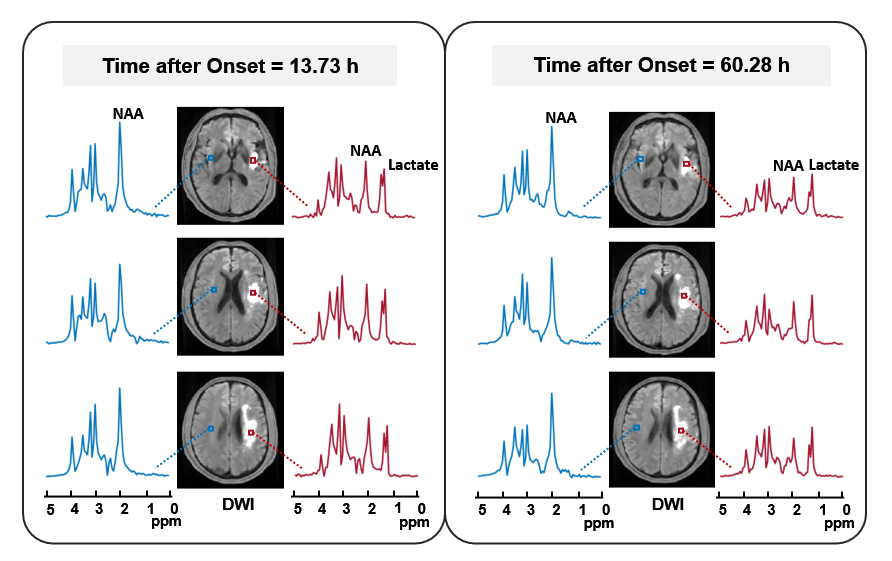
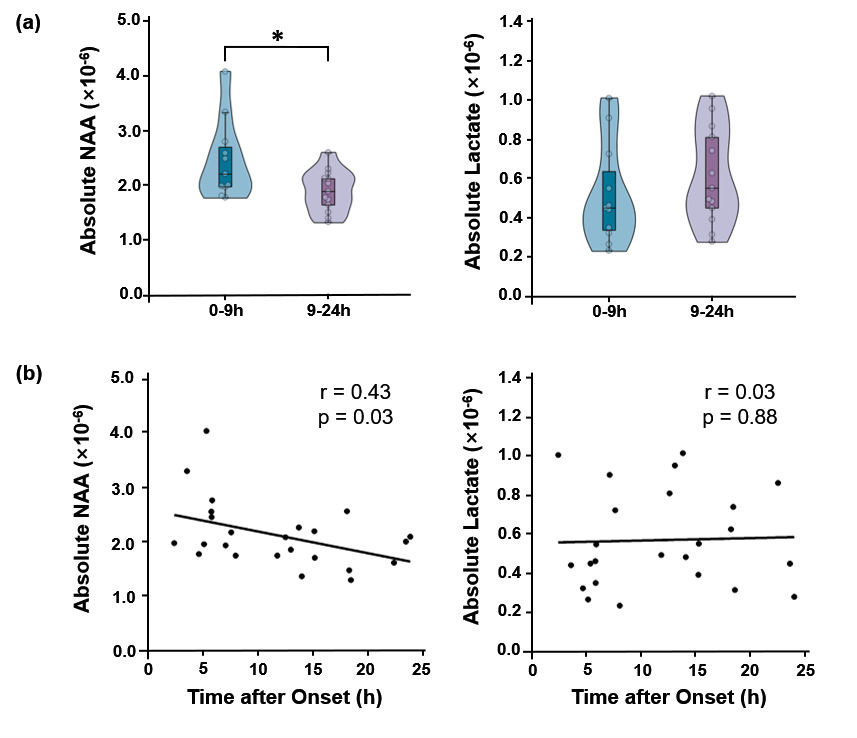
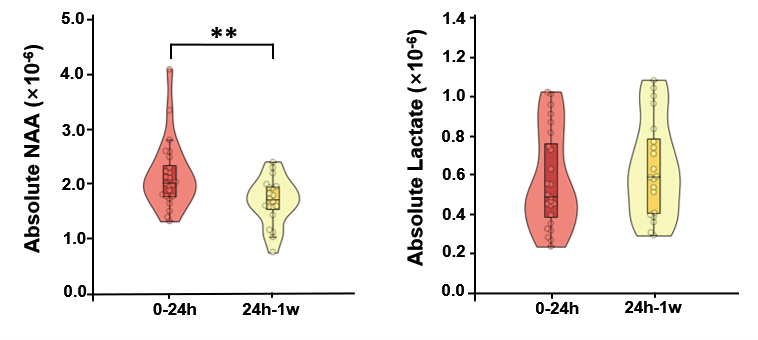
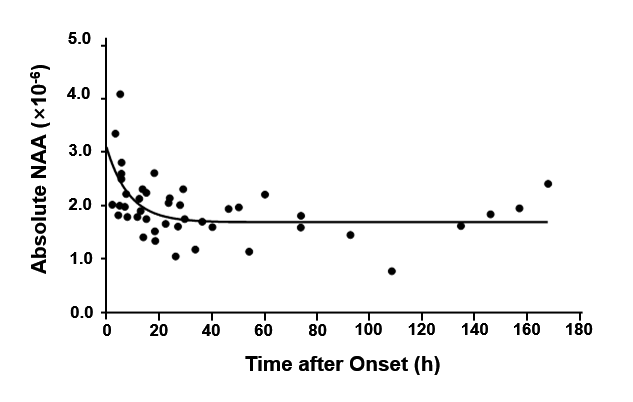
Multimodal images including DWI, ADC, FLAIR, and MRSI maps from five representative patients at 2.25 to 92.73 hours after ischemic stroke are shown in Fig. 1. NAA reduction was visible within the lesion area and decreased with time. Figure 2 compares the localized spectra from the ischemic lesion of a patient scanned at 13.73 hours and 60.28 hours after stroke, respectively. The spectra show reduced NAA at the later time points as compared with the earlier time points. For the acute stage patients (< 24h), a significant reduction of NAA was observed from within to over 9 hours window (p < 0.05), as shown in Fig. 3(a). A significant negative correlation between NAA and time after onset was found, but not for lactate, as shown in Fig. 3(b). Moreover, significant differences of lesion NAA level were found between acute (< 24 h) and subacute (24h - 1w) stages (p < 0.01) (Fig. 4). Figure 5 shows the lesion NAA levels over all 44 time points (2.25 to 167.92 hours), revealing a nonlinear decrease of NAA concentration.Conclusion
Our study shows that NAA concentration within the ischemic stroke lesion decreased in a time-dependent manner after stroke onset. The finding may suggest a useful metabolic biomarker for determination of stroke symptom onset time.Acknowledgements
Y. L. is funded by National Science Foundation of China (No.61671292 and 81871083) and Shanghai Jiao Tong University Scientific and Technological Innovation Funds (2019QYA12).References
1. Hacke W, Kaste M, Bluhmki E, et al. Thrombolysis with alteplase 3 to 4.5 hours after acute ischemic stroke. N Engl J Med. 2008; 359:1317-1329.
2. Fransen PS, Berkhemer OA, Lingsma HF, et al. Time to reperfusion and treatment effect for acute ischemic stroke: a randomized clinical trial. JAMA Neurol. 2016; 73:190-196.
3. Hacke W, Albers G, Al-Rawi Y, et al. The Desmoteplase in Acute Ischemic Stroke Trial (DIAS): a phase II MRI-based 9-hour window acute stroke thrombolysis trial with intravenous desmoteplase. Stroke. 2005; 36:66-73.
4. Barber PA, Zhang J, Demchuk AM, et al. Why are stroke patients excluded from TPA therapy? An analysis of patient eligibility. Neurology. 2001; 56:1015-1020.
5. Berthet C, Xin L, Buscemi L, et al. Non-invasive diagnostic biomarkers for estimating the onset time of permanent cerebral ischemia. J Cereb Blood Flow Metab. 2014; 34:1848-1855.
6. Maniega SM, Cvoro V, Chappell FM, et al. Changes in NAA and lactate following ischemic stroke: a serial MR spectroscopic imaging study. Neurology. 2008; 71:1993-1999.
7. Fan L, Ma C, Clifford B, et al. High-resolution 1H-MRSI of the brain using SPICE: data acquisition and image reconstruction. Magn Reson Med. 2016; 76:1059-1070.
8. Peng X, Lam F, Li Y, et al. Simultaneous QSM and metabolic imaging of the brain using SPICE. Magn Reson Med. 2018; 79:13-21.
9. Li Y, Lam F, Clifford B, et al. A subspace approach to spectral quantification for MR spectroscopic imaging. IEEE Trans Biomed Eng. 2017; 64:2486-2489.
10. Ma C, Lam F, Johnson CL, et al. Removal of nuisance signals from limited and sparse 1H MRSI data using a union-of-subspaces model. Magn Reson Med. 2016; 75:488-497.
11. Harston GW, Tee YK, Blockley N, et al. Identifying the ischaemic penumbra using pH-weighted magnetic resonance imaging. Brain. 2015; 138:36-42.
12. Jenkinson M, Beckmann CF, Behrens TE, et al. FSL. Neuroimage. 2012; 62:782-790.
Figures