0872
Application of MRI-based oxygen extraction fraction mapping in ischemic stroke1Tongji Hospital, Tongji Medical College, Huazhong University of Science and Technology, Wuhan, Hubei, China
Synopsis
This study aims to investigate spatiotemporal evolution of cerebral oxygen extraction fraction (OEF) in ischemic stroke with an MRI-based vascular-challenge-free method. The OEF of the infarcted area descends continuously from acute to chronic phase. Meanwhile, there exists tissue that is likely to be penumbra in the acute diffusion lesion, of which the OEF shows an increasing trend with time, suggesting timely reperfusion in this region. This MRI-based OEF mapping can precisely capture the heterogenous character of brain oxygen metabolism at different phases of ischemic stroke.
Introduction
Selection of optimal treatments for patients suffering ischemic stroke depends largely on the physiological imaging. Oxygen extraction fraction (OEF) is a hallmark of at-risk tissue in ischemic stroke and can be quantified by various imaging methods. In this study, we used a newly developed MRI-based vascular-challenge-free method called cluster analysis of time evolution for quantitative susceptibility mapping (QSM) and quantitative blood oxygen level-dependent magnitude (qBOLD) (CAT-based QQ) model for spatiotemporal evolution assessment of OEF in ischemic stroke.Materials and methods
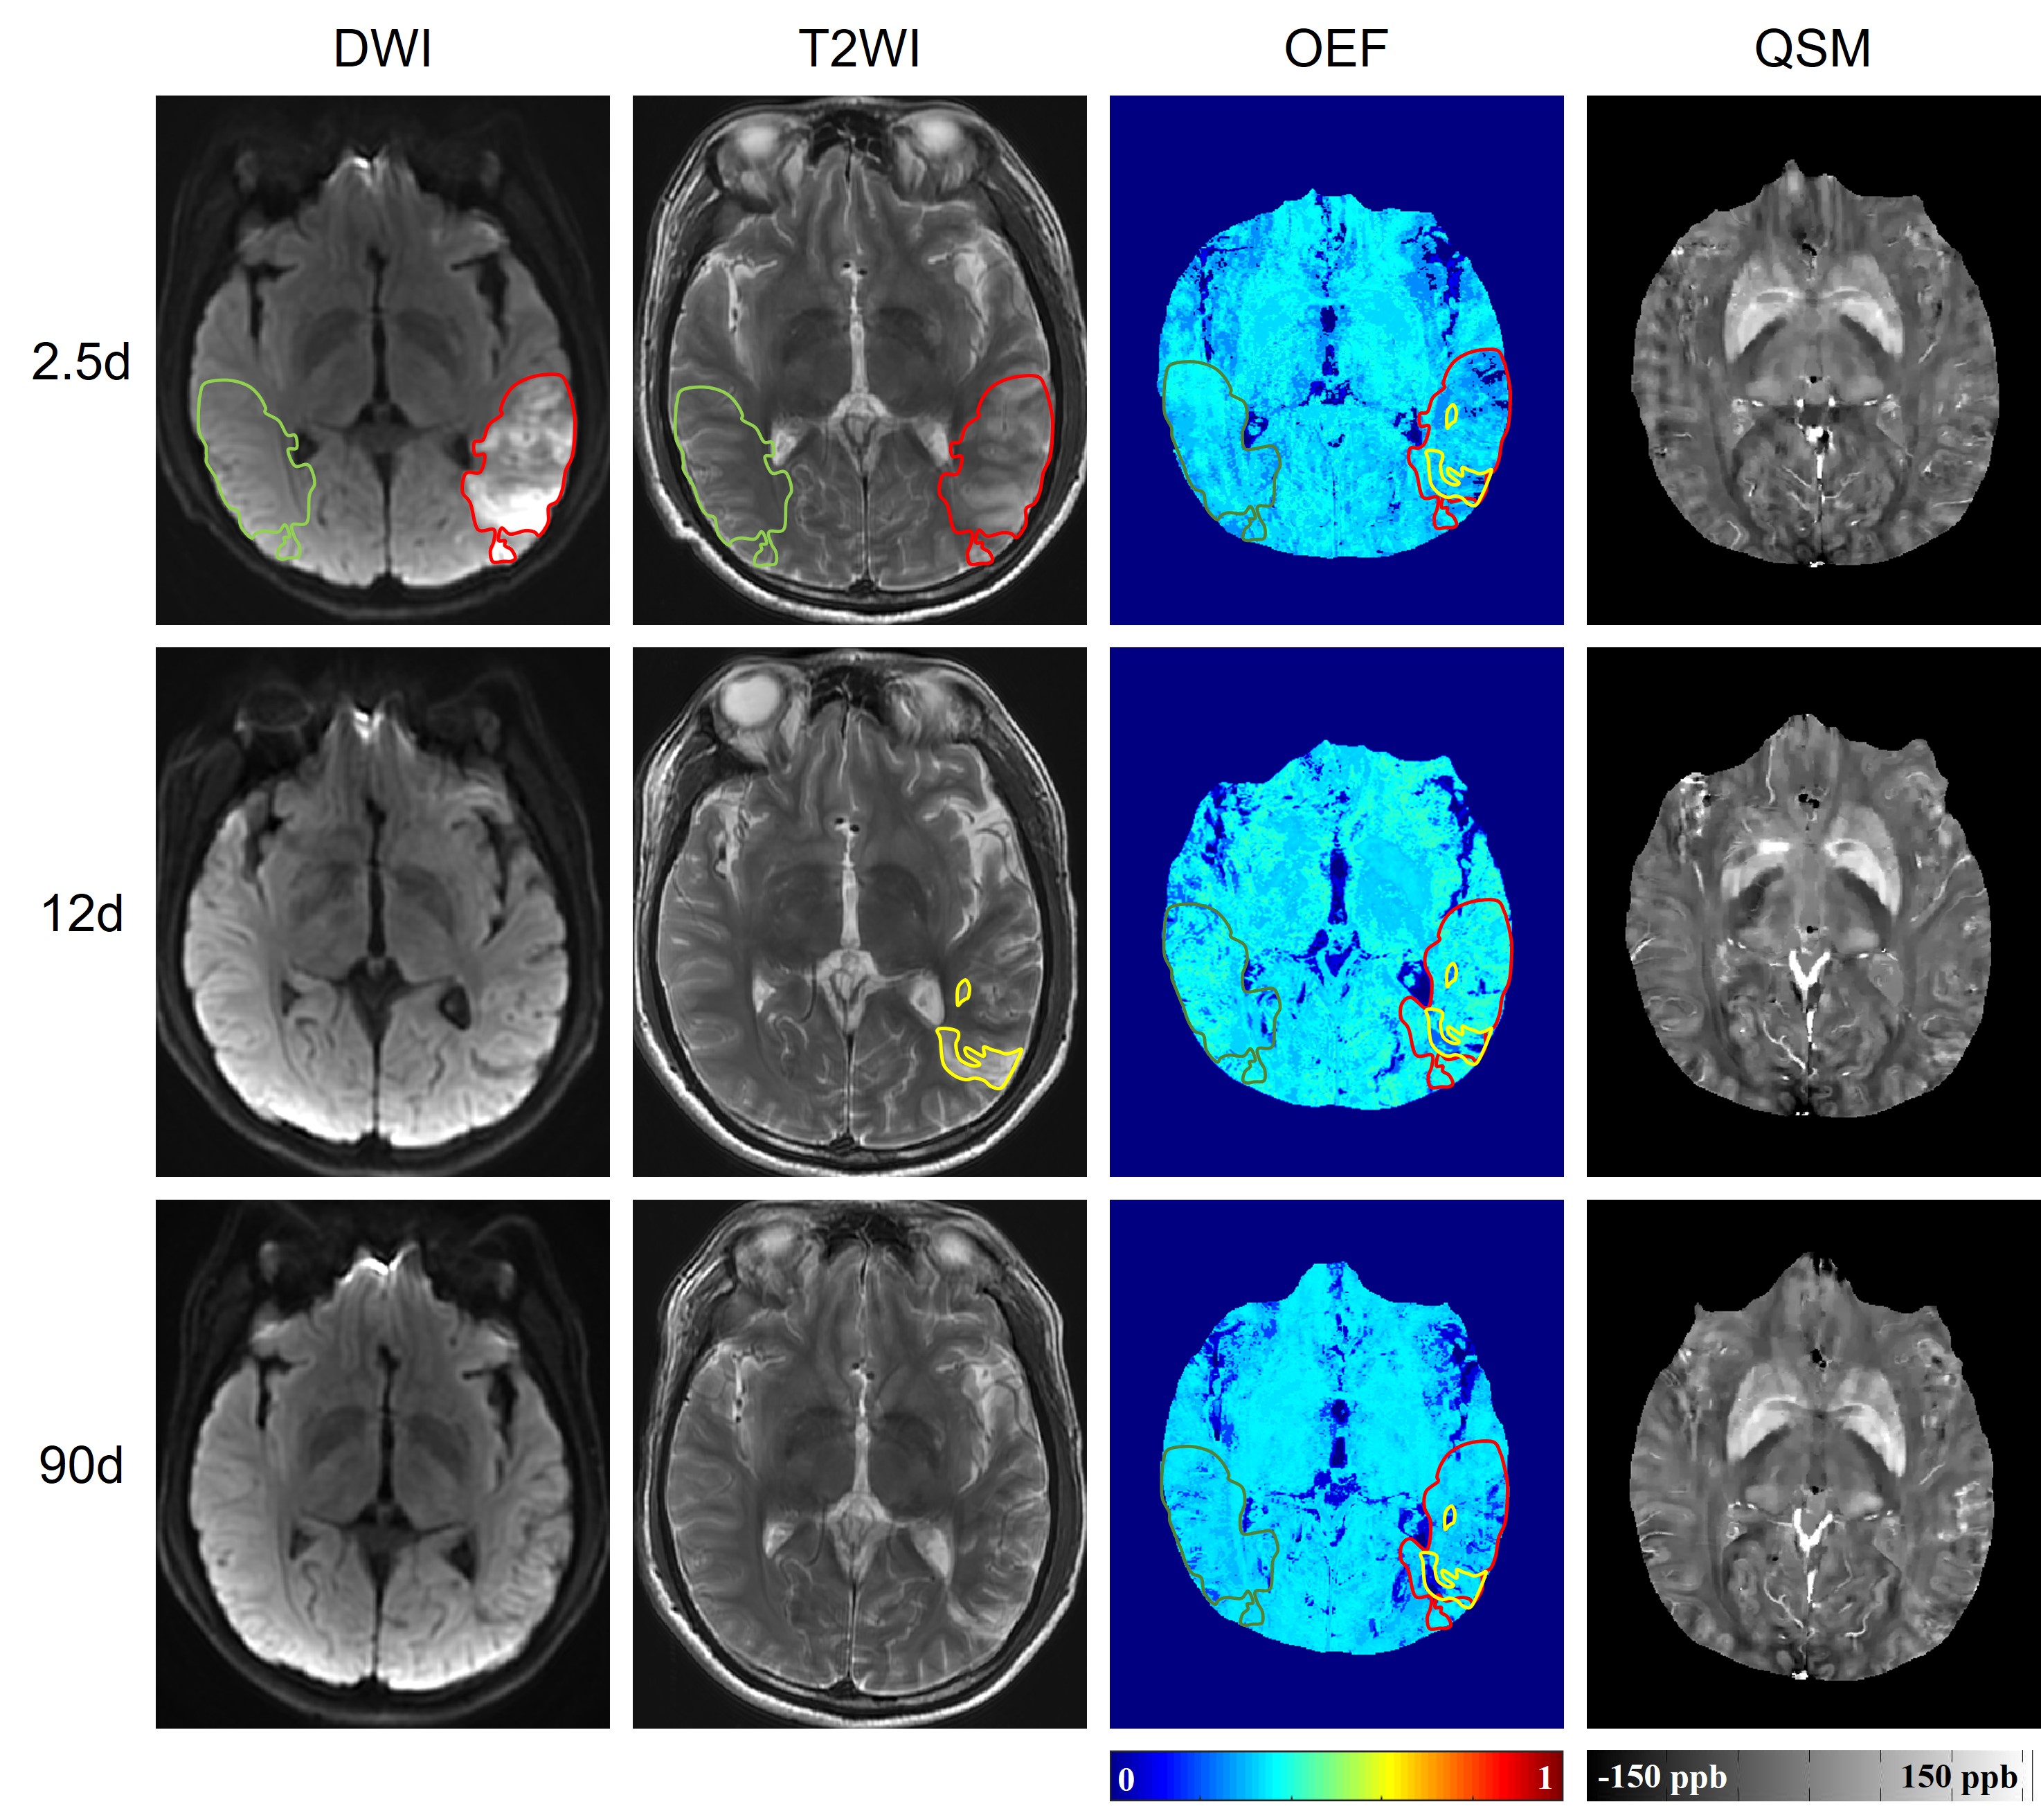
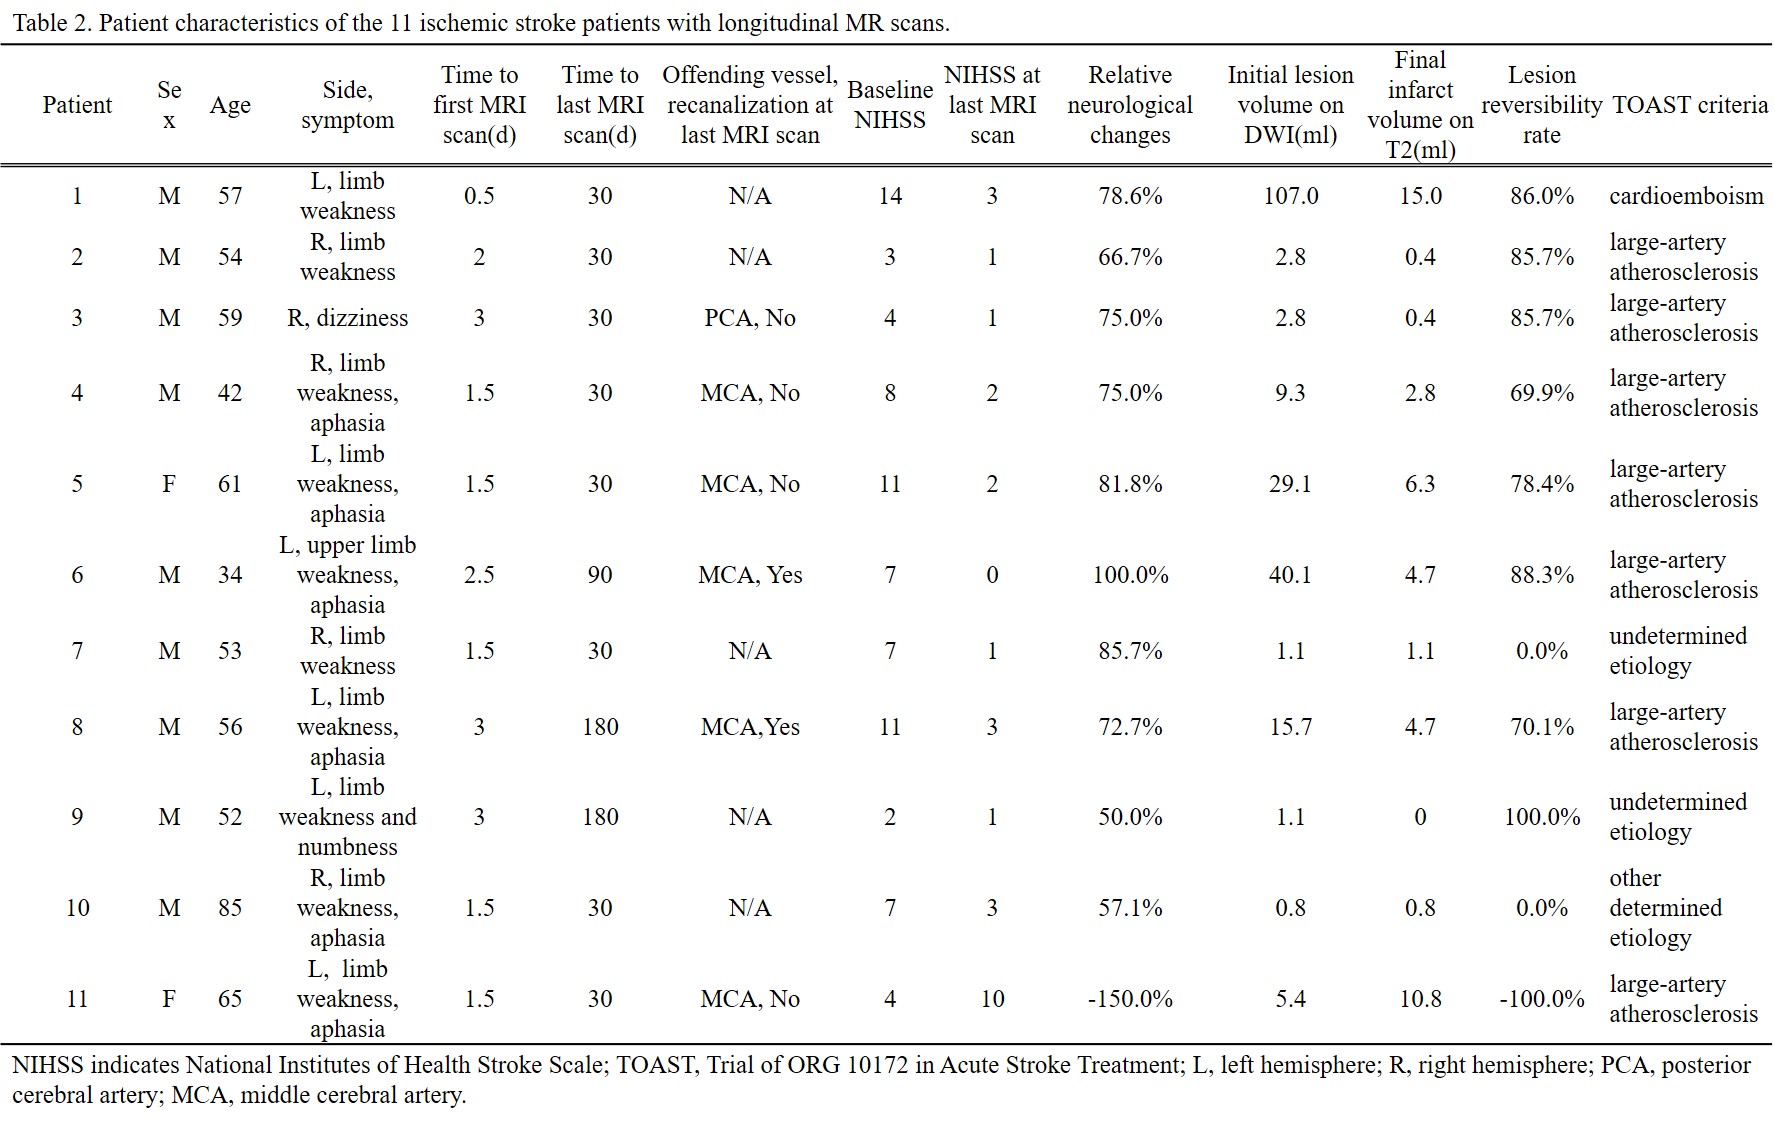
Patients: This study was approved by the ethics committee of local institution. 115 patients (87 males, 25-85 years) being diagnosed with first-ever unilateral ischemic stroke were retrospectively collected. National Institutes of Health Stroke Scale (NIHSS) on the same day with MR scan was recorded. According to the time interval from stroke symptom onset to MR scan, patients were divided into four groups: 1) acute phase (≤1d); 2) early subacute phase (1-7d); 3) late subacute phase (8-14d); 4) chronic phase (>14d). Eleven of these patients received three longitudinal MR scans, the first MR scan was performed within 3 days (0.5d-3d) from symptom onset, the second was at around 10d before hospital discharge, and the last was between 1-3 months by clinic visit. Image protocol: On a 3 Tesla MRI scanner (Discovery MR750, GE Healthcare) with a 32-channel head coil, conventional T1-Weighted Image (T1WI), T2-Weighted Image (T2WI), Diffusion-Weighted Image (DWI), 3D multi-echo Gradient Echo (GRE) images were acquired. Image processing: QSM was reconstructed from 3D multi-echo GRE data using a fully automated zero-referenced Morphology Enabled Dipole Inversion (MEDI+0) method that uses the ventricular cerebrospinal fluid (CSF) as a zero reference.1 OEF maps were calculated using CAT-based QQ model.2 Region of interests (ROIs): Of the 115 patients, the infarcted area was drawn on DWI. Of the 11 patients with longitudinal MR scans, the initial diffusion lesion was defined as hypertension on first DWI, the final infarct as hypertension on T2WI at late subacute phase and they were copied on to the images from all other MRs in order to characterize the temporal changes. All ROIs were mirrored to the contralateral hemisphere and overlaid to the co-registered OEF maps for extraction of OEF and relative OEF (rOEF, compared to the contralateral mirror area) (Fig. 1).Results
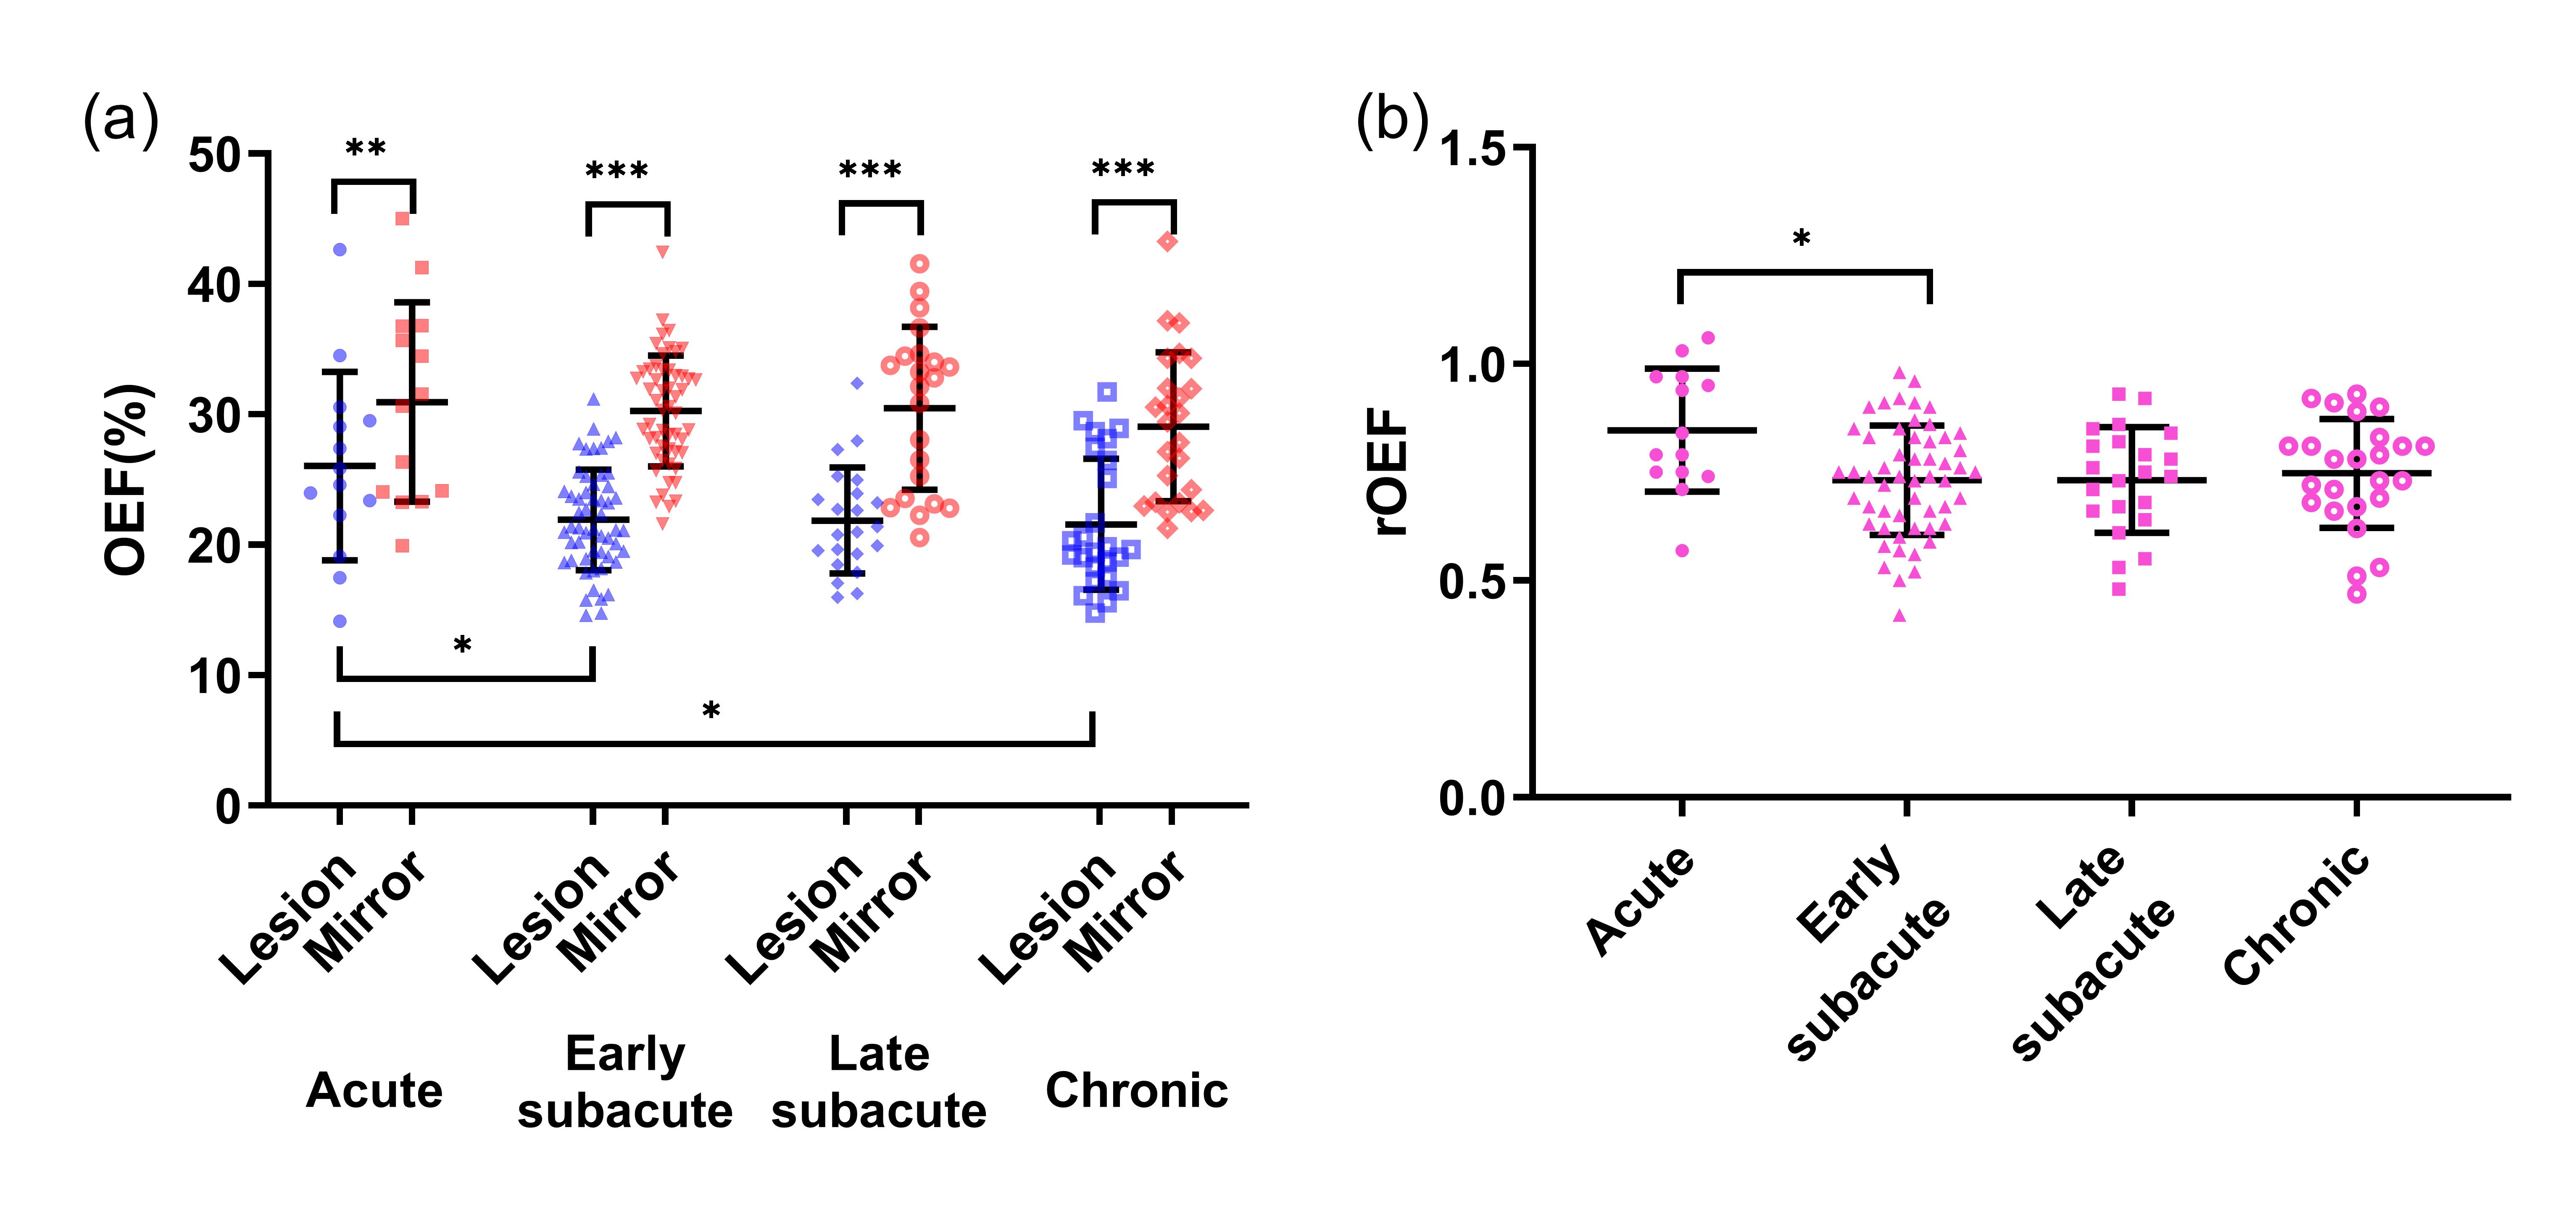
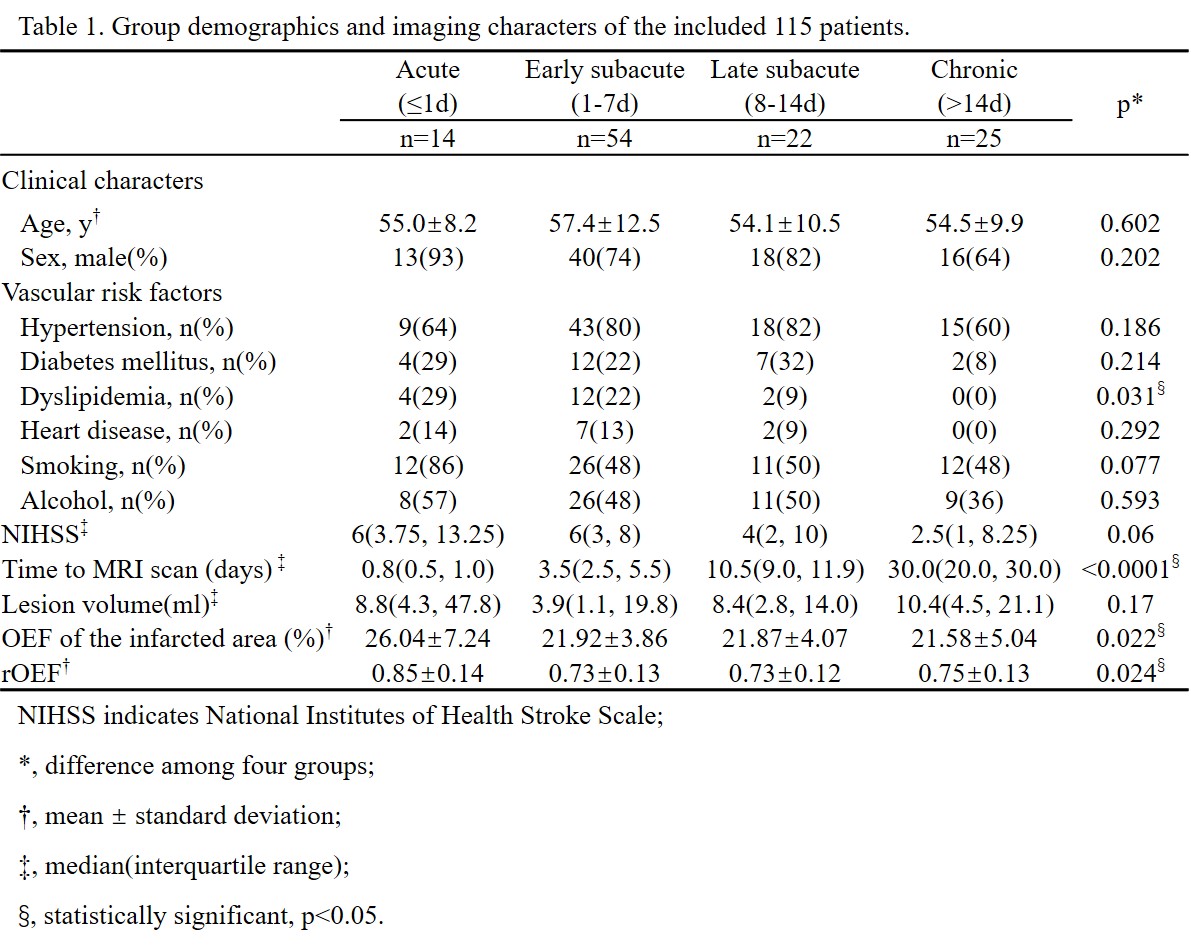
Cross-sectional comparisons of OEF and rOEFDemographic information of the 115 patients is shown in Table 1. The OEF of the infarcted area was significantly lower than that of contralateral mirror area regardless of stroke phase (acute phase: infarcted area 26.04±7.24% versus mirror 30.95±7.65%, p = 0.001; early subacute phase: 21.92±3.86% versus 30.27±4.25%, p < 0.001; late subacute phase: 21.87±4.07% versus 30.48±6.23%, p < 0.001; chronic phase: 21.58±5.04% versus 29.06±5.72%, p < 0.001). Besides, both OEF and rOEF of the infarcted area showed significant differences among four stroke phases (p=0.022 and 0.024, respectively) with a trend of decline from acute to chronic phase (Fig. 2).
Longitudinal comparisons of OEF and rOEF
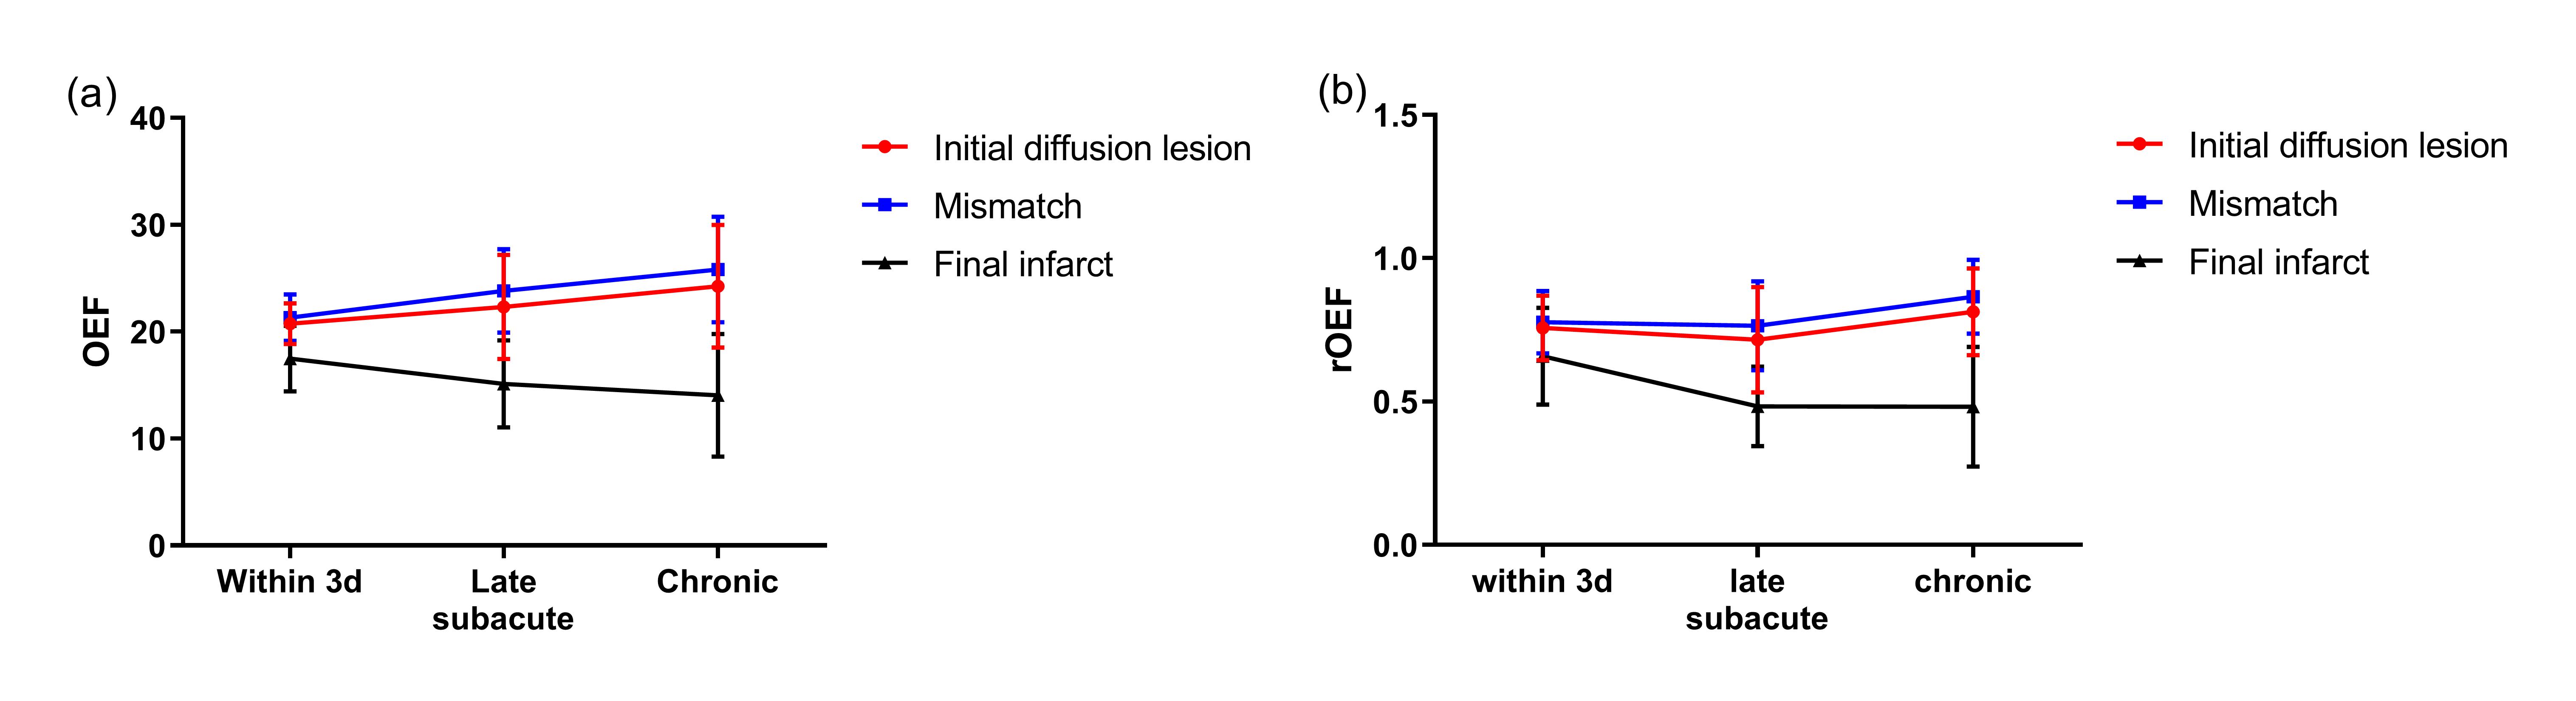
In 8 of the 11 patients with longitudinal MR scans, the volume of final infarct was found to be smaller than initial diffusion lesion (Table 2), indicating a regional diffusion reversal which we defined as mismatch area. OEF and rOEF of the final infarct showed a trend of decrease with time, while those of the initial diffusion lesion and the mismatch area increased. Note that only increasing trend of OEF of the mismatched area reached statistical significance (Fig. 3).
Discussion
OEF is a parameter that directly reflects brain metabolism and can be used to predict salvageable tissue in acute ischemic stroke.3 In this report, we explored the spatiotemporal evolution of OEF in ischemic stroke using a novel vascular-challenge-free CAT-based QQ method. In the early stage of ischemic stroke, the brain tissue compensatively extracts more oxygen leading to increased OEF. Without timely reperfusion, the OEF starts to decrease indicating functional impairment and cell death.4 In our cross-sectional investigation, the decreasing trend of OEF from acute to chronic phase was consistent with the pathophysiology. In 8 of the 11 patients with longitudinal MR scans, we observed diffusion reversal according to smaller final infarct volume compared to initial diffusion lesion. The OEF of this mismatch area continuously increased with time. The reasons include but do not limit to early autonomous reperfusion within regions of acute restricted diffusion which leads to tissue recovery.5, 6 Therefore, different from traditional ischemic penumbra delineated by DWI and perfusion-weighted image (PWI), DWI lesion also contains penumbral tissue which could survive with timely reperfusion.Conclusion
The evolution of OEF in ischemic stroke lesions is heterogeneous, suggesting underlying complicated hemodynamic and pathophysiological mechanisms. The OEF map generated by the CAT-based QQ method disclosed selective viability of diffusion lesions apart from the conventional penumbra which hints at a more positive clinical treatment.Acknowledgements
Funding: This study was supported by the National Natural Science Foundation of China (Grants No.81801666, 81730049 and 81570462).References
1. Liu Z, Spincemaille P, Yao Y, Zhang Y and Wang Y. MEDI+0: Morphology enabled dipole inversion with automatic uniform cerebrospinal fluid zero reference for quantitative susceptibility mapping. Magn Reson Med. 2018; 79: 2795-803.
2. Cho J, Zhang S, Kee Y, et al. Cluster analysis of time evolution (CAT) for quantitative susceptibility mapping (QSM) and quantitative blood oxygen level-dependent magnitude (qBOLD)-based oxygen extraction fraction (OEF) and cerebral metabolic rate of oxygen (CMRO2 ) mapping. Magnetic resonance in medicine. 2020; 83: 844-57.
3. Fan AP, Khalil AA, Fiebach JB, et al. Elevated brain oxygen extraction fraction measured by MRI susceptibility relates to perfusion status in acute ischemic stroke. Journal of cerebral blood flow and metabolism : official journal of the International Society of Cerebral Blood Flow and Metabolism. 2020; 40: 539-51.
4. Zhang S, Cho J, Nguyen TD, et al. Initial Experience of Challenge-Free MRI-Based Oxygen Extraction Fraction Mapping of Ischemic Stroke at Various Stages: Comparison With Perfusion and Diffusion Mapping. Frontiers in neuroscience. 2020; 14: 535441.
5. Olivot JM, Mlynash M, Thijs VN, et al. Relationships Between Cerebral Perfusion and Reversibility of Acute Diffusion Lesions in DEFUSE Insights from RADAR. Stroke. 2009; 40: 1692-7.
6. Labeyrie MA, Turc G, Hess A, et al. Diffusion lesion reversal after thrombolysis: a MR correlate of early neurological improvement. Stroke. 2012; 43: 2986-91.
Figures