0870
Pseudo-Continuous Arterial Spin Labeling using Multiple Label- and Post-Label Duration with Dynamically Optimized Background Suppression1Philips Japan, Tokyo, Japan, 2Department of Molecular Imaging & Diagnosis, Graduate School of Medical Sciences, Kyushu University, Fukuoka, Japan, 3Division of Radiology, Department of Medical Technology, Kyushu University Hospital, Fukuoka, Japan, 4Philips Healthcare, Best, Netherlands, 5Philips Healthcare, Tokyo, Japan
Synopsis
The arterial transit time (ATT) calculated from multiple time points pseudo continuous arterial spin labeling (pCASL) has recently attracted attention. To calculate ATT accurately, while ensuring reliable SNR, we propose multiple repetition time (multi-TR) scheme, that is TR is varied according to the label duration (LD) and post label delay (PLD) with dynamically optimized BGS and 3D acquisition. The multi points data is efficiently acquired and scan time is less than 3 minutes for whole brain coverage. We conducted a feasibility test. Reliable background suppression effectiveness for all time points and a significant SNR gain were confirmed in healthy volunteers.
Introduction
The dynamic observation of perfusion using pseudo continuous arterial spin labeling (pCASL) has recently attracted attention1-11. The arterial transit time (ATT) calculated from dynamic scheme has been suggested to be clinically useful in addition to cerebral blood flow (CBF) in neuro vascular disease1,3,6,7.There are two main approaches to calculate ATT. One is to acquire sufficient dynamic data using short range (shorter than 1000ms) of label durations (LDs) and post label delays (PLDs) for accurate ATT estimation such as Time-Encoded ASL1,5, and the other is to acquire the dynamic data using long range (longer than 1500ms) of LDs to ensure high signal to noise ratio (SNR), but limiting the number of dynamics1,2,5. From scan time point of view, it is difficult to optimize the scheme for both accurate ATT and CBF estimation. As a solution, the multiple repetition time (multi-TR) scheme was proposed to use multiple, varying LDs and multiple PLDs8. This scheme covers from early time point (short LD and short PLD) to late time point (long LD and long PLD) effectively. In the previous report however, 3D acquisition and background suppression (BGS) was not used, which does not meet current recommendations12. The purpose of this study is to validate the feasibility of a multi-TR scheme with BGS optimized for each LD-PLD combination and 3D acquisition for whole brain coverage.
Method
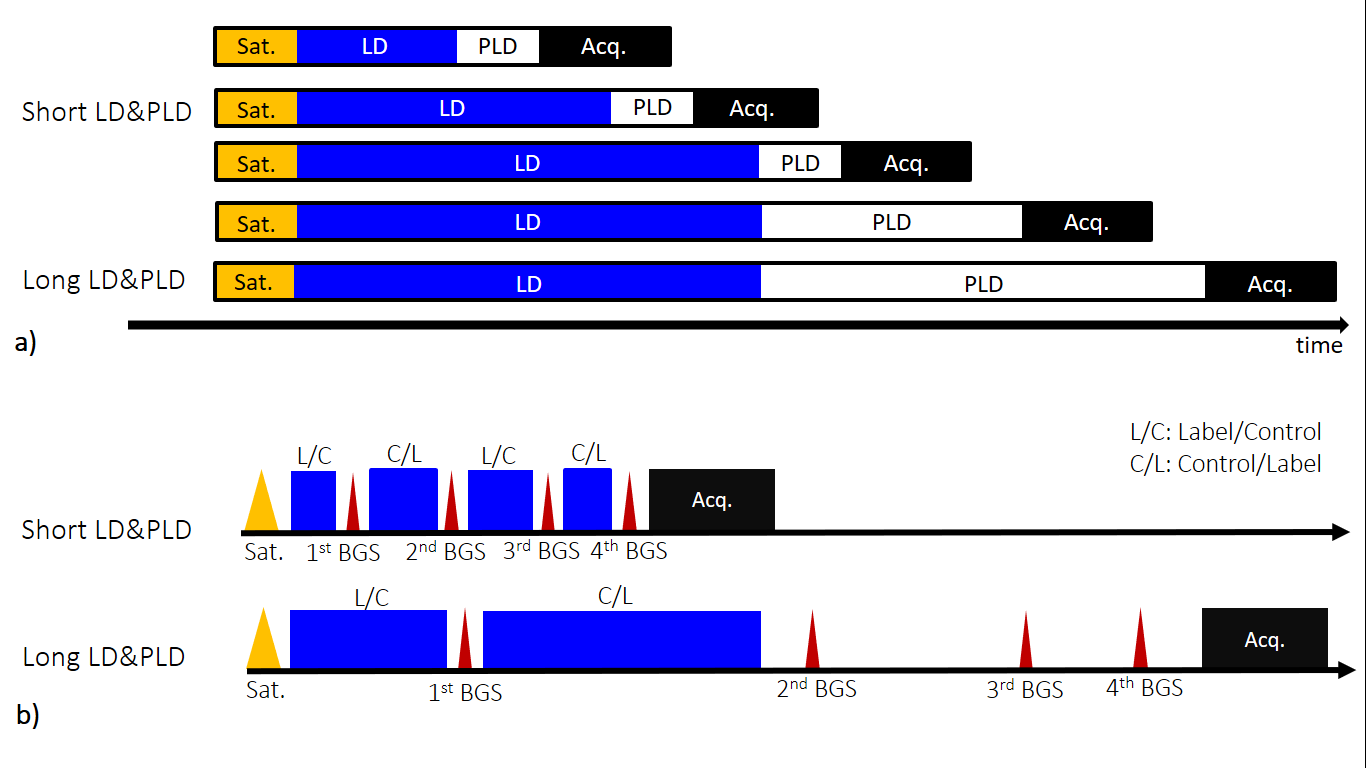
multi-TR Scheme with BGSThe multi-TR scheme is illustrated in Figure 1a. The dynamic ASL data were acquired by changing LD and PLD. Four BGS pulses were inserted in LD and PLD11,13. The BGS timing was optimized dynamically according to the saturation delay (sat. delay) that is the time between the saturation pulse applied in front of LD module and data acquisition as shown in Figure 1b.
Magnetic Resonance (MR) Experiments
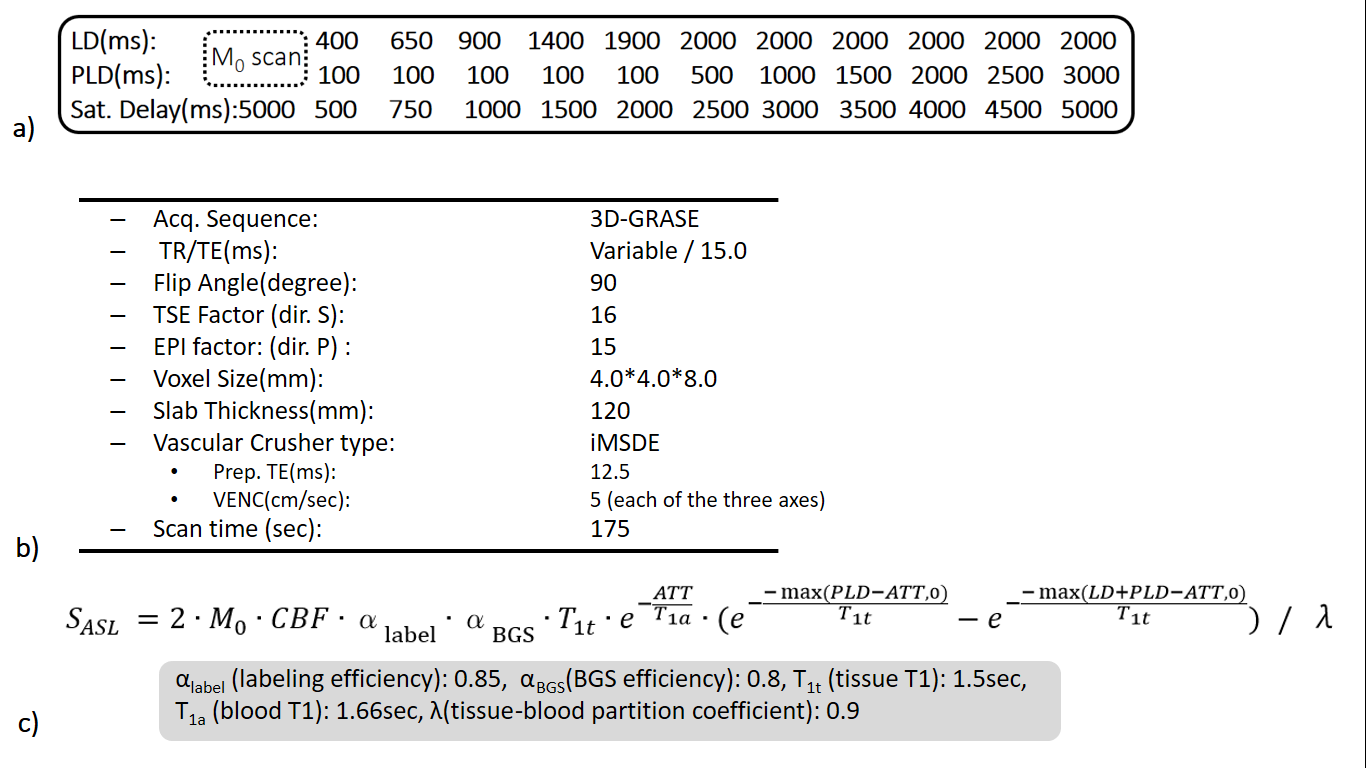
The multi-TR scheme was implemented on a 3.0T Ingenia Elition scanner (Philips, Best, The Netherlands). The actual LDs and PLDs used in this study is explained in Figure 2a. The 3D gradient- and spin-echo (3D-GRASE) was used for acquisition sequence. Improved motion-sensitized driven-equilibrium (iMSDE)14 was used for arterial signal suppression. Detailed sequence parameters are summarized in Figure 2b. Six healthy subjects (mean age 32.3±7.4 years) were examined. To evaluate the validity of the results, pCASL based 4D-MRA was also acquired15,16. Informed consent required by the Institutional Review Board was obtained.
BGS efficacy validation
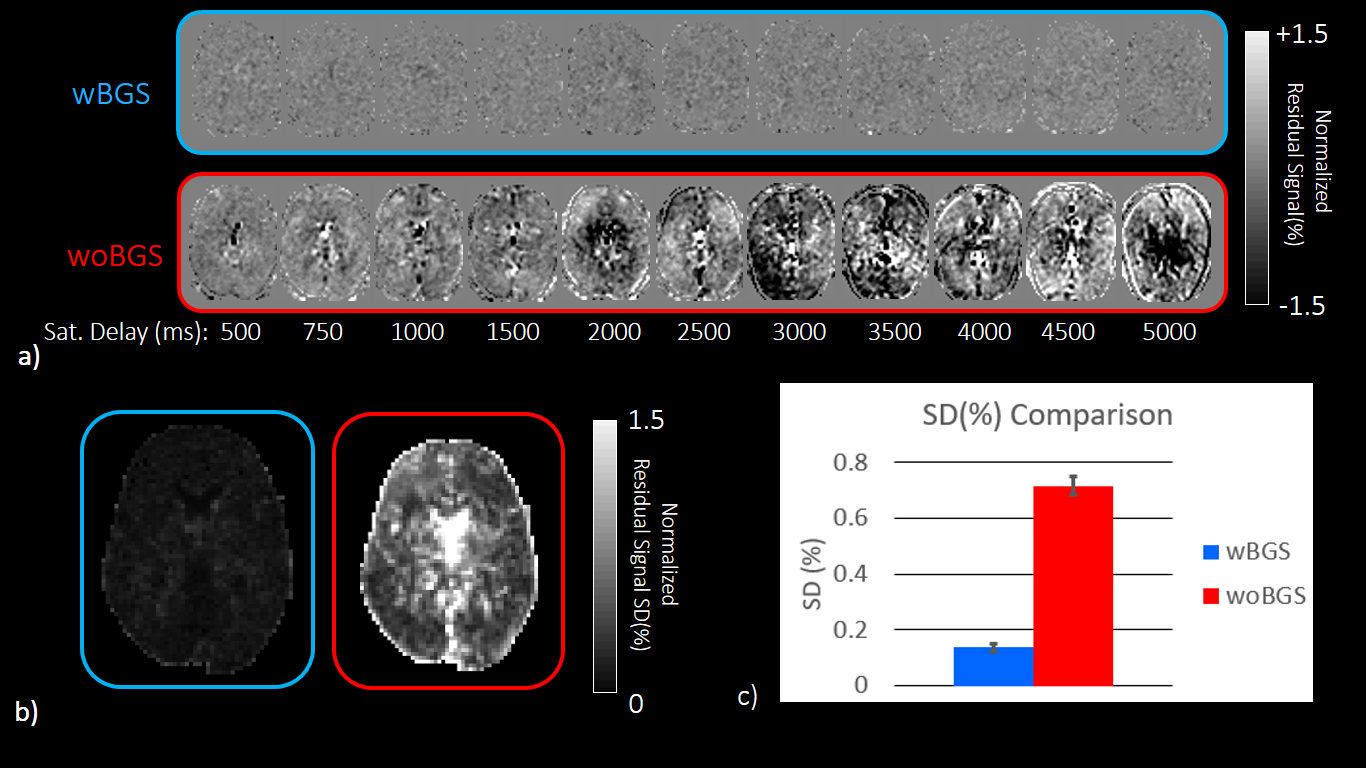
To verify the BGS effect, data was acquired with turning off the radiofrequency pulses (RFs) in control or label module. Since no RFs applied, the two acquisitions corresponding to label and control are identical. Those two images were subtracted and residual signal regarded as noise was normalized by M0, acquired with 5000ms sat. delay. Then standard deviation (SD) for normalized signal changes in time axis was calculated for each voxel on the slice at basal ganglia level. The acquisition was conducted with BGS (wBGS) and without BGS (woBGS) for six volunteers and SDs were compared using paired t-test.
SNR level evaluation
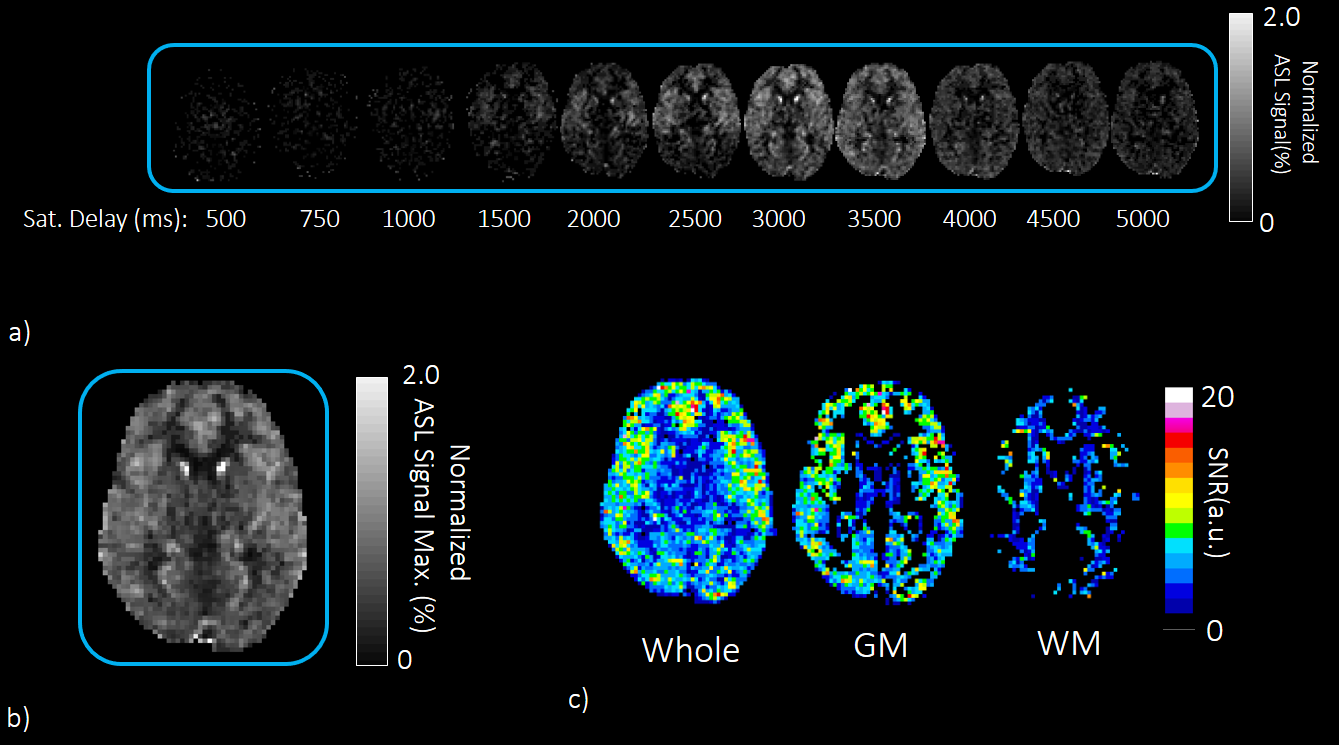
The actual ASL signal acquisition with BGS was applied to six volunteers by applying control and label RFs. To verify the SNR of the subtracted image, residual ASL signal was normalized by M0 and maximum value in time axis was measured for each voxel. Then, the SNR was calculated by dividing the maximum normalized ASL signal by the SD in wBGS scan. The SNR on GM and WM mask created from T1 measurement were calculated and evaluated at basal ganglia level.
ATT and CBF quantification
From dynamic ASL data, CBF and ATT maps were created. The general kinetic model of Buxton17 shown in Figure 2c was used for the calculation by applying a nonlinear fitting.
Results and Discussion
Representative normalized subtracted images in noise scan wBGS and woBGS are shown in Figure 3. Residual signal level and SD are significantly higher in woBGS than that in wBGS (p < 0.001). The averaged SD in wBGS for six volunteers is less than 0.15%. Given that the ASL signal level is around 1.0% to 2.0%, it is important to suppress the background signal to this level.The results of SNR evaluation were shown in Figure 4. It has been observed that the signal change level of the actual ASL in the time axis is from 0.0 to 2.0% in most of the pixels. The averaged SNR on GM and WM for six volunteers was higher than 3.0, indicating reliable SNR level is secured5.
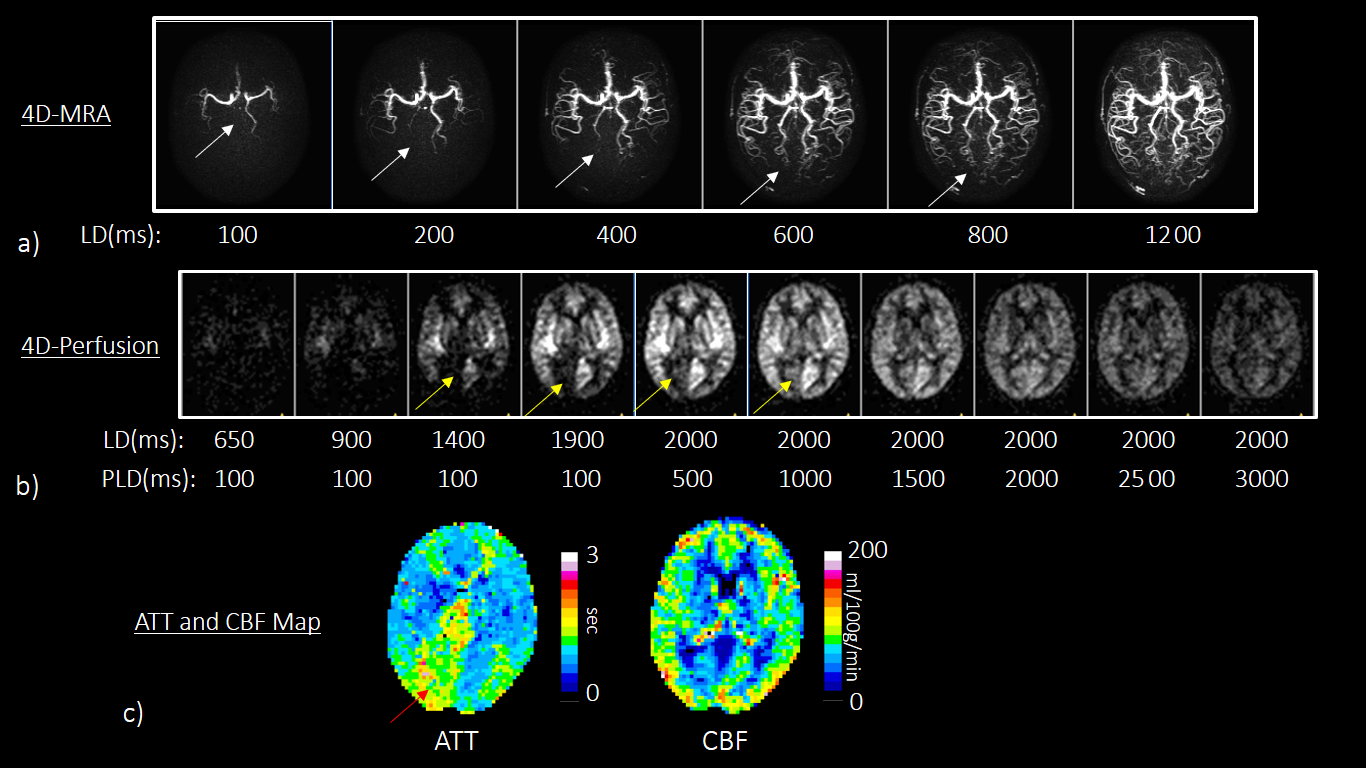
Representative dynamic perfusion was shown in Figure 5. In this case, the 4D-MRA reveals that the left posterior cerebral artery (PCA) is fetal type in which the PCA originates from the internal carotid artery while the right PCA is normal type. The flow signal is increased earlier in the left PCA territory compare to the right PCA territory. The ATT map shows longer ATT in the right PCA territory. These observations are consistent with the 4D-MRA findings.
Conclusion
We conducted a feasibility test of multi-TR PCASL scheme with dynamically optimized BGS and 3D acquisition. Reliable background suppression effectiveness for all time points and a significant SNR gain were confirmed in healthy volunteers. Clinical feasibility of this scheme needs to be validated in future.Acknowledgements
No acknowledgement found.References
[1] Shota Ishida et al. Robust arterial transit time and cerebral blood flow estimation using combined acquisition of Hadamard-encoded multi-delay and long-labeled long-delay pseudo-continuous arterial spin labeling: a simulation and in vivo study. NMR Biomed. 2020;33(8): e4319.
[2] Joseph G Woods et al. A general framework for optimizing arterial spin labeling MRI experiments. Magn Reson Med 2019;81(4): 2474-88.
[3] H J Choi et al. Can Arterial Spin-Labeling with Multiple Postlabeling Delays Predict Cerebrovascular Reserve? AJNR Am J Neuroradiol. 2018;39(1): 84-90.
[4] Peter Jezzard et al. Arterial spin labeling for the measurement of cerebral perfusion and angiography. J. Cereb. Blood Flow Metab. 2018;38(4): 603-26.
[5] Jia Guo et al. Comparing accuracy and reproducibility of sequential and Hadamard-encoded multidelay pseudocontinuous arterial spin labeling for measuring cerebral blood flow and arterial transit time in healthy subjects: A simulation and in vivo study. J Magn Reson Imaging. 2018;47(4): 1119-32.
[6] Tetsuya Tsujikawa et al. Arterial Transit Time Mapping Obtained by Pulsed Continuous 3D ASL Imaging with Multiple Post-Label Delay Acquisitions: Comparative Study with PET-CBF in Patients with Chronic Occlusive Cerebrovascular Disease. PLoS One. 2016;11(6): e0156005.
[7] Guangxiang Chen et al. Patterns of postictal cerebral perfusion in idiopathic generalized epilepsy: a multi-delay multi-parametric arterial spin labelling perfusion MRI study. Sci Rep. 2016;6: 28867.
[8] Megan E Johnston et al. Multi-TI Arterial Spin Labeling MRI with Variable TR and Bolus Duration for Cerebral Blood Flow and Arterial Transit Time Mapping. IEEE Trans Med Imaging 2015;34(6): 1392-402.
[9] Qin Qin et al. Three-dimensional whole-brain perfusion quantification using pseudo-continuous arterial spin labeling MRI at multiple post-labeling delays: accounting for both arterial transit time and impulse response function. NMR Biomed 2014;27(2): 116-28.
[10] Danny J.J. Wang et al. Multi-delay multi-parametric arterial spin-labeled perfusion MRI in acute ischemic stroke - Comparison with dynamic susceptibility contrast enhanced perfusion imaging. Neuroimage Clin. 2013;3: 1-7.
[11] Weiying Dai et al. Reduced resolution transit delay prescan for quantitative continuous arterial spin labeling perfusion imaging. Magn Reson Med. 2012;67(5): 1252-65.
[12] David C Alsop et al. Recommended implementation of arterial spin-labeled perfusion MRI for clinical applications: A consensus of the ISMRM perfusion study group and the European consortium for ASL in dementia. Magn Reson Med. 2015;73(1): 102-16.
[13] Nasim Maleki et al. Optimization of background suppression for arterial spin labeling perfusion imaging. MAGMA 2012;25(2): 127-33.
[14] Obara M et al. Comparison between two types of improved motion-sensitized driven-equilibrium (iMSDE) for intracranial black-blood imaging at 3.0 tesla. J Magn Reson Imaging 2014;40: 824-31.
[15] Togao O et al. 4D ASL-based MR angiography for visualization of distal arteries and leptomeningeal collateral vessels in moyamoya disease: a comparison of techniques. Eur Radiol 2018;28: 4871-81.
[16] Obara M et al. Non-Contrast Enhanced 4D Intracranial MR Angiography Based on Pseudo-continuous Arterial Spin Labeling With the Keyhole and View-Sharing Technique. Magn Reson Med 2018;80: 719-25.
[17] R B Buxton et al. A general kinetic model for quantitative perfusion imaging with arterial spin labeling. Magn Reson Med. 1998;40(3): 383-96.
Figures