0869
Cerebral oxygen extraction fraction (OEF): comparison of challenge-free gradient echo QSM+qBOLD (QQ) with 15O PET in healthy adults1Weill Cornell Medicine, New York, NY, United States, 2Washington University School of Medicine, Saint Louis, MO, United States, 3Banner Alzheimers Institute, Phoenix, AZ, United States
Synopsis
Cerebral oxygen extraction fraction (OEF) maps are critical to investigate salvageable tissue in ischemic stroke. We compare OEF maps obtained using quantitative susceptibility mapping plus quantitative blood oxygen level-dependent modeling (QSM+qBOLD=QQ) with the reference standard OEF maps obtained using 15O PET in 10 healthy adults. The whole brain and regional average OEF values were found to be substantially equivalent between the two methods, e.g. 32.8 ± 6.7 % on PET and 34.2 ± 2.6 % on QQ (p=0.002, TOST) for whole brain average. QQ estimates OEF maps from a single routine MRI sequence without burdensome gas inhalation or respiratory-control procedures.
Introduction
Quantitative mapping of oxygen extraction fraction (OEF) is essential for investigating investigating salvageable tissue and irreversibly damaged core in stroke1-4 and neurologic diseases5,6. Positron emission tomography (PET) with 15O tracers is the current reference standard2, 7-16, but it has not been used in clinical practice because of the need to produce the 15O tracers with 122-second half-lives by a cyclotron within the PET facility8, the cumbersome tracer administration, the complex data processing, and the significant cost.In contrast, MRI is widely available and, recently, a promising comprehensive method using both phase and magnitude signal (QSM+qBOLD, or QQ)17, 18 was introduced to map OEF from multi-echo gradient (mGRE) data alone without burdensome vascular challenges. The purpose of this study is to validate QQ-OEF against the reference standard 15O PET-OEF in healthy adults, which is among the first efforts in MRI based OEF mapping validation.
Method
Data acquisitionQQ was compared with PET in 10 healthy subjects on a PET/MR system (Siemens Biograph 3T mMR). PET data was acquired with sequential administrations of C[15O], O[15O], H2[15O], C[15O], O[15O], and H2[15O]. During PET, MRI was acquired simultaneously. Time-of-flight MR angiography (TOF-MRA) was acquired for image-derived arterial input function (IDAIF): TR=22ms, TE=3.94ms, flip angle = 18º, and voxel size=0.57×0.57×0.70 mm3. During O[15O] PET data acquisition, a mGRE was acquired using TR= 33 ms, TE1/ΔTE/TE10 = 4.7/2.5/28.4 ms, flip angle 15º, bandwidth=465 Hz/pixel, voxel size =0.94×0.94×3 mm3. The mGRE acquisition was repeated to investigate repeatability.
Data processing
QQ-OEF: The QQ model estimates OEF based on the venous deoxyheme-dependent signal in mGRE signal phase using QSM and signal magnitude using qBOLD17, 18. The QSM modeling considers that voxel-wise susceptibility (estimated by MEDI toolbox19-24) is the sum of three susceptibility components: non-blood tissue ($$$\chi_{nb}$$$), plasma, and the hemoglobin (a function of venous oxygenation, $$$Y$$$, and volume, $$$v$$$)25-27. The qBOLD models the mGRE magnitude signal decay by the field contribution within a voxel by the susceptibility difference between blood and surrounding tissue (a function of $$$v$$$, $$$Y$$$, and $$$\chi_{nb}$$$)28, 29. As the QSM and qBOLD commonly have $$$v$$$, $$$Y$$$, and $$$\chi_{nb}$$$, OEF (=$$$1-Y/Y_{a}$$$ where $$$Y_{a}$$$: arteriole oxygenation) can be estimated by the combined model of QSM+qBOLD (QQ). For robust OEF reconstruction against noise, cluster analysis of time evolution (CAT) was used18.
15O PET-OEF: PET-OEF was estimated using two compartmental tracer kinetic modeling8 and IDAIF based on the PET/MR hybrid scanner approach30. Using the tracer kinetic modeling with time-activity curves (TACs), CBF and CBV were estimated from the 15O-water scans9, 31 and 15O-carbon monoxide scans32, respectively. OEF was finally estimated from the 15O-oxygen scans in conjunction with calculated CBF and CBV images33. The linearized version of the original CBF and OEF model was used to avoid performing model fitting with noisy TACs30.
ROI analysis
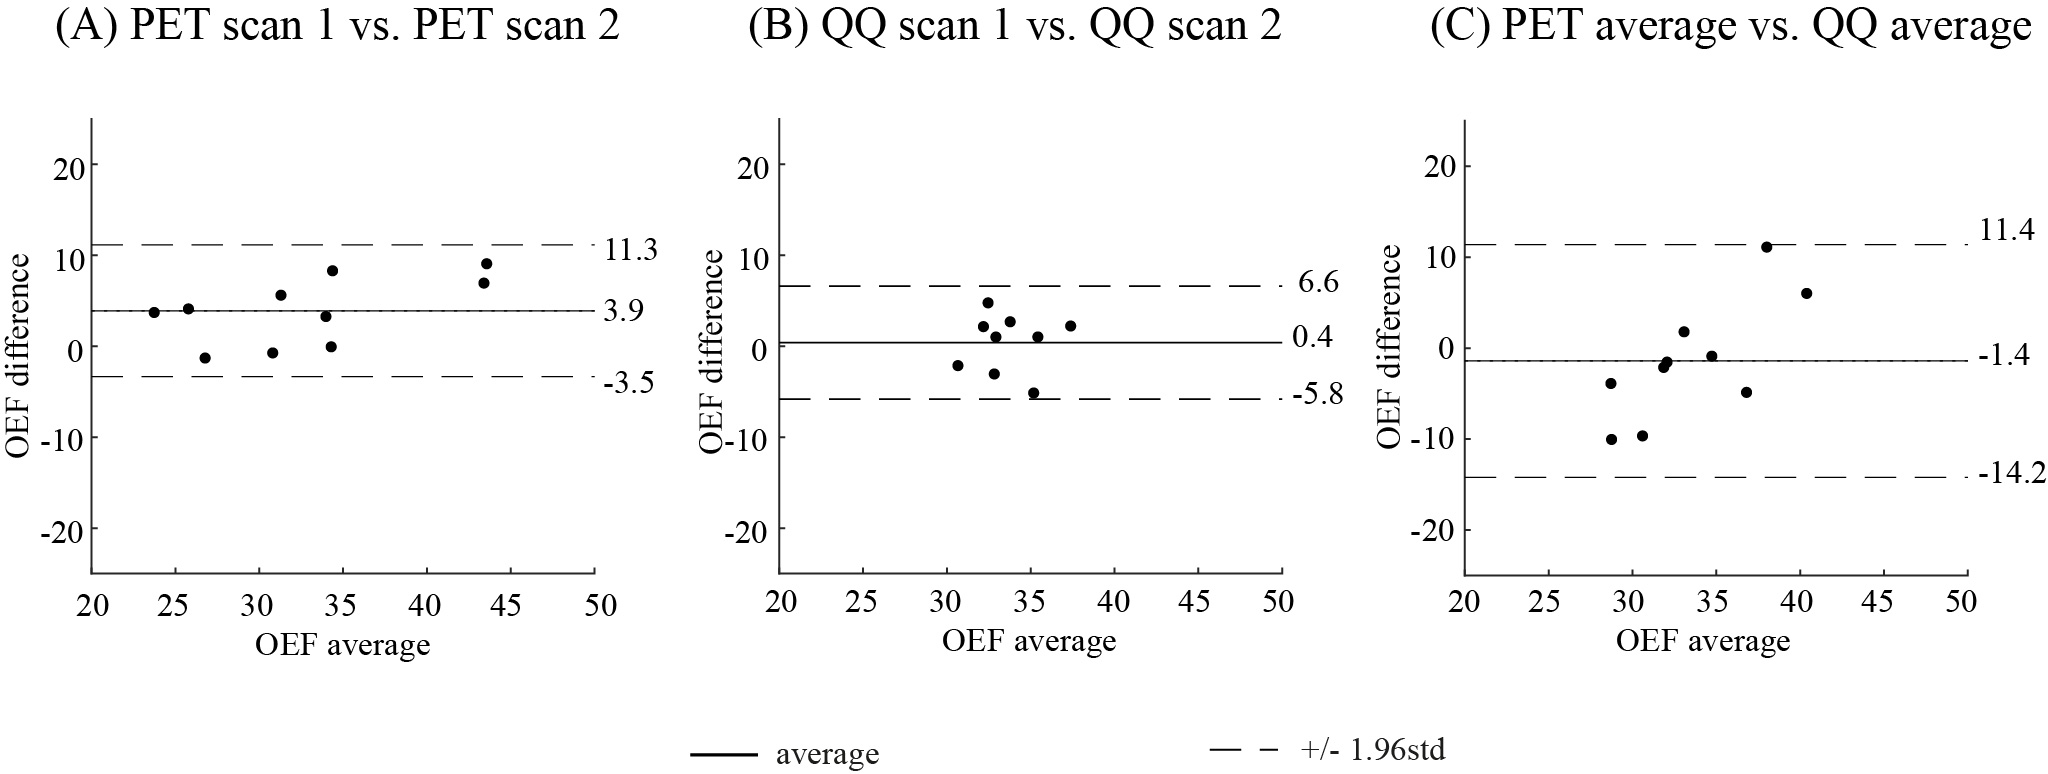
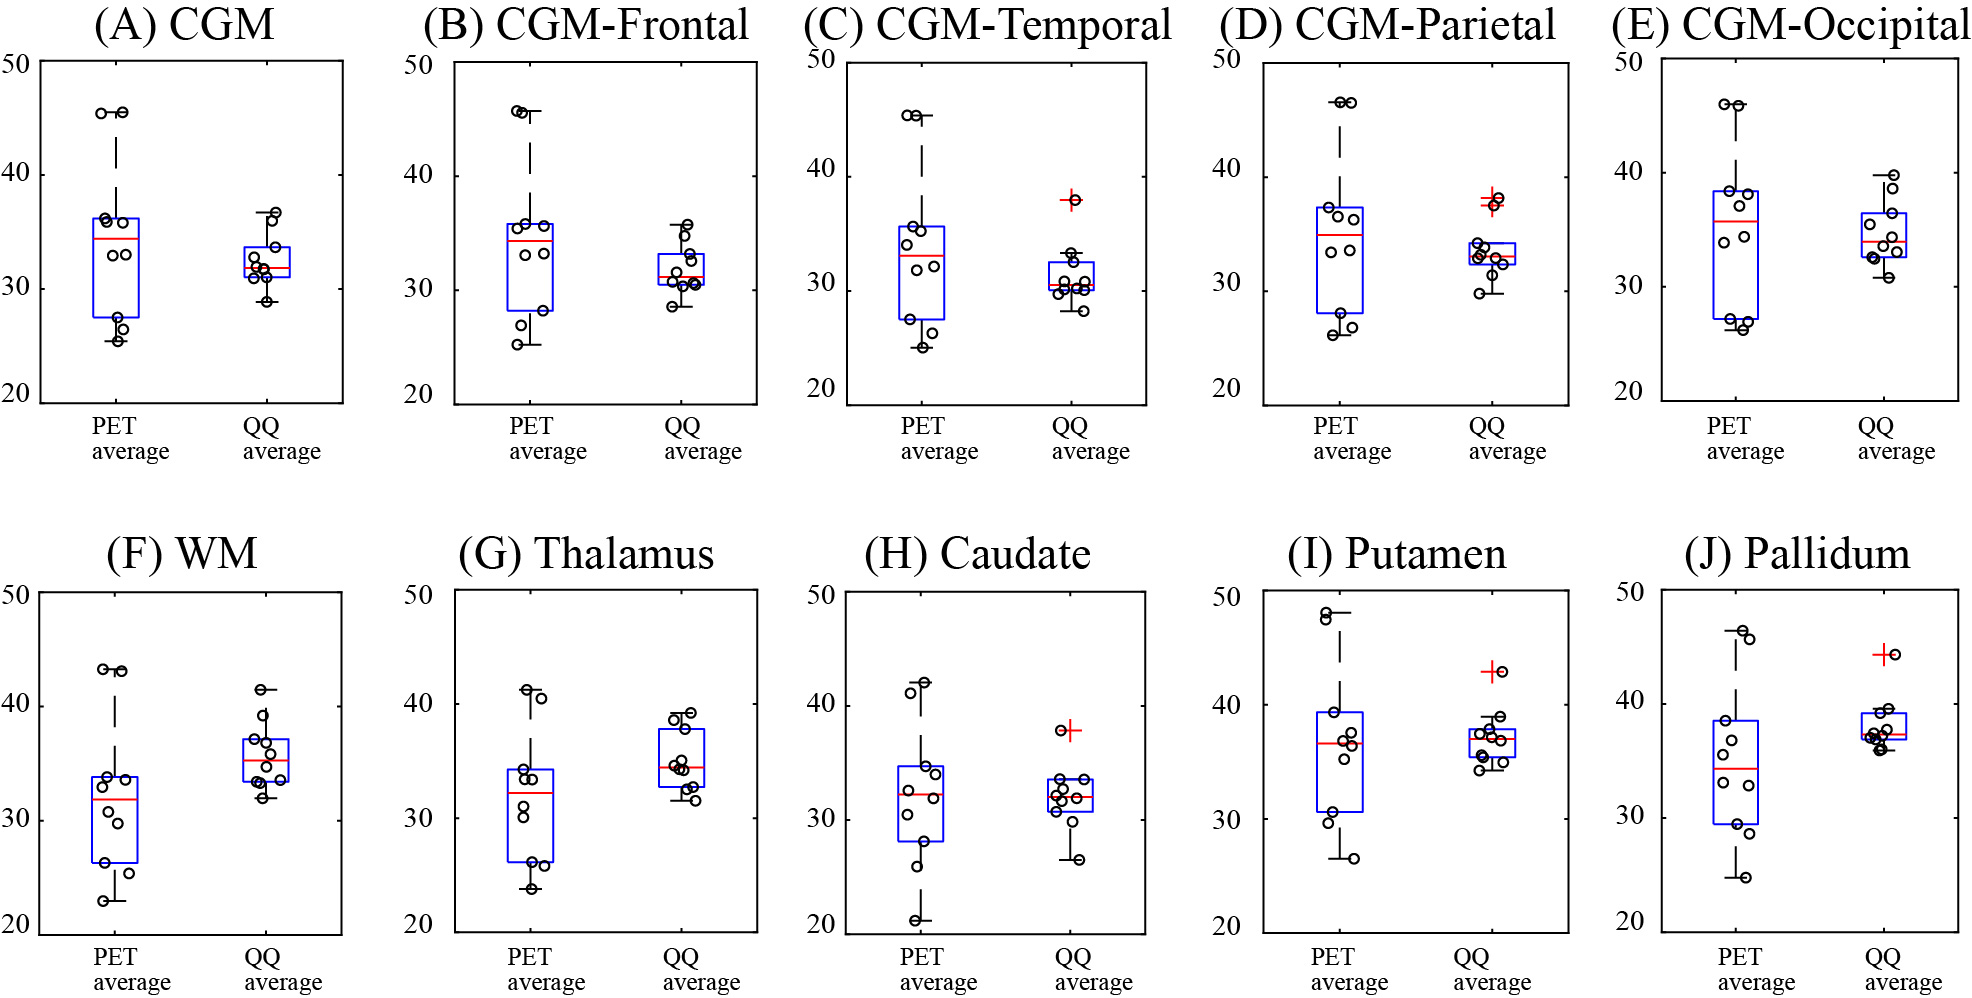
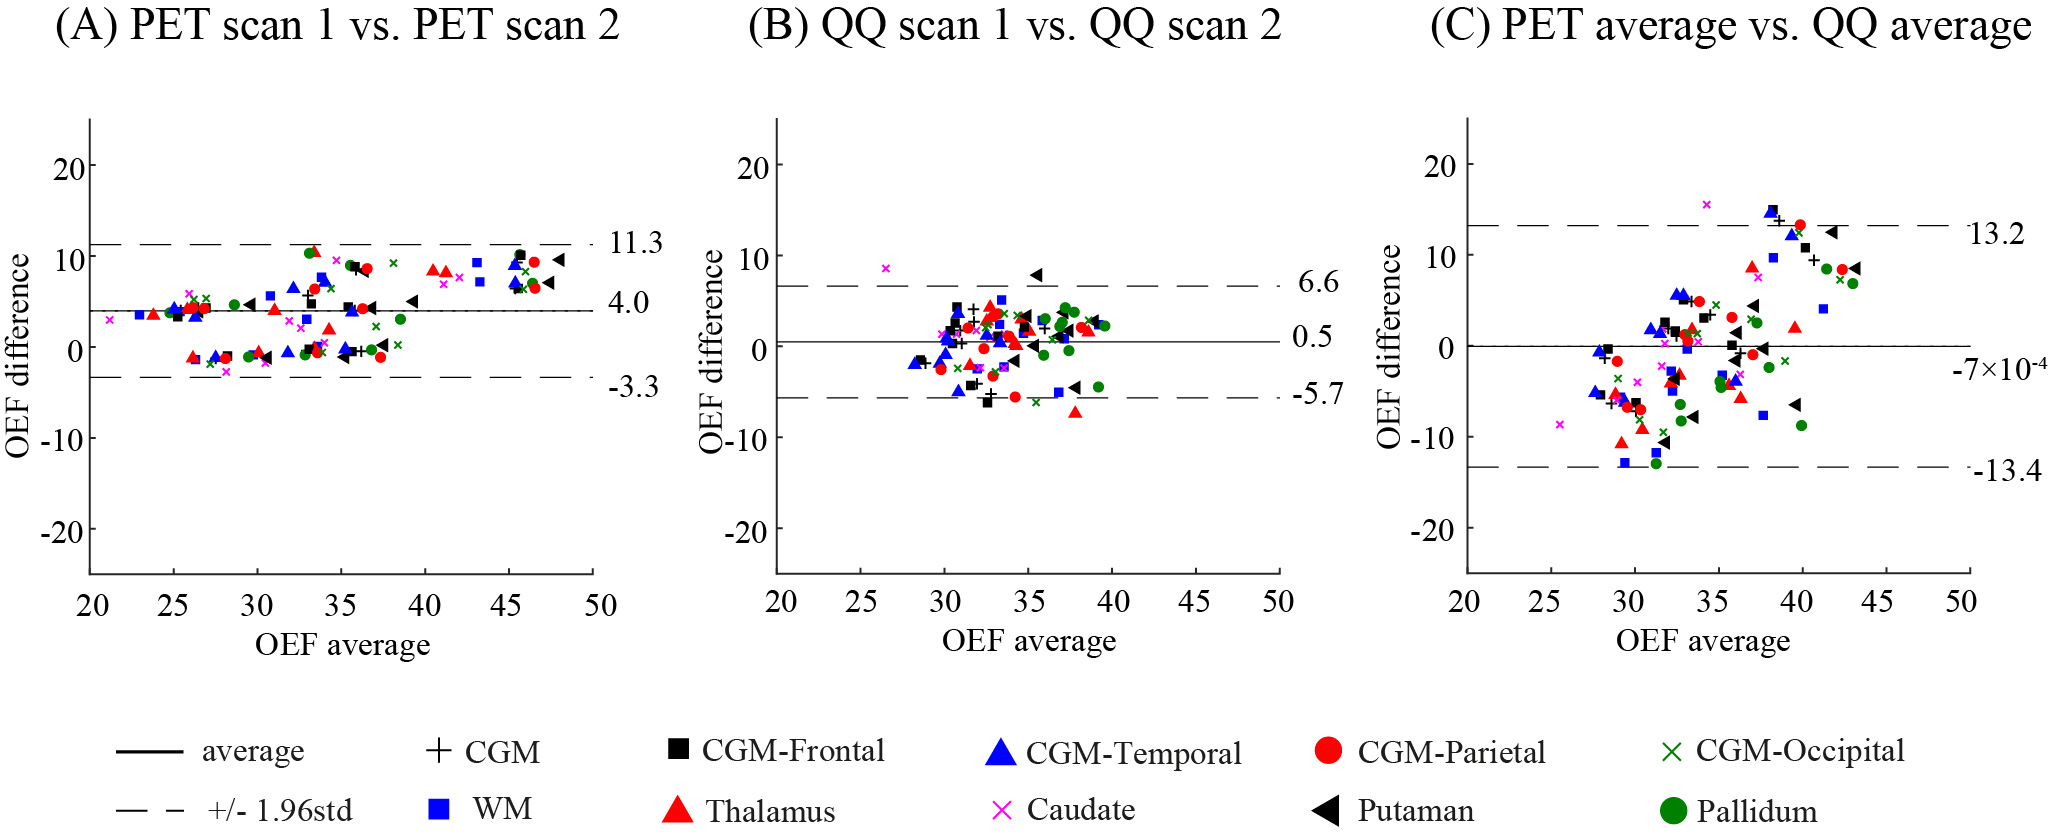
Comparisons between QQ-OEF and PET-OEF were performed using Bland-Altman (BA) plots, box plots, and Two One-Sided Tests (TOST) for substantial equivalence in the whole brain and regional ROIs: cortical gray matter (CGM), frontal, temporal, parietal, and occipital lobe of CGM, white matter (WM), and deep gray matter (DGM) regions (Thalamus, Caudate, Putamen, and Pallidum). For TOST, the limit of the equivalence interval (Δ) w as set to the maximum scan-rescan difference within each method.
Results
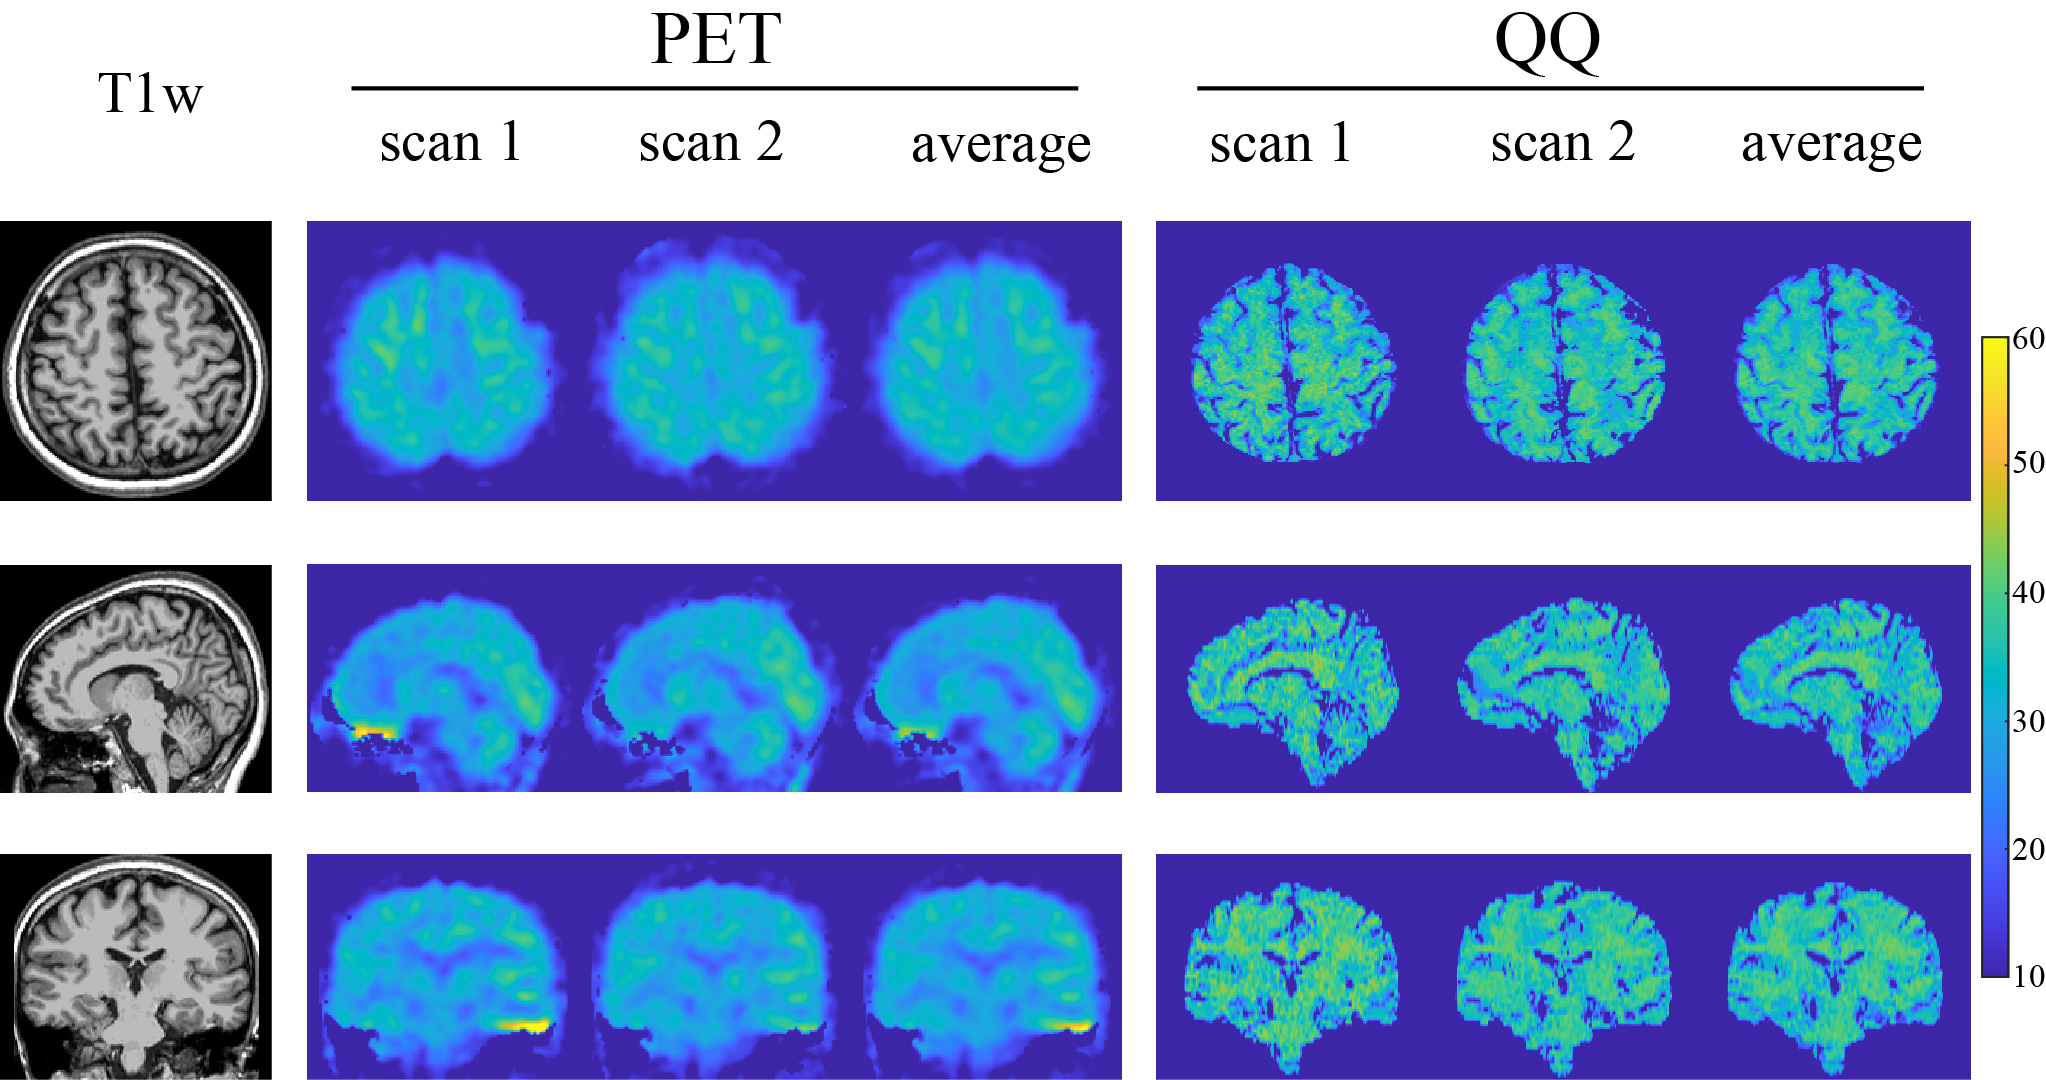
Example OEF maps are shown in Fig. 1. Whole brain OEF was 32.8 ± 6.7 % on PET and 34.2 ± 2.6 % on QQ (p=0.002, TOST), and the corresponding Bland-Altman plot is shown in Figure 2C. ROI based OEF values for PET and QQ were: 34.4 ± 7.0% vs. 32.5 ± 2.4% (p=0.003, TOST) for CGM, 32.2 ± 6.8 vs. 35.7 ± 3.0% (p=0.01, TOST) for WM, and 32.0 ± 5.9 vs. 35.1 ± 2.7% (p=0.001, TOST) for Thalamus. The corresponding box plots are shown in Figure 3, and Bland-Altman plots in Figure 4. Compared to PET-OEF, QQ-OEF showed smaller inter-subject variation, e.g. average coefficient of variation (COV) in whole brain=7.6% for QQ vs 20.5% for PET (Figs. 2, 3, and 4).Discussion
Both PET and QQ showed fairly uniform OEF maps over the brain (Fig. 1), which is in line with previous PET and MRI studies8, 10, 28, 35, 36. Global and CGM OEF values estimated with the two methods were substantially equivalent and agree with prior OEF values obtained from PET, e.g. 35 ± 7 % to 40 ± 9 %10, 16, 36, 3, from calibrated BOLD, e.g. 35 ± 4 % to 44 ± 14 %38-45, and from QSM, e.g. 29 ± 3 % to 50 ± 5 %15, 17, 18, 25, 26, 38, 46, 47. The PET inter-subject COV (20.5%) is consistent with previous PET studies10, 16, 17, which might arise from physiologic reason or various complexities in PET data acquisition and processing, such as the dependency of PET-OEF estimation on CBF and CBV from two independent PET scans with different tracers8, 11 and the sensitivity of IDAIF to PET-MRI registration uncertainty17.Conclusion
In healthy adults, the QQ model generates whole brain and regional OEF estimates that agree with the current gold standard 15O PET OEF estimation. The noninvasive, challenge-free, gradient echo MRI based QQ OEF mapping is ready for further evaluation in patients with regional OEF abnormalities.Acknowledgements
No acknowledgement found.References
1. Derdeyn CP, Yundt KD, Videen TO, et al. Increased oxygen extraction fraction is associated with prior ischemic events in patients with carotid occlusion. Stroke 1998; 29: 754-758.
2. Yamauchi H, Fukuyama H, Nagahama Y, et al. Significance of increased oxygen extraction fraction in five-year prognosis of major cerebral arterial occlusive diseases. J Nucl Med 1999; 40: 1992-1998.
3. Derdeyn CP, Videen TO, Yundt KD, et al. Variability of cerebral blood volume and oxygen extraction: stages of cerebral haemodynamic impairment revisited. Brain 2002; 125: 595-607.
4. Gupta A, Chazen JL, Hartman M, et al. Cerebrovascular reserve and stroke risk in patients with carotid stenosis or occlusion: a systematic review and meta-analysis. Stroke 2012; 43: 2884-2891.
5. Ito M,
Lammertsma AA, Wise RJS, et al. Measurement of regional cerebral blood flow and
oxygen utilisation in patients with cerebral tumours using 15O and positron
emission tomography: Analytical techniques and preliminary results. Neuroradiology 1982; 23: 63-74.
6. Ishii
K, Kitagaki H, Kono M, et al. Decreased medial temporal oxygen metabolism in
Alzheimer's disease shown by PET. J Nucl
Med 1996; 37: 1159-1165.
7. Wintermark M, Sesay M, Barbier E, et al. Comparative overview of brain perfusion imaging techniques. Stroke 2005; 36: e83-99.
8. Mintun MA, Raichle ME, Martin WR, et al. Brain oxygen utilization measured with O-15 radiotracers and positron emission tomography. J Nucl Med 1984; 25: 177-187.
9. Herscovitch P, Markham J and Raichle ME. Brain blood flow measured with intravenous H2(15)O. I. Theory and error analysis. J Nucl Med 1983; 24: 782-789.
10. Ibaraki M, Miura S, Shimosegawa E, et al. Quantification of cerebral blood flow and oxygen metabolism with 3-dimensional PET and 15O: validation by comparison with 2-dimensional PET. J Nucl Med 2008; 49: 50-59.
11. Ibaraki M, Shimosegawa E, Miura S, et al. PET measurements of CBF, OEF, and CMRO2 without arterial sampling in hyperacute ischemic stroke: method and error analysis. Ann Nucl Med 2004; 18: 35-44.
12. Yamauchi H, Fukuyama H, Nagahama Y, et al. Evidence of misery perfusion and risk for recurrent stroke in major cerebral arterial occlusive diseases from PET. J Neurol Neurosurg Psychiatry 1996; 61: 18-25.
13. Derdeyn CP, Videen TO, Simmons NR, et al. Count-based PET Method for Predicting Ischemic Stroke in Patients with Symptomatic Carotid Arterial Occlusion. Radiology 1999; 212: 499-506.
14. Powers WJ and Zazulia AR. PET in Cerebrovascular Disease. PET clinics 2010; 5: 83106-83106.
15. Kudo K, Liu T, Murakami T, et al. Oxygen extraction fraction measurement using quantitative susceptibility mapping: Comparison with positron emission tomography. J Cereb Blood Flow Metab 2016; 36: 1424-1433.
16. Powers WJ, Videen TO, Markham J, et al. Selective defect of in vivo gliycolysis in early Huntington's disease striatum. Proc Natl Acad Sci U S A 2007; 104: 2945.
17. Cho J, Kee Y, Spincemaille P, et al. Cerebral metabolic rate of oxygen (CMRO2) mapping by combining quantitative susceptibility mapping (QSM) and quantitative blood oxygenation level-dependent imaging (qBOLD). Magn Reson Med 2018; 80: 1595-1604.
18. Cho J, Zhang S, Kee Y, et al. Cluster analysis of time evolution (CAT) for quantitative susceptibility mapping (QSM) and quantitative blood oxygen level-dependent magnitude (qBOLD)-based oxygen extraction fraction (OEF) and cerebral metabolic rate of oxygen (CMRO2) mapping. Magn Reson Med 2020; 83: 844-857.
19. Liu T, Wisnieff C, Lou M, et al. Nonlinear formulation of the magnetic field to source relationship for robust quantitative susceptibility mapping. Magn Reson Med 2013; 69: 467-476.
20. Liu T, Khalidov I, de Rochefort L, et al. A novel background field removal method for MRI using projection onto dipole fields (PDF). NMR Biomed 2011; 24: 1129-1136.
21. Liu J, Liu T, de Rochefort L, et al. Morphology enabled dipole inversion for quantitative susceptibility mapping using structural consistency between the magnitude image and the susceptibility map. NeuroImage 2012; 59: 2560-2568.
22. Wang Y and Liu T. Quantitative susceptibility mapping (QSM): Decoding MRI data for a tissue magnetic biomarker. Magn Reson Med 2015; 73: 82-101.
23. Liu Z, Kee Y, Zhou D, et al. Preconditioned total field inversion (TFI) method for quantitative susceptibility mapping. Magn Reson Med 2017; 78: 303-315.
24. Liu Z, Spincemaille P, Yao Y, et al. MEDI+0: Morphology enabled dipole inversion with automatic uniform cerebrospinal fluid zero reference for quantitative susceptibility mapping. Magn Reson Med 2018; 79: 2795-2803.
25. Zhang J, Zhou D, Nguyen TD, et al. Cerebral metabolic rate of oxygen (CMRO2) mapping with hyperventilation challenge using quantitative susceptibility mapping (QSM). Magn Reson Med 2017; 77: 1762-1773.
26. Zhang J, Liu T, Gupta A, et al. Quantitative mapping of cerebral metabolic rate of oxygen (CMRO2) using quantitative susceptibility mapping (QSM). Magn Reson Med 2015; 74: 945-952.
27. Zhang J, Cho J, Zhou D, et al. Quantitative susceptibility mapping-based cerebral metabolic rate of oxygen mapping with minimum local variance. Magn Reson Med 2017.
28. Yablonskiy DA, Sukstanskii AL and He X. BOLD-based Techniques for Quantifying Brain Hemodynamic and Metabolic Properties – Theoretical Models and Experimental Approaches. NMR Biomed 2013; 26: 963-986.
29. Yablonskiy DA and Haacke EM. Theory of NMR signal behavior in magnetically inhomogeneous tissues: the static dephasing regime. Magn Reson Med 1994; 32: 749-763.
30. Su Y, Vlassenko AG, Couture LE, et al. Quantitative hemodynamic PET imaging using image-derived arterial input function and a PET/MR hybrid scanner. J Cereb Blood Flow Metab 2017; 37: 1435-1446.
31. Raichle ME, Martin WR, Herscovitch P, et al. Brain blood flow measured with intravenous H2(15)O. II. Implementation and validation. J Nucl Med 1983; 24: 790-798.
32. Grubb RL, Jr., Raichle ME, Higgins CS, et al. Measurement of regional cerebral blood volume by emission tomography. Ann Neurol 1978; 4: 322-328.
33. Su Y, Blazey TM, Snyder AZ, et al. Quantitative amyloid imaging using image-derived arterial input function. PLoS One 2015; 10: e0122920.
34. Bland JM and Altman DG. Measuring agreement in method comparison studies. SM IN MR 1999; 8: 135-160.
35. Bolar DS, Rosen BR, Sorensen A, et al. QUantitative Imaging of eXtraction of oxygen and TIssue consumption (QUIXOTIC) using venular‐targeted velocity‐selective spin labeling. Magn Reson Med 2011; 66: 1550-1562.
36. Raichle ME, MacLeod AM, Snyder AZ, et al. A default mode of brain function. Proc Natl Acad Sci U S A 2001; 98: 676-682.
37. Carpenter DA, Grubb RL, Jr., Tempel LW, et al. Cerebral oxygen metabolism after aneurysmal subarachnoid hemorrhage. J Cereb Blood Flow Metab 1991; 11: 837-844.
38. Ma Y, Sun H, Cho J, et al. Cerebral OEF quantification: A comparison study between quantitative susceptibility mapping and dual-gas calibrated BOLD imaging. Magn Reson Med 2020; 83: 68-82.
39. Gauthier CJ and Hoge RD. Magnetic resonance imaging of resting OEF and CMRO2 using a generalized calibration model for hypercapnia and hyperoxia. NeuroImage 2012; 60: 1212-1225.
40. Bulte DP, Kelly M, Germuska M, et al. Quantitative measurement of cerebral physiology using respiratory-calibrated MRI. NeuroImage 2012; 60: 582-591.
41. Wise RG, Harris AD, Stone AJ, et al. Measurement of OEF and absolute CMRO2: MRI-based methods using interleaved and combined hypercapnia and hyperoxia. NeuroImage 2013; 83: 135-147.
42. Germuska M and Bulte DP. MRI measurement of oxygen extraction fraction, mean vessel size and cerebral blood volume using serial hyperoxia and hypercapnia. NeuroImage 2014; 92: 132-142.
43. Fan AP, Schäfer A, Huber L, et al. Baseline oxygenation in the brain: Correlation between respiratory-calibration and susceptibility methods. NeuroImage 2016; 125: 920-931.
44. Germuska M, Merola A, Murphy K, et al. A forward modelling approach for the estimation of oxygen extraction fraction by calibrated fMRI. NeuroImage 2016; 139: 313-323.
45. Lajoie I, Tancredi FB and Hoge RD. Regional Reproducibility of BOLD Calibration Parameter M, OEF and Resting-State CMRO2 Measurements with QUO2 MRI. PLoS One 2016; 11: e0163071.
46. Fan AP, Bilgic B, Gagnon L, et al. Quantitative oxygenation venography from MRI phase. Magn Reson Med 2014; 72: 149-159.
47. Zhang J, Cho J, Zhou D, et al. Quantitative susceptibility mapping-based cerebral metabolic rate of oxygen mapping with minimum local variance. Magn Reson Med 2017; 79: 172-179.
Figures