0868
Atlas of reproducible short-range association fibers in parietal lobe by STTAR tracing and clustering1Department of Radiology, Children's Hospital of Philadelphia, Philadelphia, PA, United States, 2Department of Bioengineering, School of Engineering and Applied Science, University of Pennsylvania, Philadelphia, PA, United States, 3Department of Radiology, Perelman School of Medicine, University of Pennsylvania, Philadelphia, PA, United States
Synopsis
Short-range association fibers (SAFs) linking adjacent cortices, are dominant in connectome and altered in psychiatric disorders such as autism and schizophrenia. However, few atlases are dedicated to SAFs. Higher inter-subject variation and large amount of SAFs impede their identification with traditional methods for long-range fibers. To meet these challenges, we built the SAF atlas using STTAR (Short-range Tractography with high Throughput And Reproducibility), a novel and advanced protocol designed for SAFs. Here, we demonstrated the SAF atlas in parietal lobe, featured with reproducibly and comprehensively traced SAFs readily usable in 3D volume format in the ICBM152 space.
Purpose
Short-range association fibers (SAFs), which link adjacent cortical regions, take the major portion in the structural connectome [1]. Alterations of SAFs have been found in neuropsychiatric diseases, such as autism [1,2] and schizophrenia [1,3,4]. Currently, most studies focused on long-range association fiber tractography, whereas few tractography algorithms or atlases were designed for identifying SAFs. One of the challenges is higher inter-subject variation in their shapes and terminations [5,6], raising the difficulties in identifying and labeling huge amount of SAFs. Here we aimed to build a reproducible SAF atlas with novel and advanced protocol designed for short-range tractography, STTAR, or Short-range Tractography with high Throughput And Reproducibility [7]. STTAR is characterized by resolving crossing fiber issue, producing high-throughput SAFs, with fewer false-positives, and with high reproducibility [7].Methods
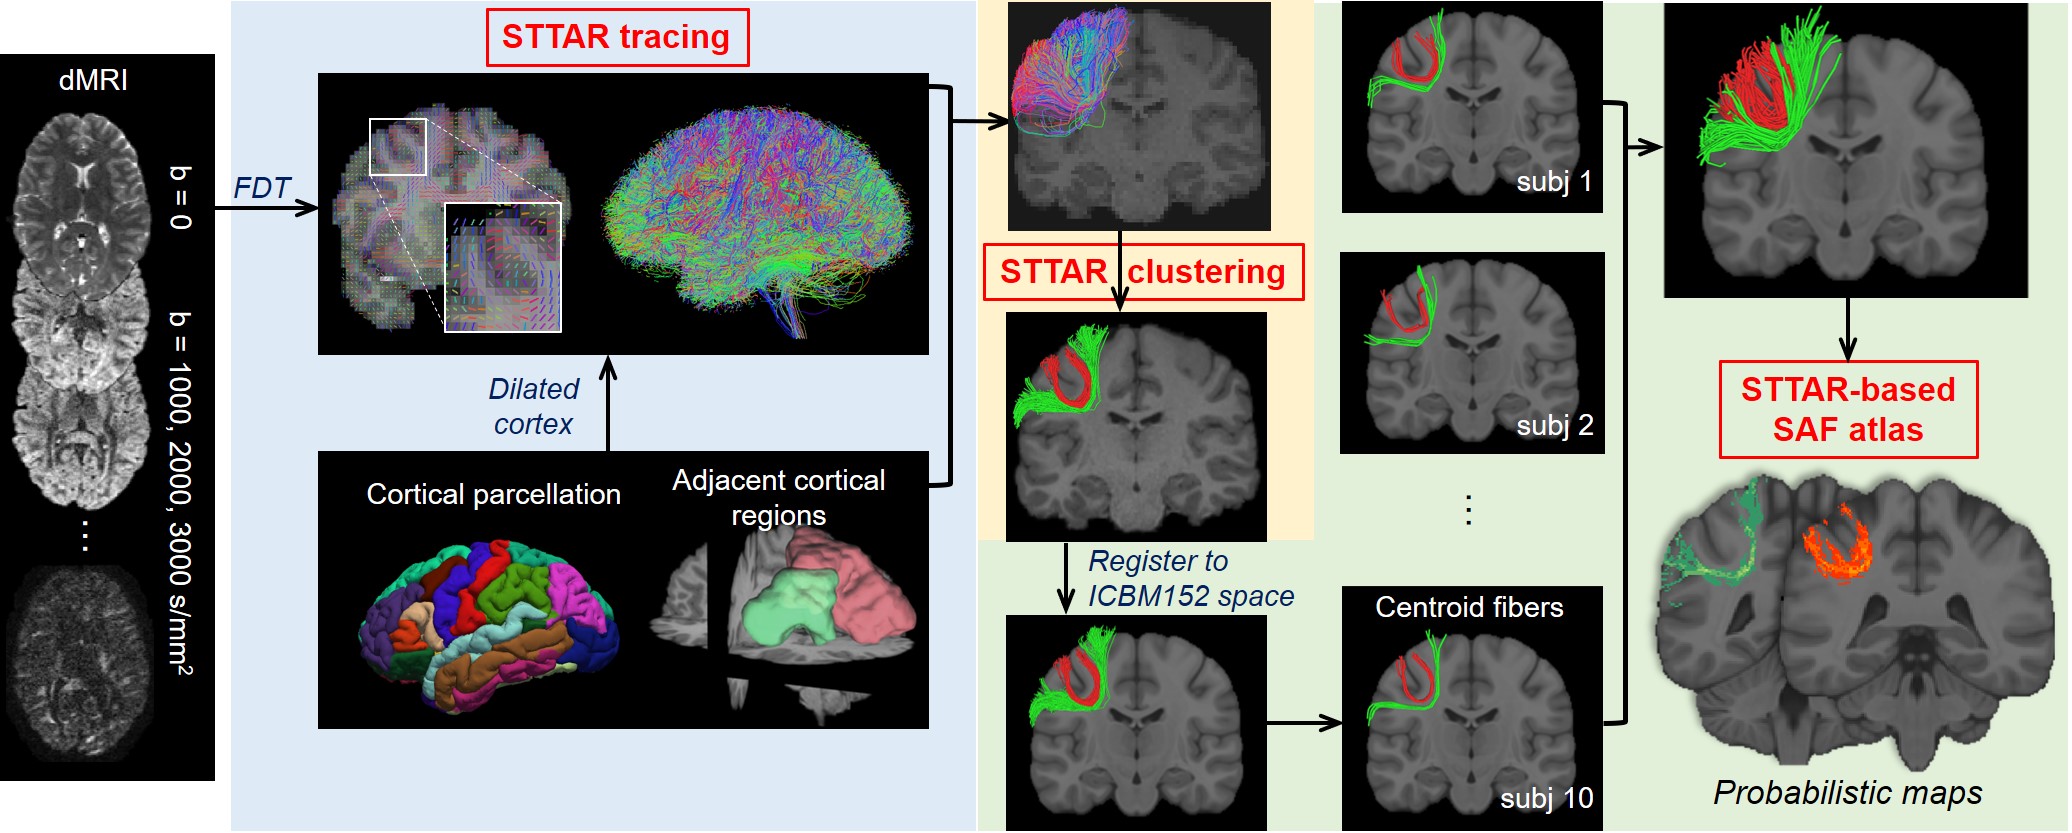
Overview of SAF atlas building with STTAR protocol (Figure 1): The SAF atlas was built with STTAR tracing and clustering protocol [7]. STTAR is composed of streamline-tracing with a regularized FDT probabilistic tractography and semi-automatic identification of reproducible SAFs with novel hierarchical density-based spatial clustering of applications with noise (HDBSCAN). Reproducible clusters were registered into ICBM152 space and merged as STTAR-based SAF atlas.Ten subjects aged 22-25 years from Human Connectome Project (HCP) were included. Multi-shell diffusion MRI (dMRI) was acquired with 90 directions in each shell of b=1000,2000,3000 s/mm2 and EPI-distortion was corrected.
STTAR tracing: The dilated cortical regions from FreeSurfer parcellation were used as seed ROIs. FDT (FMRIB’s Diffusion Toolbox) bedpostx [8-10] was applied for local fiber orientation estimation with two fibers per voxel. Probtrackx [8,9] was used for streamline tracing of SAF, with 10 seeds per voxel and traced in opposite directions from the seed. Streamlines connecting adjacent cortical regions were filtered with 1) NOT ROI of CSF, cerebellum, brainstem, subcortex, and white matter and gray matter in the other hemisphere; 2) length threshold of 10-110mm.
STTAR clustering: Euclidean distance between sampled points from pairs of fibers was calculated and distance matrix of all SAFs connecting a pair of adjacent cortical regions was built. Novel density-based algorithm HDBSCAN was applied on the distance matrix with parameters as follows: minimal points=1; minimal clusters size ranged from 10 to 80 depending on the total number of SAFs for clustering.
SAF atlas building: The clustered SAF streamlines were registered into ICBM152 space with affine registration. Within one cluster, five fibers with lowest distance to other fibers were selected as centroid fibers representing the cluster. Individual’s clusters with similar terminations in cortex and shape and found in at least 80% of subjects were grouped as one reproducible cluster, and their registered centroid fibers from individuals were fused as representative fibers of this cluster in the SAF atlas. Probabilistic maps were built: the registered fibers were converted to binary images, and these images were then averaged across subjects to generate probabilistic map for each cluster. Here we demonstrated the SAF atlas in parietal lobe.
Results
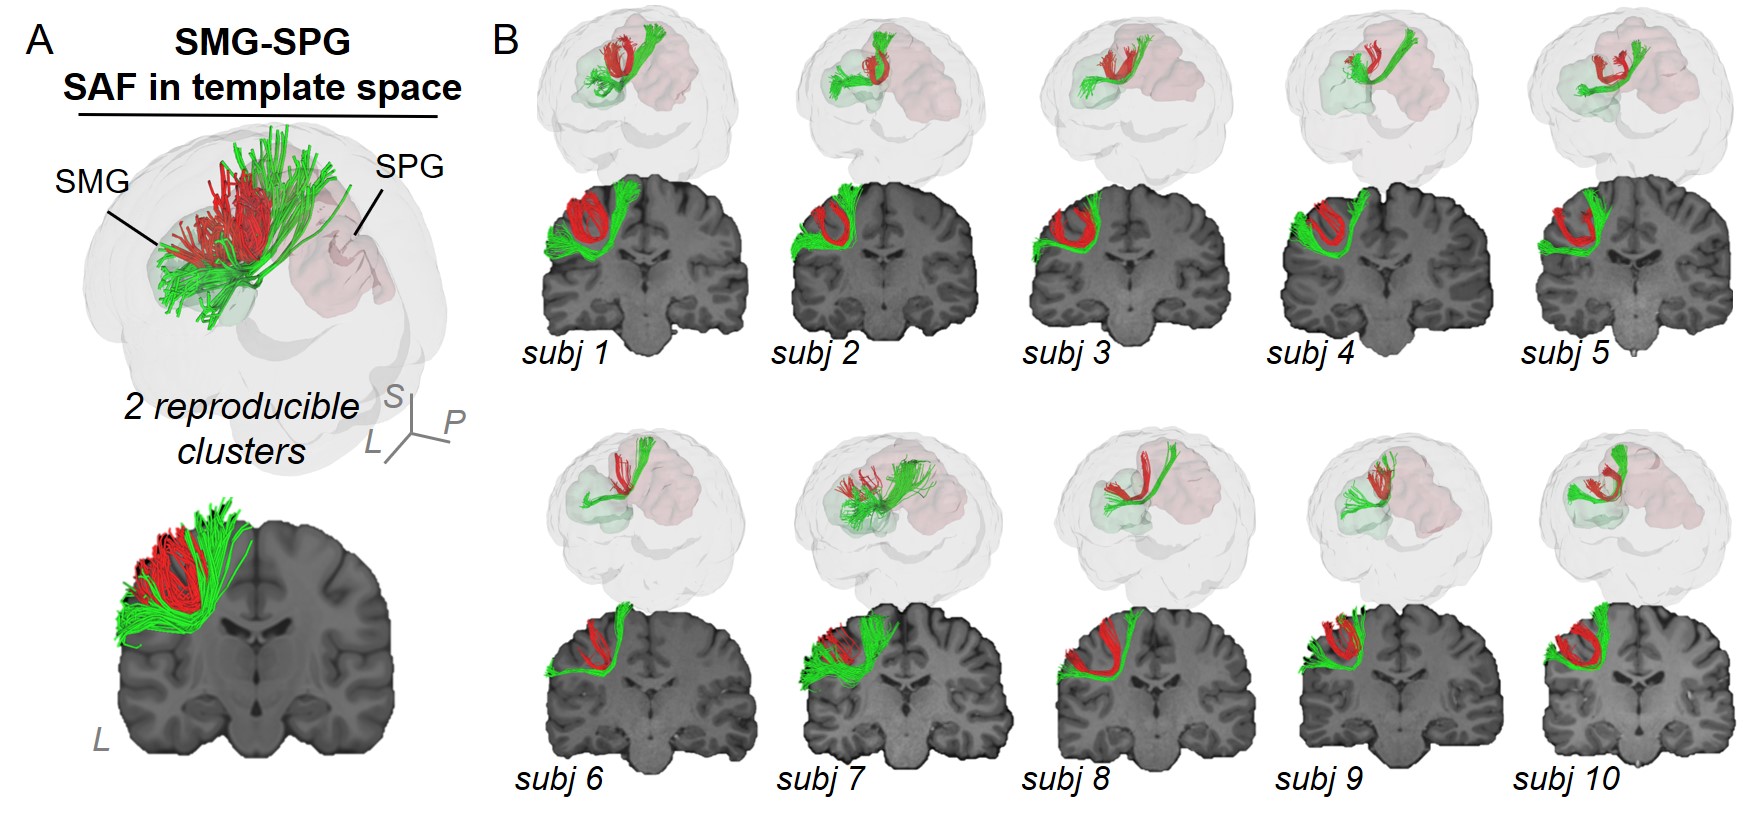
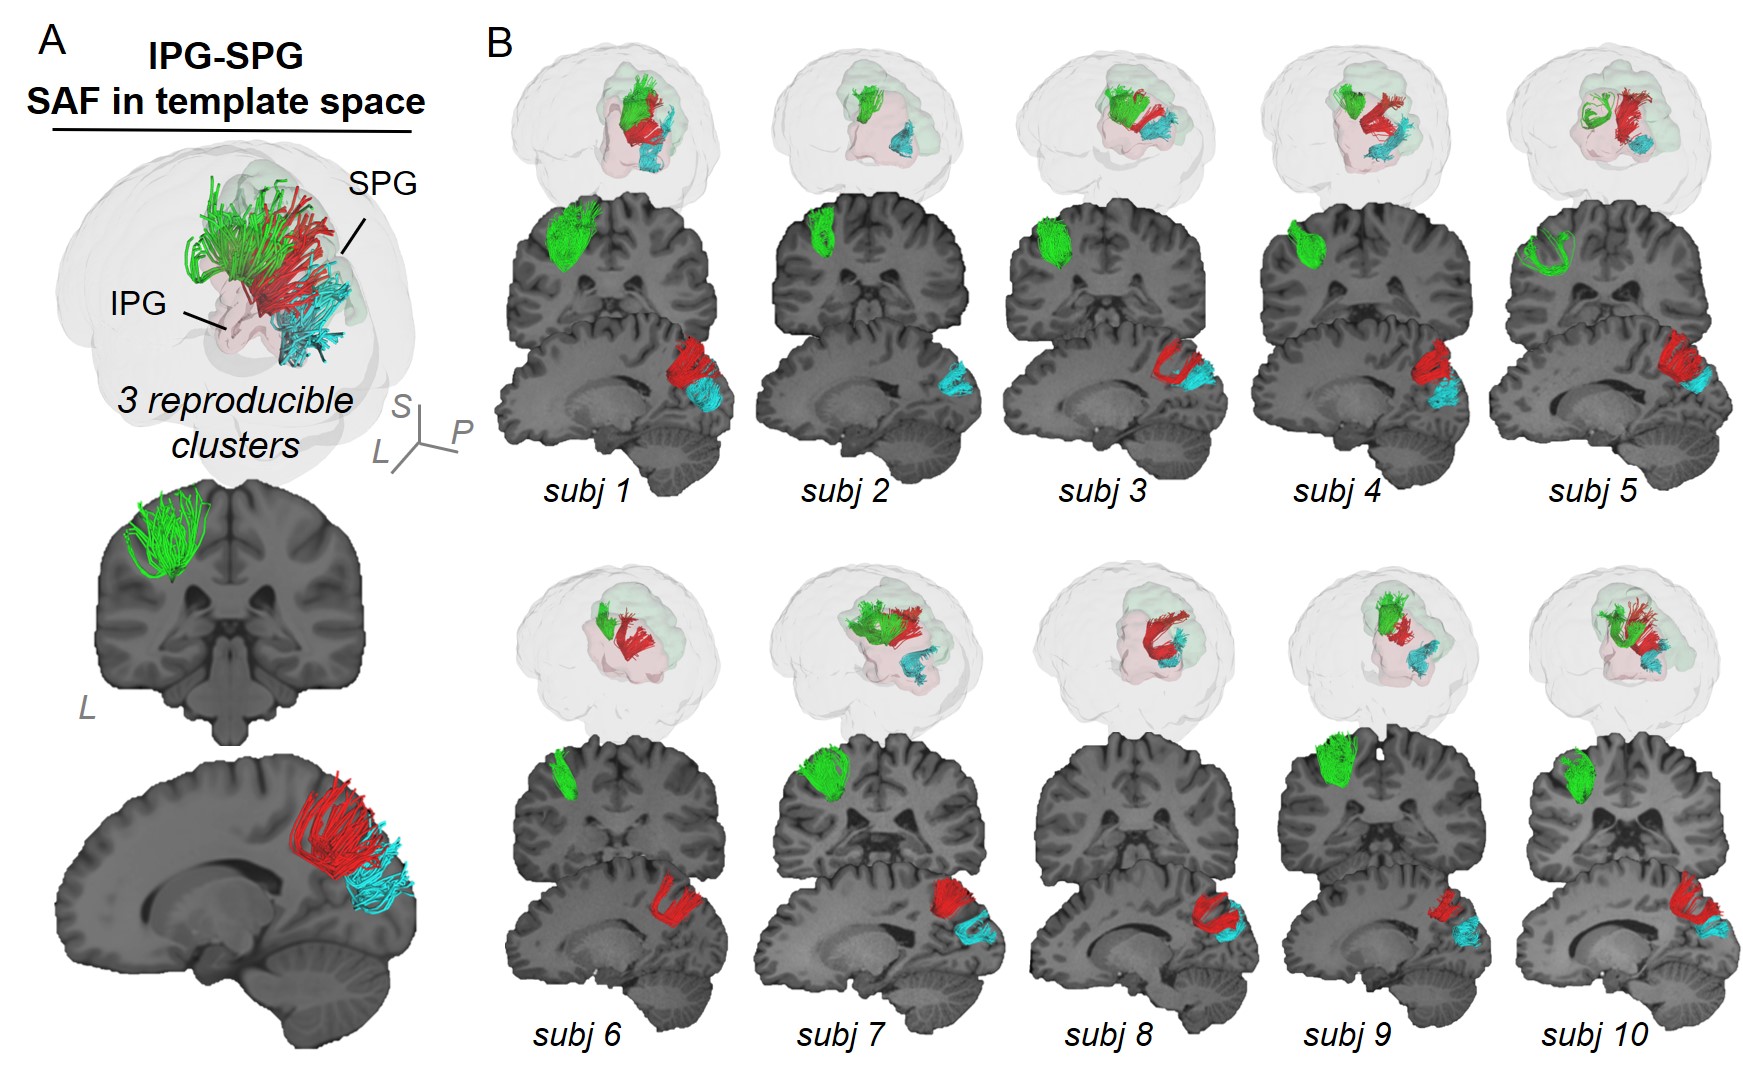
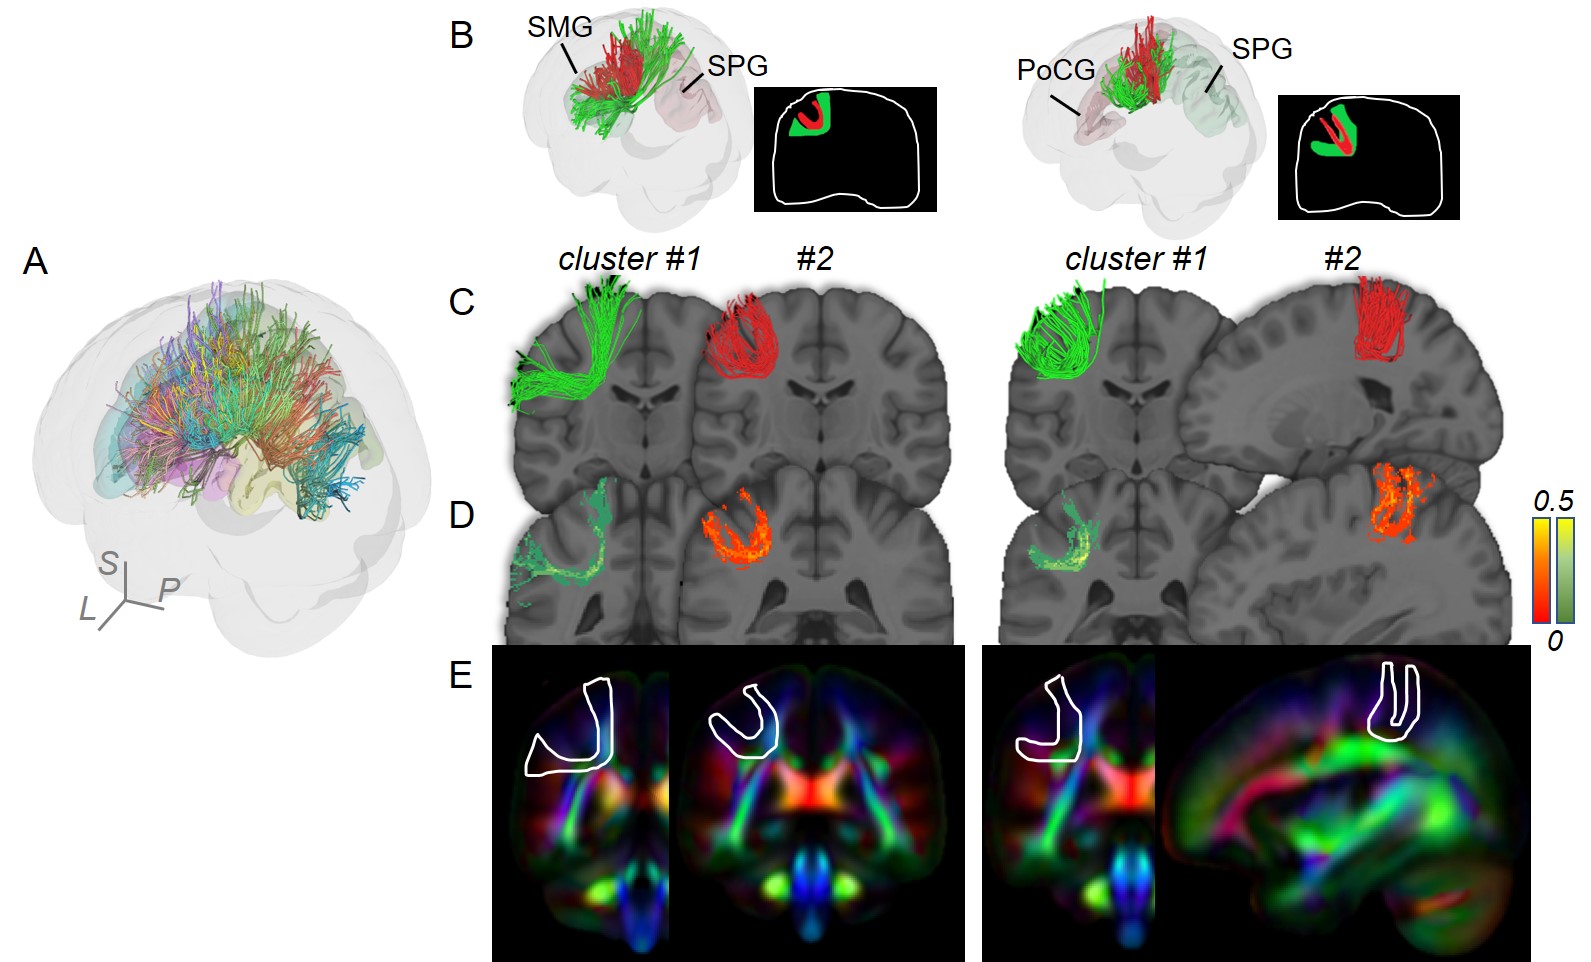
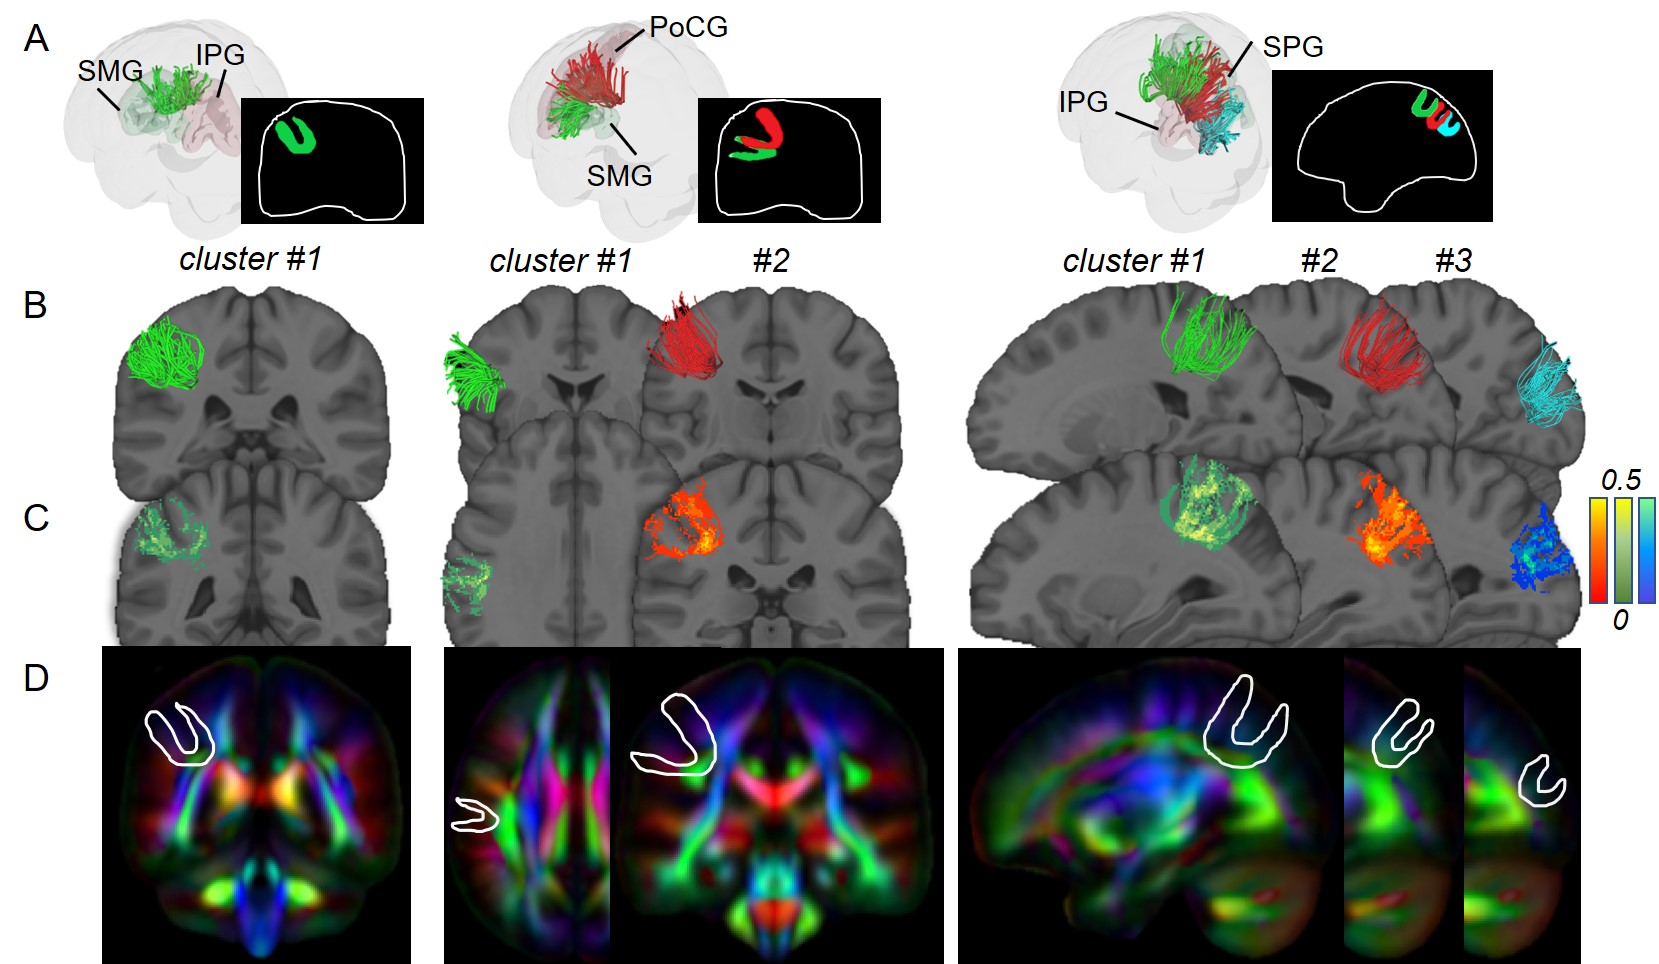
Figure 2 and 3 demonstrated SAF atlas in two example pairs of cortical regions. With STTAR protocol, not only the clusters previously identified in literature (e.g., Figure 2 red cluster; Figure 3 red and green clusters), but also those not reported in existing atlas [11] (e.g., Figure 2 green cluster; Figure 3 blue cluster) could be consistently identified in at least 90% of all subjects. In total, ten reproducible clusters were found in the left parietal lobe (Figure 4 and 5). Even though SAF clusters were spatially close to each other (Figure 4A), they were well separated with STTAR protocol (Figure 4B and Figure 5A). The probabilistic maps showed the reproducible trajectories of SAFs, with higher value representing better reproducibility. The contours of the probabilistic maps overlaid on colormap delineated the anatomy and unique shapes of these SAFs. For example, cluster #1 and #2 connecting supramarginal gyrus (SMG) and superior parietal gyrus (SPG) showed open U- and close U-shape (Figure 4); cluster #2 connecting postcentral gyrus (PoCG) and SPG had thinner contour than cluster #1 (Figure 4). Low FA (or intensity of colormap) was found in most of SAF cluster trajectories.Discussion and Conclusions
Even though variability of SAF is higher than long-range association fibers [5], and mostly located in the superficial white matter [1] (e.g. Figure 4E and 5D, contour maps), high reproducibility of SAF clusters was still achieved using our STTAR protocol. New clusters found in this STTAR-based SAF atlas compared to existing atlas [11] showed a good coverage of SAFs. New clusters and high reproducibility also validated the features of high throughput and reproducibility of STTAR. Unique shapes and locations of SAF reproducible clusters provides an anatomical reference for characterizing these clusters. To use this SAF atlas, users can simply register the probabilistic map into individual space for identifying reproducible SAF clusters in a new subject without manual delineation. Taken together, this SAF atlas is featured with reproducibly and comprehensively traced SAFs readily usable in 3D volume format in the ICBM152 space. Therefore, this STTAR-based SAF atlas can be a useful resource for neuroscience and neuropsychiatric disorders research in SAF. Atlas covering all lobes and built from more subjects is underway.Acknowledgements
This study is funded by NIH MH092535, MH092535-S1 and HD086984.
Data were provided by the Human Connectome Project, WU-Minn Consortium (Principal Investigators: David Van Essen and Kamil Ugurbil; 1U54MH091657) funded by the 16 NIH Institutes and Centers that support the NIH Blueprint for Neuroscience Research; and by the McDonnell Center for Systems Neuroscience at Washington University.
References
[1] Ouyang, M., Kang, H., Detre, J. A., Roberts, T. P., & Huang, H. (2017). Short-range connections in the developmental connectome during typical and atypical brain maturation. Neuroscience & Biobehavioral Reviews, 83, 109-122.
[2] Courchesne, E., & Pierce, K. (2005). Why the frontal cortex in autism might be talking only to itself: local over-connectivity but long-distance disconnection. Current opinion in neurobiology, 15(2), 225-230.
[3] Innocenti, G. M., & Price, D. J. (2005). Exuberance in the development of cortical networks. Nature Reviews Neuroscience, 6(12), 955.
[4] Paus, T., Keshavan, M., & Giedd, J. N. (2008). Why do many psychiatric disorders emerge during adolescence?. Nature Reviews Neuroscience, 9(12), 947.
[5] Zhang, Y., Zhang, J., Oishi, K., Faria, A. V., Jiang, H., Li, X., ... & Mori, S. (2010). Atlas-guided tract reconstruction for automated and comprehensive examination of the white matter anatomy. Neuroimage, 52(4), 1289-1301.
[6] Guevara, M., Guevara, P., Román, C., & Mangin, J. F. (2020). Superficial white matter: A review on the dMRI analysis methods and applications. NeuroImage, 116673.
[7] Zhao, C., Ouyang, M., Yu, Q., Huang, H. (2020). Short-range Tractography with high Throughput and Reproducibility (STTAR) characterized by FDT tracing and HDBSCAN clustering. Proceeding of ISMRM, 857.
[8] Behrens, T. E., Berg, H. J., Jbabdi, S., Rushworth, M. F., & Woolrich, M. W. (2007). Probabilistic diffusion tractography with multiple fibre orientations: What can we gain?. Neuroimage, 34(1), 144-155.
[9] Behrens, T. E., Woolrich, M. W., Jenkinson, M., Johansen‐Berg, H., Nunes, R. G., Clare, S., ... & Smith, S. M. (2003). Characterization and propagation of uncertainty in diffusion‐weighted MR imaging. Magnetic Resonance in Medicine: An Official Journal of the International Society for Magnetic Resonance in Medicine, 50(5), 1077-1088.
[10] Jbabdi, S., Sotiropoulos, S. N., Savio, A. M., Graña, M., & Behrens, T. E. (2012). Model‐based analysis of multishell diffusion MR data for tractography: How to get over fitting problems. Magnetic resonance in medicine, 68(6), 1846-1855.
[11] Guevara, M., Román, C., Houenou, J., Duclap, D., Poupon, C., Mangin, J. F., & Guevara, P. (2017). Reproducibility of superficial white matter tracts using diffusion-weighted imaging tractography. Neuroimage, 147, 703-725.
Figures