0867
Bundle-o-graphy
Matteo Battocchio1, Simona Schiavi1, Maxime Descoteaux2, and Alessandro Daducci1
1University of Verona, Verona, Italy, 2University of Sherbrooke, Sherbrooke, QC, Canada
1University of Verona, Verona, Italy, 2University of Sherbrooke, Sherbrooke, QC, Canada
Synopsis
Here we introduce the concept of bundle-o-graphy to tackle tractography reconstruction from a different point of view: instead of indirectly reconstructing fiber bundles streamline-by-streamline, we consider them as the objects to be reconstructed and we directly seek for them using global optimization. We show the potential of bundle-based tractography on synthetic and real data, possibly opening avenues to a new way of thinking about tractography.
Introduction
Although tractography has seen a notable evolution, the reconstruction of the white matter (WM) pathways remains a challenging task1. Global minimization methods have shown promising results by simultaneously performing tracking and signal reconstruction2,3,4. These approaches model analytically the tracking process, which is often really complex and involves billions of parameters that need to be optimized, typically with stochastic procedures. Consequently, they are computationally heavy, and convergence is not guaranteed. Given these limitations, we present a method that tackles tractography from a different point of view. The main idea is to move from “tract-o-graphy” to “bundle-o-graphy”, i.e., track bundles directly instead of streamlines. The optimal configuration is sought by a global optimization process that shapes and adapts the bundles geometry to fit the observed dMRI data. This is achieved using a modified version of Convex Optimization Modelling for Microstructure Informed Tractography (COMMIT)5 to cope with bundles instead of streamlines. We tested our novel bundle-o-graphy both on synthetic and real data, showing it can dramatically reduce the number of parameters needed to explain the white-matter fiber configuration as good as streamline-based tractography methods.Methods
In our bundle-o-graphy approach, a bundle is modeled by means of its centerline trajectory and the spatial extent for the signal contributions of the bundle to the voxels. Each trajectory is considered as the centroid of a blurred cylinder, with a constant radius, extending along the whole path (Fig.1B). Taking inspiration from6, we adopted a parametric representation of the centroids using cubic B-splines. The corresponding diffusion signal is analytically simulated mimicking a set of densely packed streamlines, aligned with the centroid and covering the whole volume. In particular, signal reconstruction is performed using a Gaussian blurring function centered on the streamline (Fig.1C). This implies that the local signal contribution decays exponentially as we move outward, becoming increasingly negligible while it remains constant along the path. Following this implementation, bundle simulation turns into modeling the space of influence of a streamline which requires only the variance as a parameter. Therefore, this extension allows the current streamline-based COMMIT to becoming a bundle-based algorithm. The bundle configuration is optimized following a Bayesian approach. In this context, the B-splines control points and the extent of the blur represent the parameters of our model $$$M$$$ that need to be optimized. According to the Bayesian theory, we can infer on the posterior distributions of these parameters based on the observed data $$$d$$$ and the data generated by $$$M$$$. The inference can be used to influence the parameters by back-propagation to minimize the cost function $$$f_T(M)$$$ defined as:$$f_T(M) = {E_D(M,d)} + \lambda |M|$$
The first term defines the likelihood function, which scores how well a specific configuration $$$M$$$ explains $$$d$$$, while the second promotes the minimization of the number of bundles in the configuration. To assess the impact of bundle-o-graphy we tested it on a well-known synthetic phantom (Fig.2) used in7. Tractography was performed using iFOD2 of MRTrix38, discarding streamlines prematurely stopping in WM. We compared the optimized configuration against the known ground-truth, reporting the number of bundles (VBs) and invalid bundles (IBs). In real data, we performed qualitative analysis on one HCP9 dataset (103818) using a tractogram with 3-million streamlines.
Results and Discussion
Bundle-o-graphy results on the synthetic phantom are reported in Fig.2. At the top of the first column, we show the input tractogram and, at the bottom, the bundle-based representation of the optimized one. In the second column, we compare the RMSE of the input configuration filtered by COMMIT, with the one of the optimized configuration. In the third column, we report connectivity graphs of each configuration. Results show how our method is able to remarkably filter out false positives while reducing the complexity of the tractogram. In fact, we needed only 0.94% of the streamlines to characterize all the connections, while shape and radius adaptation allowed to keep a comparable fitting error. Bundle-o-graphy results on the HCP data are shown in Fig.3, where we qualitatively assessed the impact of our method by comparing the RMSE maps of the input tractogram (left), with the one corresponding to the optimized configuration (right). With bundle-o-graphy, we were able to dramatically reduce the number of streamlines, decreasing from millions to tens of thousands for a whole-brain reconstruction while keeping a comparable RMSE. Lastly, Fig.4 is a visual representation of the impact of bundle-o-graphy on a section of the CST manually segmented from the input tractogram.Conclusions
Bundle-o-graphy formulation allows to drastically reduce the number of parameters needed to track WM connections. This, in turn, allows exploiting the potentials of global optimization to incorporate and use prior knowledge to guide in real-time the reconstruction. Thanks to these two aspects, the proposed method is capable to locally well represent the underlying anatomy and, at the same time, remove global implausible connections. Bundle-o-graphy opens new avenues to global tractography inverse-problem resolution and represents a fundamental step forward to improve tractography sensitivity and specificity.Acknowledgements
No acknowledgement found.References
- Jbabdi, S., Johansen-Berg, H., 2011. Tractography: Where Do We Go from Here? Brain Connectivity 1, 169–83.
- Kreher, B., Mader, I., Kiselev, V., 2008. Gibbs tracking: A novel approach for the reconstruction of neuronal pathways. Magn Reson Med 60, 953–63.
- Fillard, P., Poupon, C., Mangin, J.F., 2009. A Novel Global Tractography Algorithm Based on an Adaptive Spin Glass Model, in: International Conference on Medical Image Computing and Computer-Assisted Intervention, pp. 927–34.
- Reisert, M., Mader, I., Anastasopoulos, C., Weigel, M., Schnell, S., Kiselev, V., 2011. Global fiberreconstruction becomes practical. NeuroImage 54, 955–62.
- Daducci, A., Dal Palù, A., Lemkaddem, A., Thiran, J.P.: COMMIT: convex optimization modeling for microstructure informed tractography. IEEE Trans Med Imaging 34(1), 246–57 (2015).
- Lemkaddem, A., Skiöldebrand, D., Dal Palú, A., Thiran, J.P., Daducci, A., 2014. Global Tractography with Embedded Anatomical Priors for Quantitative Connectivity Analysis. Frontiers in Neurology 5, 232.
- M. Battocchio, S. Schiavi, M. Descoteaux, A. Daducci. Improving tractography accuracy using dynamic filtering. CDMRI'20 Springer. 202.
- J.-D. Tournier, R. E. Smith, D. Raffelt, R. Tabbara, T. Dhollander, M. Pietsch, D. Christiaens, B. Jeurissen, C.-H. Yeh, and A. Connelly. MRtrix3: A fast, flexible and open software framework for medical image processing and visualisation. NeuroImage, 202 (2019), pp. 116–37.
- D. C. Van Essen, S. M. Smith, D. M. Barch, T. E. J. Behrens, E. Yacoub, K. Ugurbil; WU- Minn HCP Consortium, The WU-Minn human connectome project: An overview. 80, 62–79 (2013).
Figures
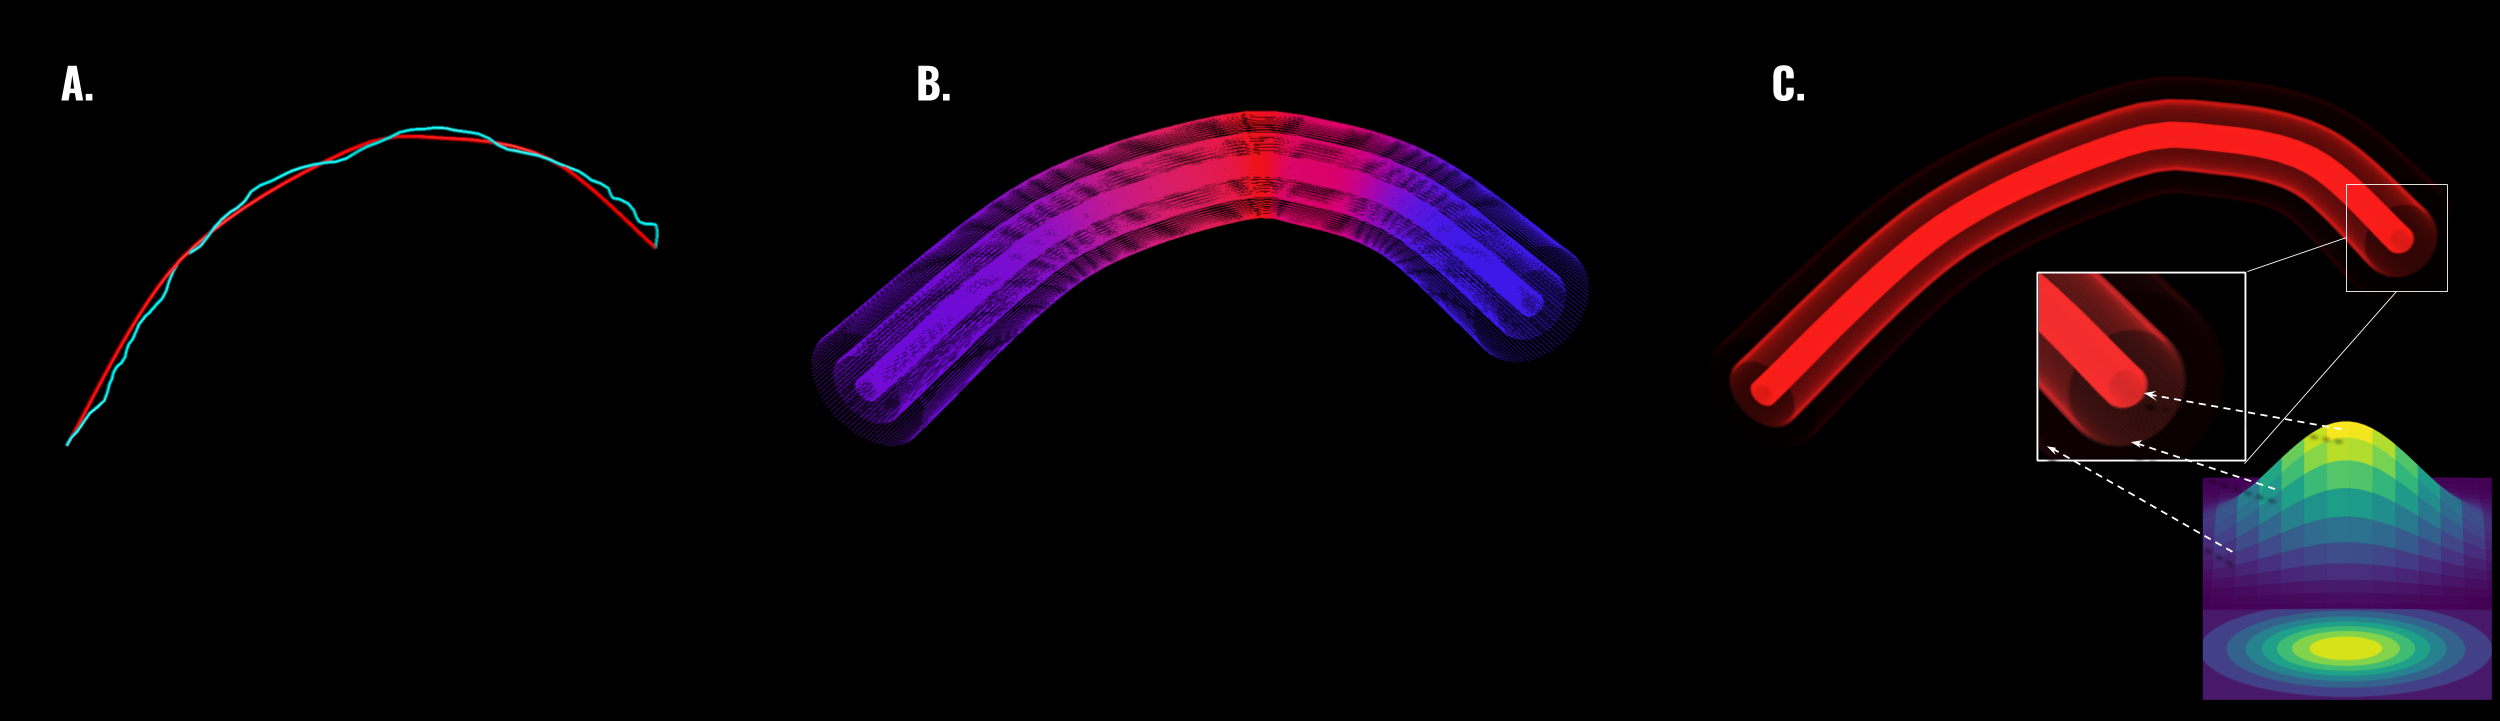
Figure 1: (A.) Spline parameterization (in red) of a streamline computed with probabilistic tracking (in blue). (B). Bundle represented as groups of aligned streamlines with different radii along the interpolating spline. (C.) Visual representation of the bundle with radial gaussian contribution.
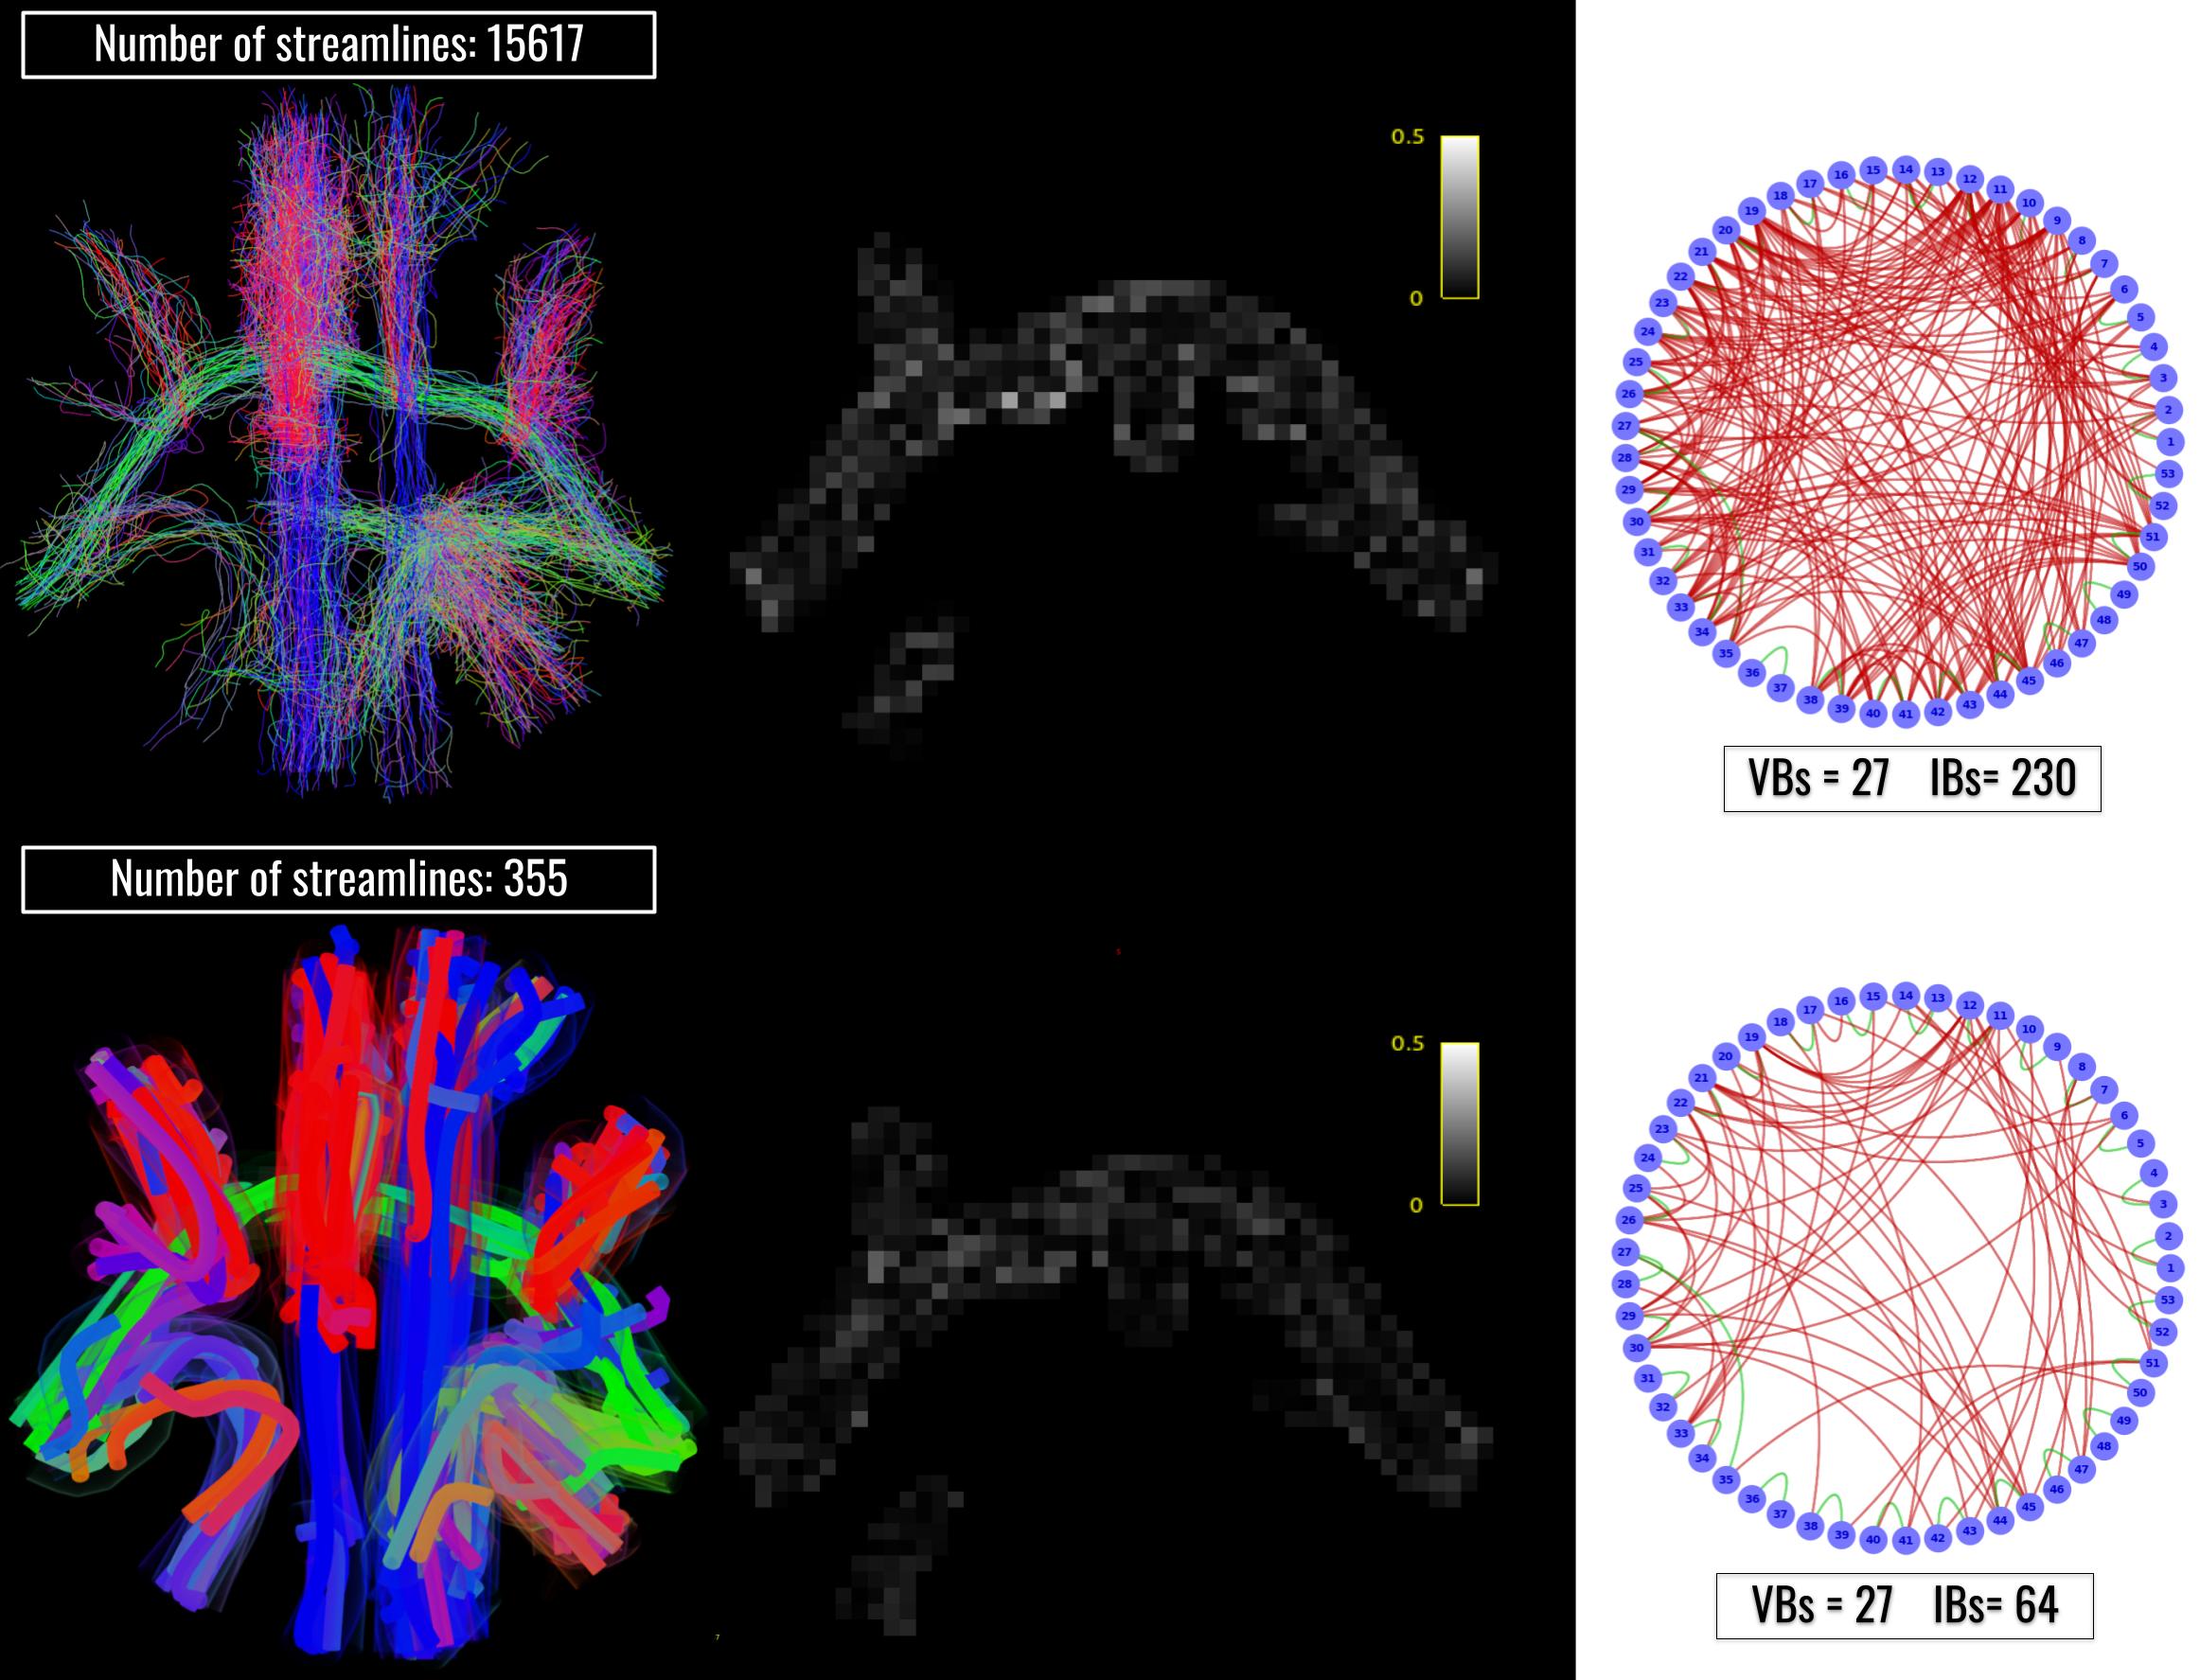
Figure 2: Results of the optimization on the synthetic phantom. On the first column are showed the input tractogram (top) and the resulting configuration visualized using bundle representation (bottom). In the central column are reported the corresponding RMSE maps and in the third column the results of the connectivity analyses. The circular graphs report in green the valid bundles (VBs), bundles connecting regions known to be connected), and in red the invalid bundles (IBs), meaning those connecting regions known to be disconnected)
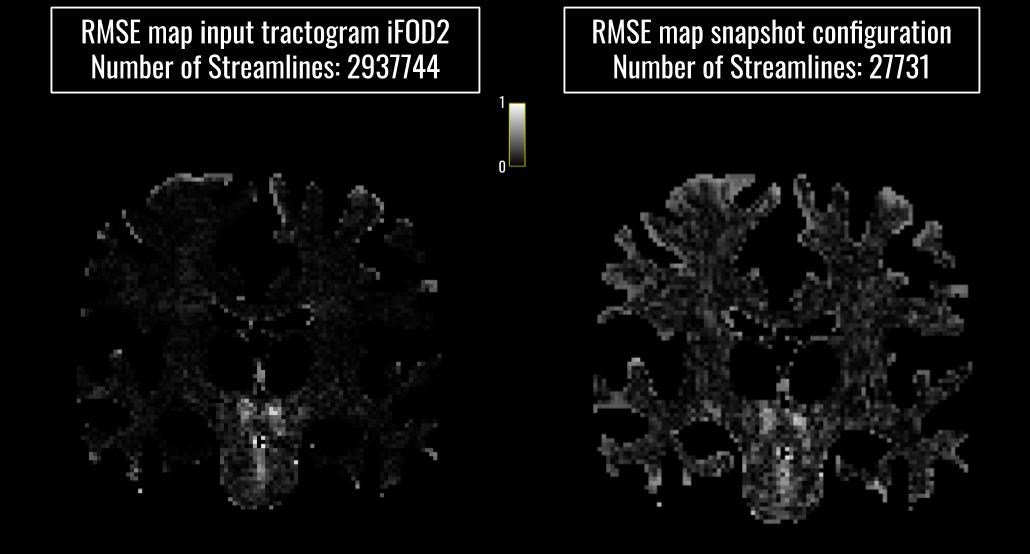
Figure 3: Comparison between RMSE maps of the input tractogram (left) and the optimized configuration (right).
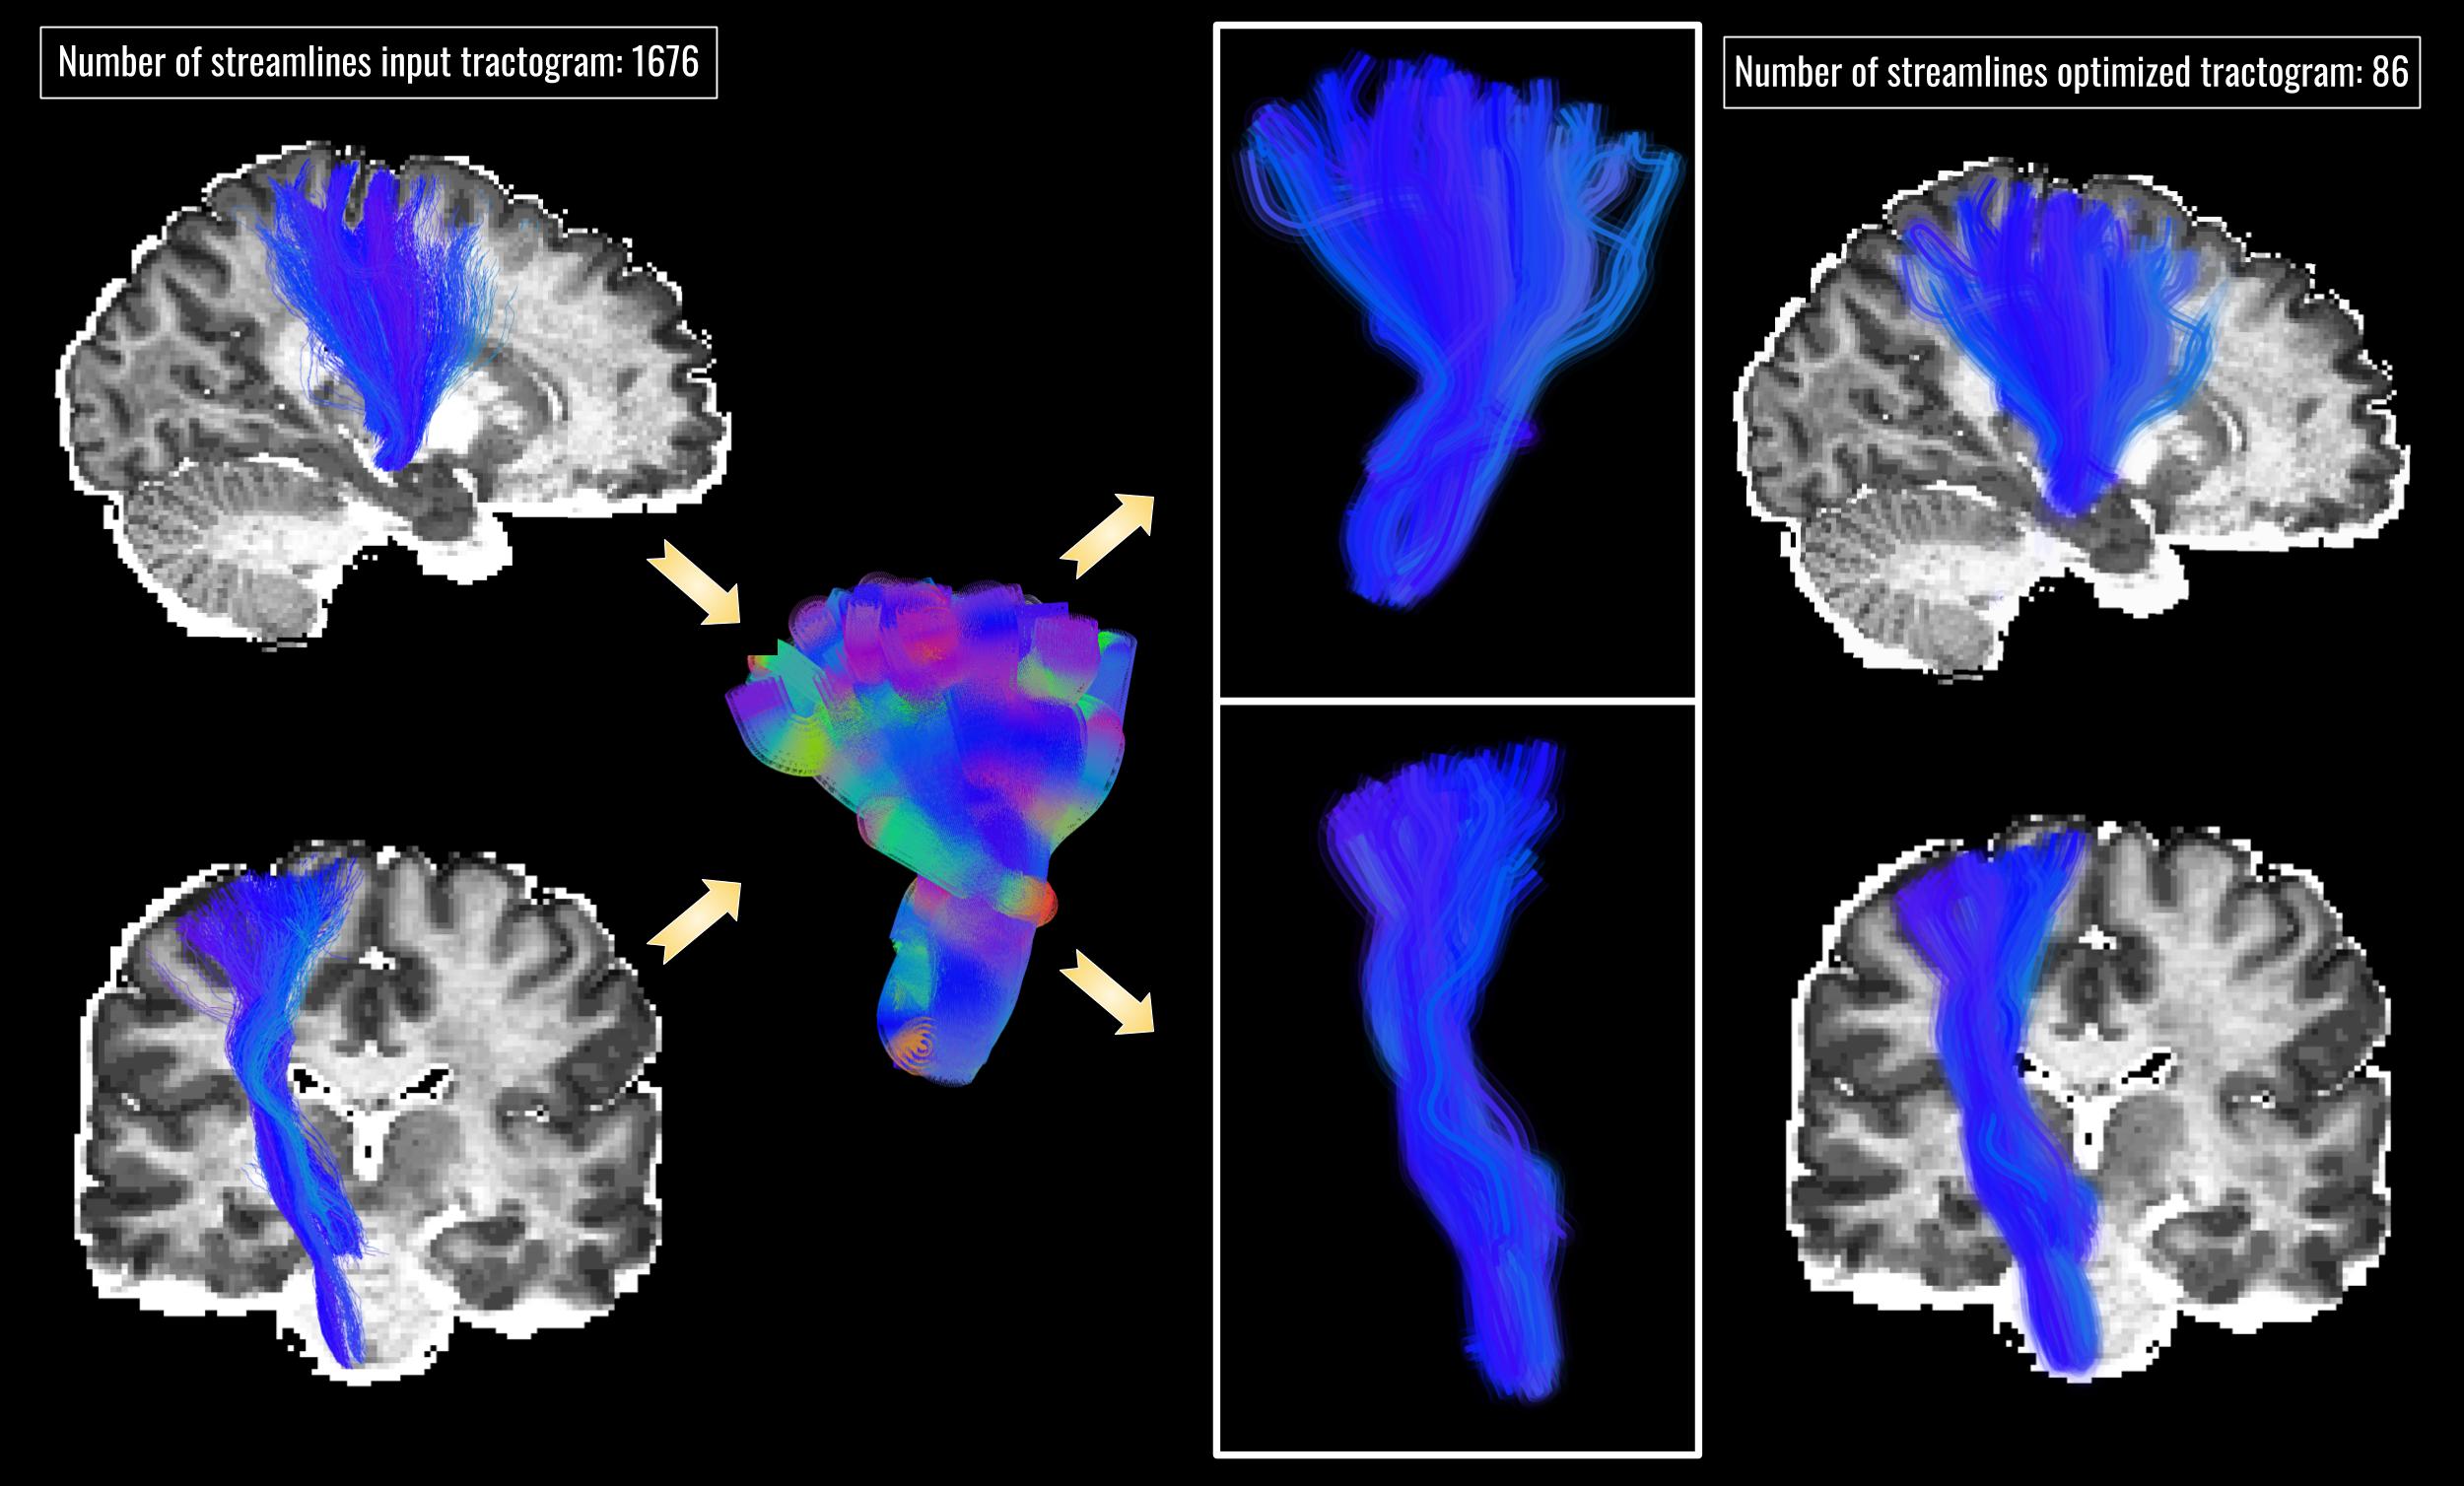
Figure 4: Impact of bundle-based optimization on the CST segmented from the input tractogram (left). In the middle are shown the extruded representation of the resulting optimized bundle along with a visual representation of the gaussian contribution represented by different opacity levels.