0865
Investigating the Occurrence of Asymmetric Patterns in White Matter Fiber Orientation Distribution Functions
Charles Poirier1, Étienne St-Onge1, and Maxime Descoteaux1
1Sherbrooke Connectivity Imaging Laboratory (SCIL), Université de Sherbrooke, Sherbrooke, QC, Canada
1Sherbrooke Connectivity Imaging Laboratory (SCIL), Université de Sherbrooke, Sherbrooke, QC, Canada
Synopsis
In general, fiber orientation distribution functions are defined as symmetric spherical functions. The present work shows how local averaging can be used to compute averaged asymmetric fODF (ava-fODF) from input symmetric white matter (WM) fODF. The resulting ava-fODF shows the presence of asymmetric patterns in voxels containing multiple crossings as well as along the white matter/gray matter interface. Moreover, the proportion of WM voxels displaying asymmetric features after filtering accounts for at least 30% of all WM voxels. Ava-fODF reveals new possibilities for classification of fiber configurations, with unidirectional fODF, bending fODF, Y-branching fODF and other complex fiber configurations.
Introduction
Motivated by the symmetric nature of the diffusion process in diffusion magnetic resonance imaging (dMRI), a symmetric spherical harmonics (SH) basis is commonly used to represent fiber orientation distribution functions1,2 (fODF). However, it cannot make the distinction between crossings, found in 66-90% of white matter (WM) voxels3,4, and other complex fiber configurations such as bendings, branchings or fannings. To address the issue, the use of inter-voxel information and/or asymmetric ODF5-11 has been suggested. The goal of our work is to study the effect of a locally asymmetric gaussian filtering in addition to a full SH basis on the fODF field. An analysis of the resulting averaged asymmetric fODF (ava-fODF) gives a better understanding of asymmetric regions and their corresponding fiber configurations.Methods
Using multi-shell multi-tissue constrained spherical deconvolution12 (MSMT-CSD), fODF were reconstructed from dMRI for 24 subjects from the Human Connectome Project (HCP) database13. The WM fODF were evaluated for 724 distinct sphere directions. The data was then filtered using a first-neighbor asymmetric gaussian filter with $$$\sigma=1$$$. Formally, the averaged value for sphere direction $$$x_i$$$ at voxel position $$$v$$$ is given by:$$z_v(x_i) = \frac{1}{W(x_i)}\left(fod_v(x_i) + \sum_{y \in N(v)}e^{\frac{-||y - v||^2}{2\sigma^2}} \cdot max(\frac{y - v}{||y - v||} \cdot x_i, 0) \cdot fod_y(-x_i)\right)$$
where $$$fod_v(x_i)$$$ is the fODF at voxel $$$v$$$ for orientation $$$x_i$$$, $$$N(v)$$$ is the set of positions for neighbors of $$$v$$$, $$$fod_y(-x_i)$$$ is the fODF at voxel position $$$y$$$ evaluated in the direction opposite to $$$x_i$$$ and $$$W(x_i)$$$ is a normalization constant. A visual explanation of the algorithm can be found in figure 1. To mitigate false positives, ava-fODF were clipped to 0 in voxels where the input fODF is null. The resulting ava-fODF were expressed in terms of SH coefficients using the Descoteaux 2007 full SH basis (publicly available in DIPY14), consisting of both even and odd order SH terms, truncated to maximum SH order 8. The asymmetry of ava-fODF was quantified by computing an odd-power measure, defined as the ratio of the 2-norm of odd order SH coefficients on the 2-norm of all SH coefficients, for each voxel. The proportions of WM voxels displaying asymmetric features were extracted by applying thresholds to the odd-power maps. Up to 10 peaks per voxel were also extracted from both input fODF and generated ava-fODF. A valid peak is a local maximum with an amplitude greater than 0.1 and of at least 0.3 times the range of amplitudes on the fODF. Because we consider antipodal sphere directions as different, a symmetric fODF with a given number of fiber orientations (nufo) has then twice this number of peaks. Number of peaks (nupeaks) maps were also generated by counting the number of peaks per voxel. For each subject, the joint histogram of fODF and ava-fODF nupeaks was computed.
Results
We obtain for the 24 processed HCP subjects an odd-power map showing the asymmetry of ava-fODF in each voxel (figure 2, i). Visualizing ava-fODF glyphs on top of the odd-power map, we see asymmetric fODF in voxels with a high odd-power value (figure 2, ii). The average proportion of WM voxels with an odd-power value of more than 10% is of 95.63% with a standard deviation of 0.35% for 24 HCP subjects. Increasing this threshold to 30%, the proportion drops to 31.52% with a standard deviation of 0.88%. We also obtain nupeaks maps for each subject’s fODF and ava-fODF fields (figure 3). Comparing the peaks extracted from fODF and ava-fODF in a gyral blade, we see that the ava-fODF field contains less misleading directions near the WM/GM interface (figure 3) than the input fODF field. New asymmetric fODF classes emerge from the filtering, including unidirectional fODF, bending single-fiber and two-fiber ODF, Y-branchings as well as other complex distributions (Figure 4). Figure 5 shows the effect of our filtering algorithm on the distribution of nupeaks.Discussion
The reported amount of asymmetric voxels (between 30 and 95%) in the WM after filtering suggests the use of a full SH basis to reconstruct ava-fODF can represent new intra-voxel information in an important proportion of voxels. The presence of unidirectional ava-fODF, with a higher diffusion probability when facing WM than GM voxels, captures the endpoints of fiber tracts along the WM/GM interface. The presence of bending and branching ava-fODF in the gyral blades also helps capture the fanning of WM fibers into the GM. Finally, the nupeaks distributions shown in figure 4 show that for fODF nupeaks values of 4 or more, the number of ava-fODF peaks get distributed amongst lower nupeaks classes. This result suggests the symmetric fODF contains false directions that can be mitigated using a simple asymmetric gaussian filtering. Since a reduced number of peaks gives a better idea of the underlying fiber configuration, ava-fODF could help fiber tracking in voxels of high asymmetry.Conclusion
The use of asymmetric fODF to represent fiber distributions makes it possible to model complex fiber configurations. The odd-power and nupeaks maps proposed in this work show where asymmetric patterns are found in the WM. It would now be important to see how the integration of ava-fODF into an asymmetric tractography algorithm7,9-11 could improve the accuracy of WM fiber bundles reconstruction.Acknowledgements
The authors would like to thank Manu Rangaya for his useful insight throughout the research project.References
- Descoteaux M, Angelino E, Fitzgibbons S, Deriche R. Regularized, fast, and robust analytical Q-ball imaging. Magnetic Resonance in Medicine. 2007;58(3):497–510.
- Tournier J-D, Calamante F, Gadian DG, Connelly A. Direct estimation of the fiber orientation density function from diffusion-weighted MRI data using spherical deconvolution. NeuroImage. 2004 Nov 1;23(3):1176–85.
- Descoteaux M. High Angular Resolution Diffusion MRI: from Local Estimation to Segmentation and Tractography. 2008.
- Jeurissen B, Leemans A, Tournier J-D, Jones DK, Sijbers J. Investigating the prevalence of complex fiber configurations in white matter tissue with diffusion magnetic resonance imaging. Human Brain Mapping. 2013;34(11):2747–66.
- Cetin Karayumak S, Özarslan E, Unal G. Asymmetric Orientation Distribution Functions (AODFs) revealing intravoxel geometry in diffusion MRI. Magnetic Resonance Imaging. 2018 Jun 1;49:145–58.
- Feng Y, He J. Asymmetric fiber trajectory distribution estimation using streamline differential equation. Medical Image Analysis. 2020 Jul 1;63:101686.
- Bastiani M, Cottaar M, Dikranian K, Ghosh A, Zhang H, Alexander DC, et al. Improved tractography using asymmetric fibre orientation distributions. NeuroImage. 2017 Sep 1;158:205–18.
- Barmpoutis A, Vemuri BC, Howland D, Forder JR. Extracting Tractosemas from a Displacement Probability Field for Tractography in DW-MRI. In: Metaxas D, Axel L, Fichtinger G, Székely G, editors. Medical Image Computing and Computer-Assisted Intervention – MICCAI 2008. Berlin, Heidelberg: Springer; 2008. p. 9–16. (Lecture Notes in Computer Science).
- Ehricke H-H, Otto K-M, Klose U. Regularization of bending and crossing white matter fibers in MRI Q-ball fields. Magnetic Resonance Imaging. 2011 Sep 1;29(7):916–26.
- Reisert M, Kellner E, Kiselev VG. About the Geometry of Asymmetric Fiber Orientation Distributions. IEEE Transactions on Medical Imaging. 2012 Jun;31(6):1240–9.
- Wu Y, Hong Y, Feng Y, Shen D, Yap P-T. Mitigating gyral bias in cortical tractography via asymmetric fiber orientation distributions. Medical Image Analysis. 2020 Jan 1;59:101543.
- Jeurissen B, Tournier J-D, Dhollander T, Connelly A, Sijbers J. Multi-tissue constrained spherical deconvolution for improved analysis of multi-shell diffusion MRI data. NeuroImage. 2014 Dec 1;103:411–26.
- Van Essen DC, Smith SM, Barch DM, Behrens TEJ, Yacoub E, Ugurbil K. The WU-Minn Human Connectome Project: An overview. NeuroImage. 2013 Oct 15;80:62–79.
- Garyfallidis E, Brett M, Amirbekian B, Rokem A, Van Der Walt S, Descoteaux M, et al. Dipy, a library for the analysis of diffusion MRI data. Frontiers in Neuroinformatics. 2014;8:8.
Figures
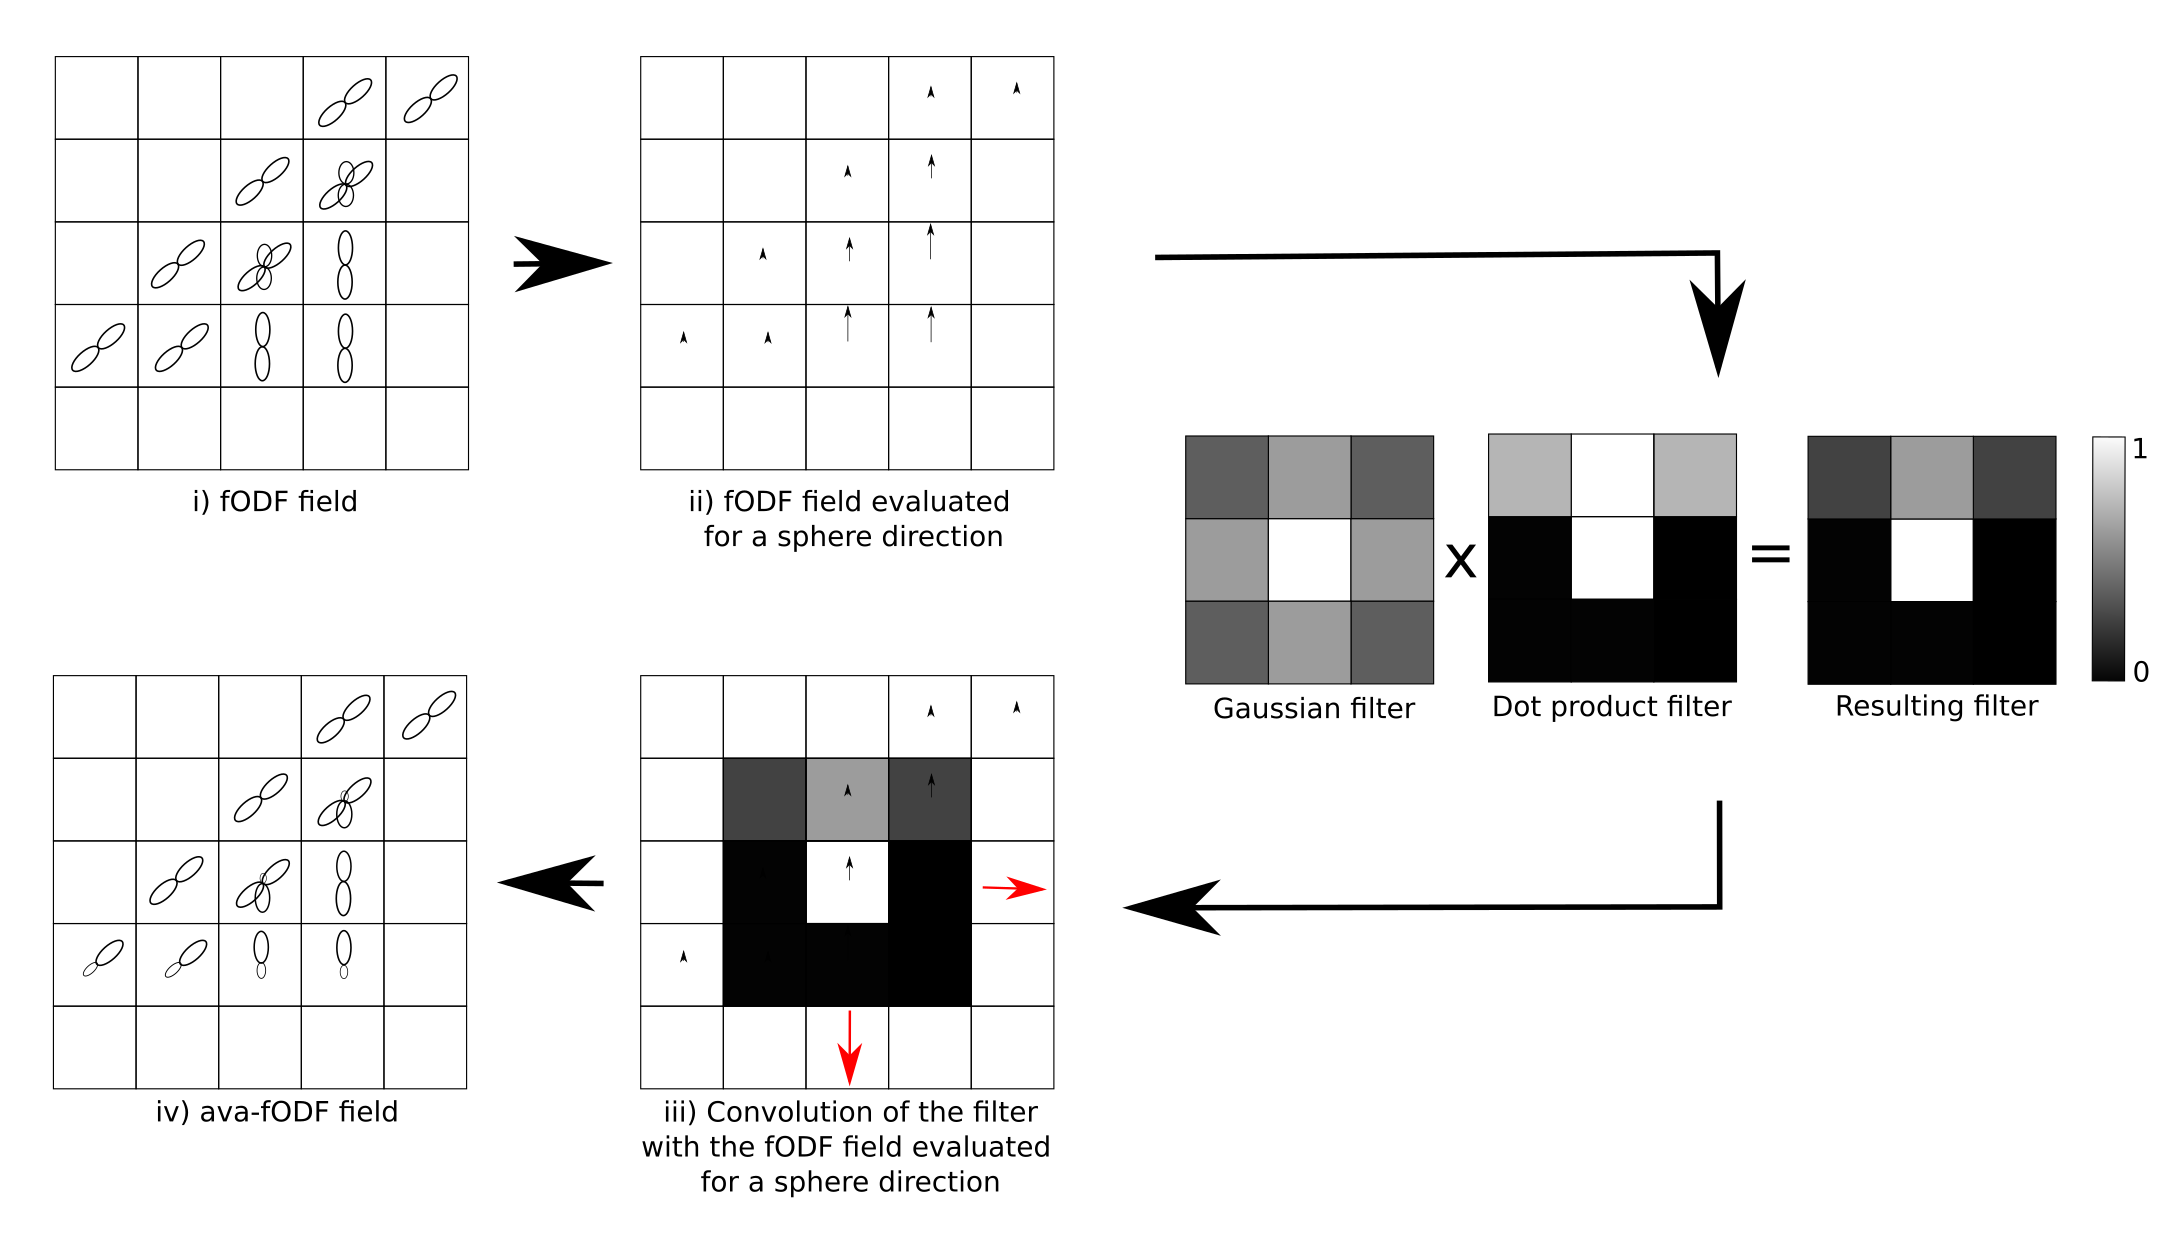
Figure 1: Schematic 2-dimensional visualization of the filtering algorithm for ava-fODF generation. Because opposite sphere directions are equal in amplitude, the algorithm is simplified by using the same direction in the center voxel and in adjacent voxels. The convolution operation in iii) is done for all sphere directions. The weights of the filters are represented as colors in a 3x3 grid (right subfigure). Unlike the dot product filter, the gaussian filter is constant for all sphere directions.
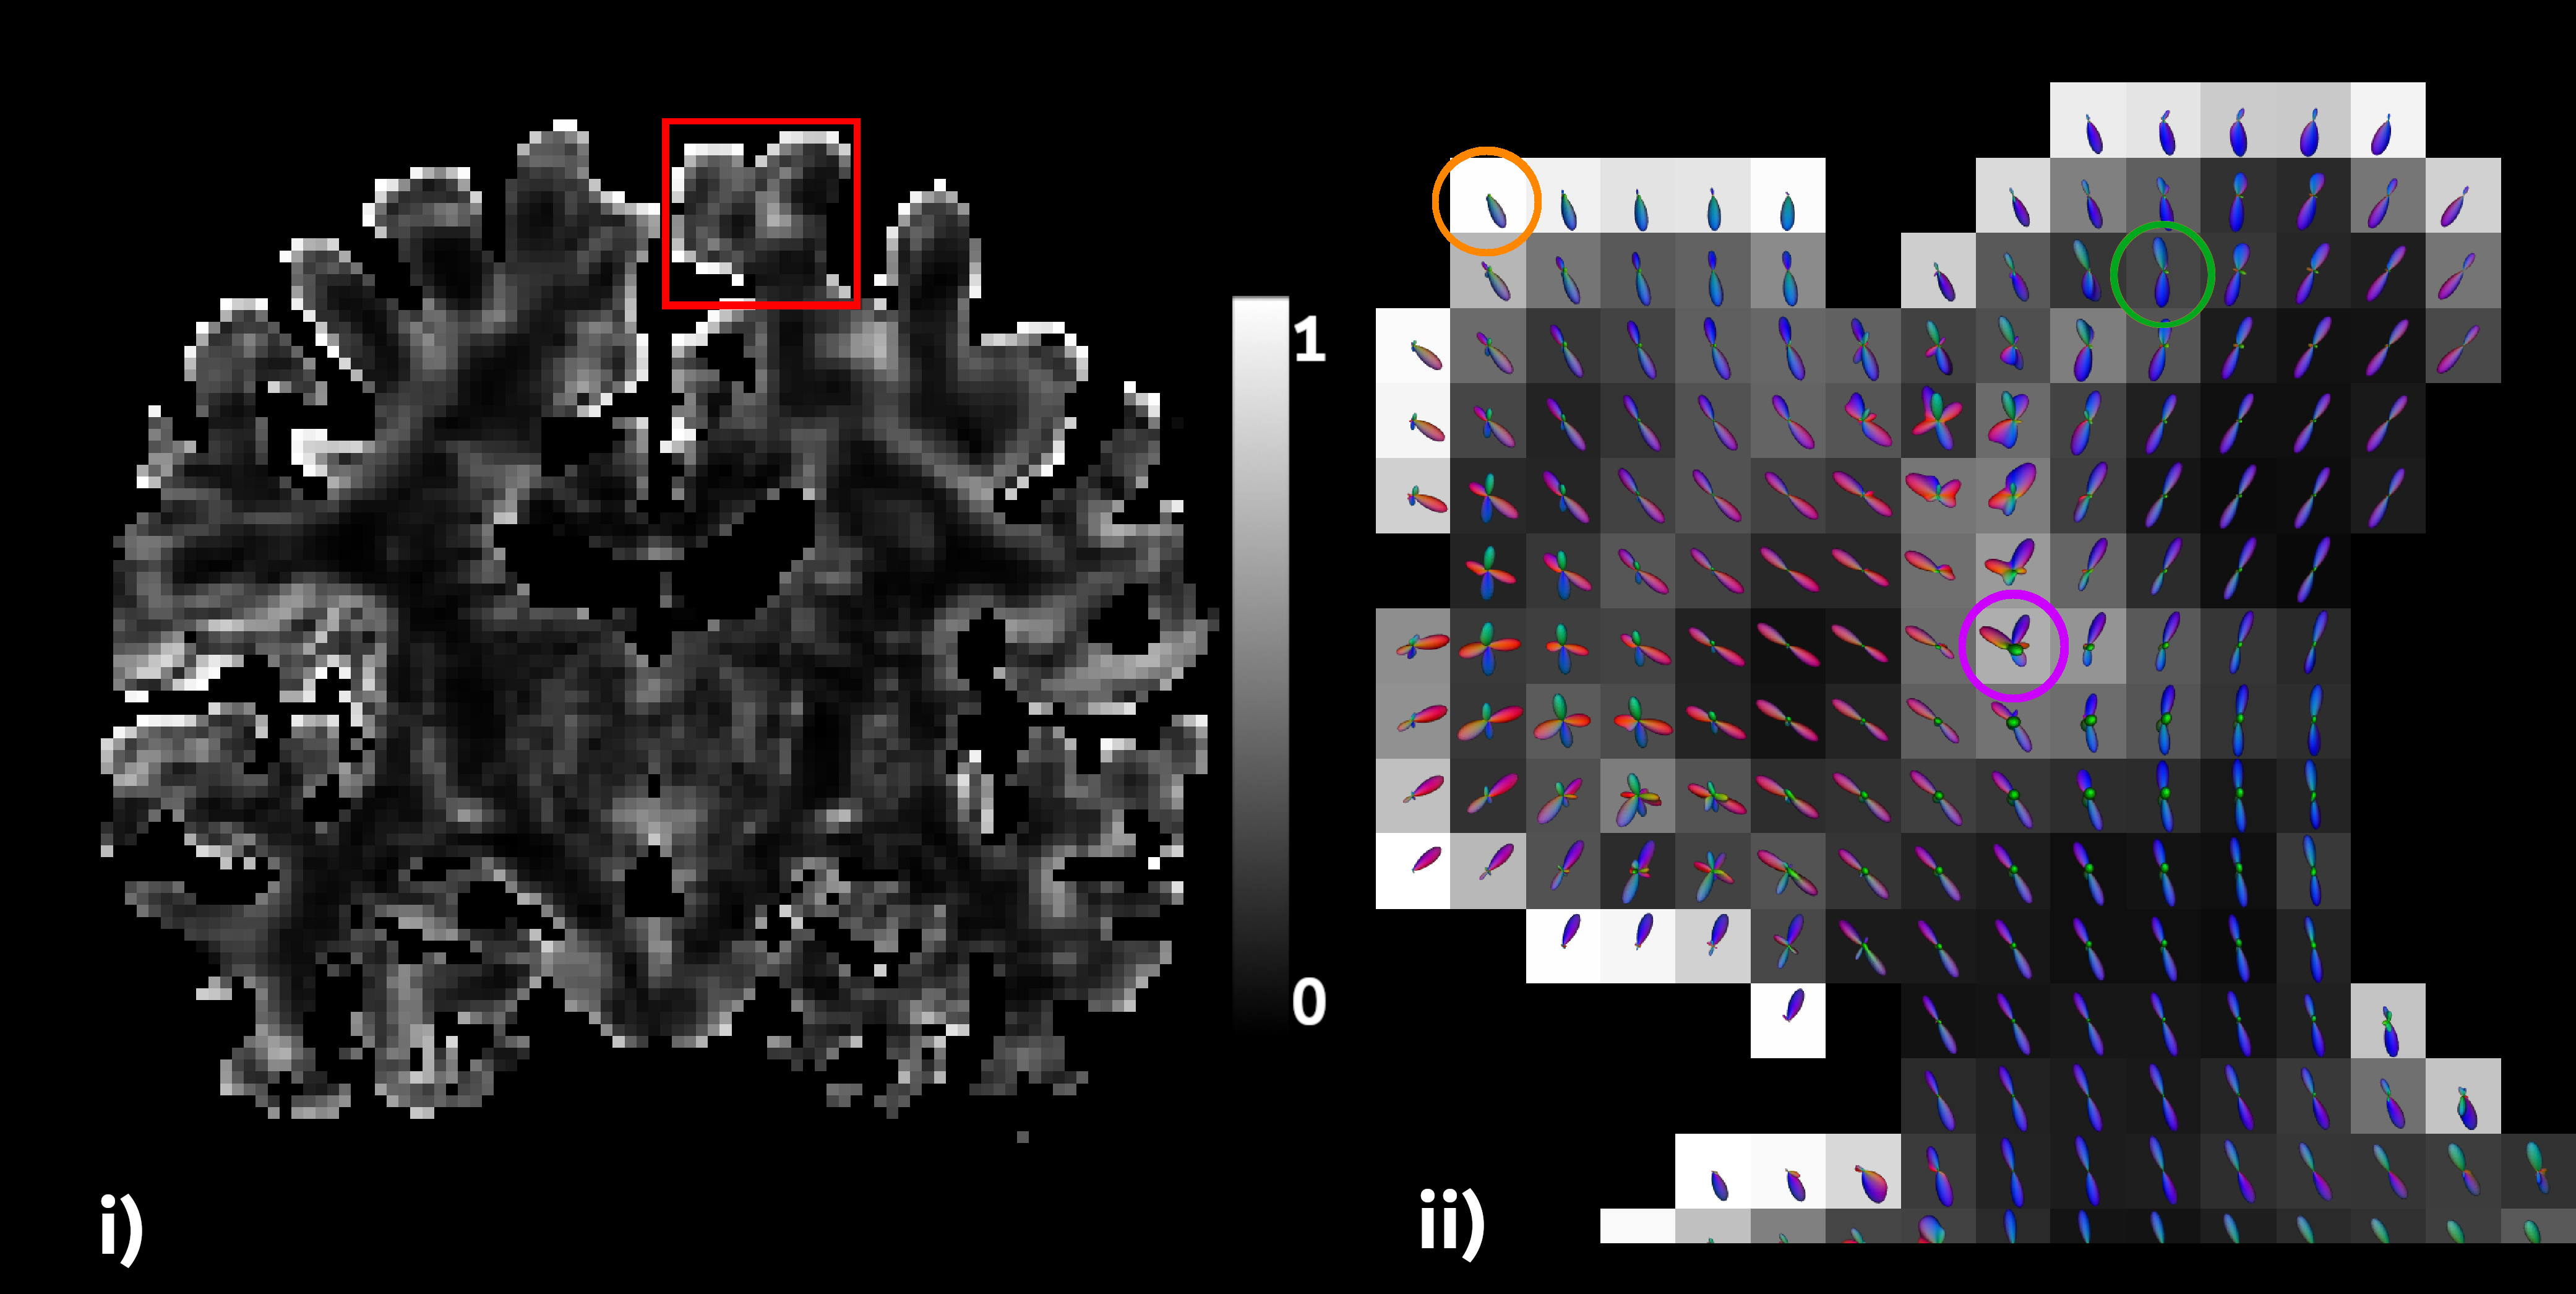
Figure 2: Odd-power map (i) in coronal orientation for a HCP subject. Only voxels with one or more extracted peaks are displayed. The WM/GM interface, as well as regions with a high number of crossing fibers, display high odd-power values. The subfigure on the right shows the ava-fODF glyphs, revealing unidirectional orientations on the WM/GM interface (orange circle), intra-voxel bendings (green circle) and other complex configurations (pink circle) in regions of high odd-power.
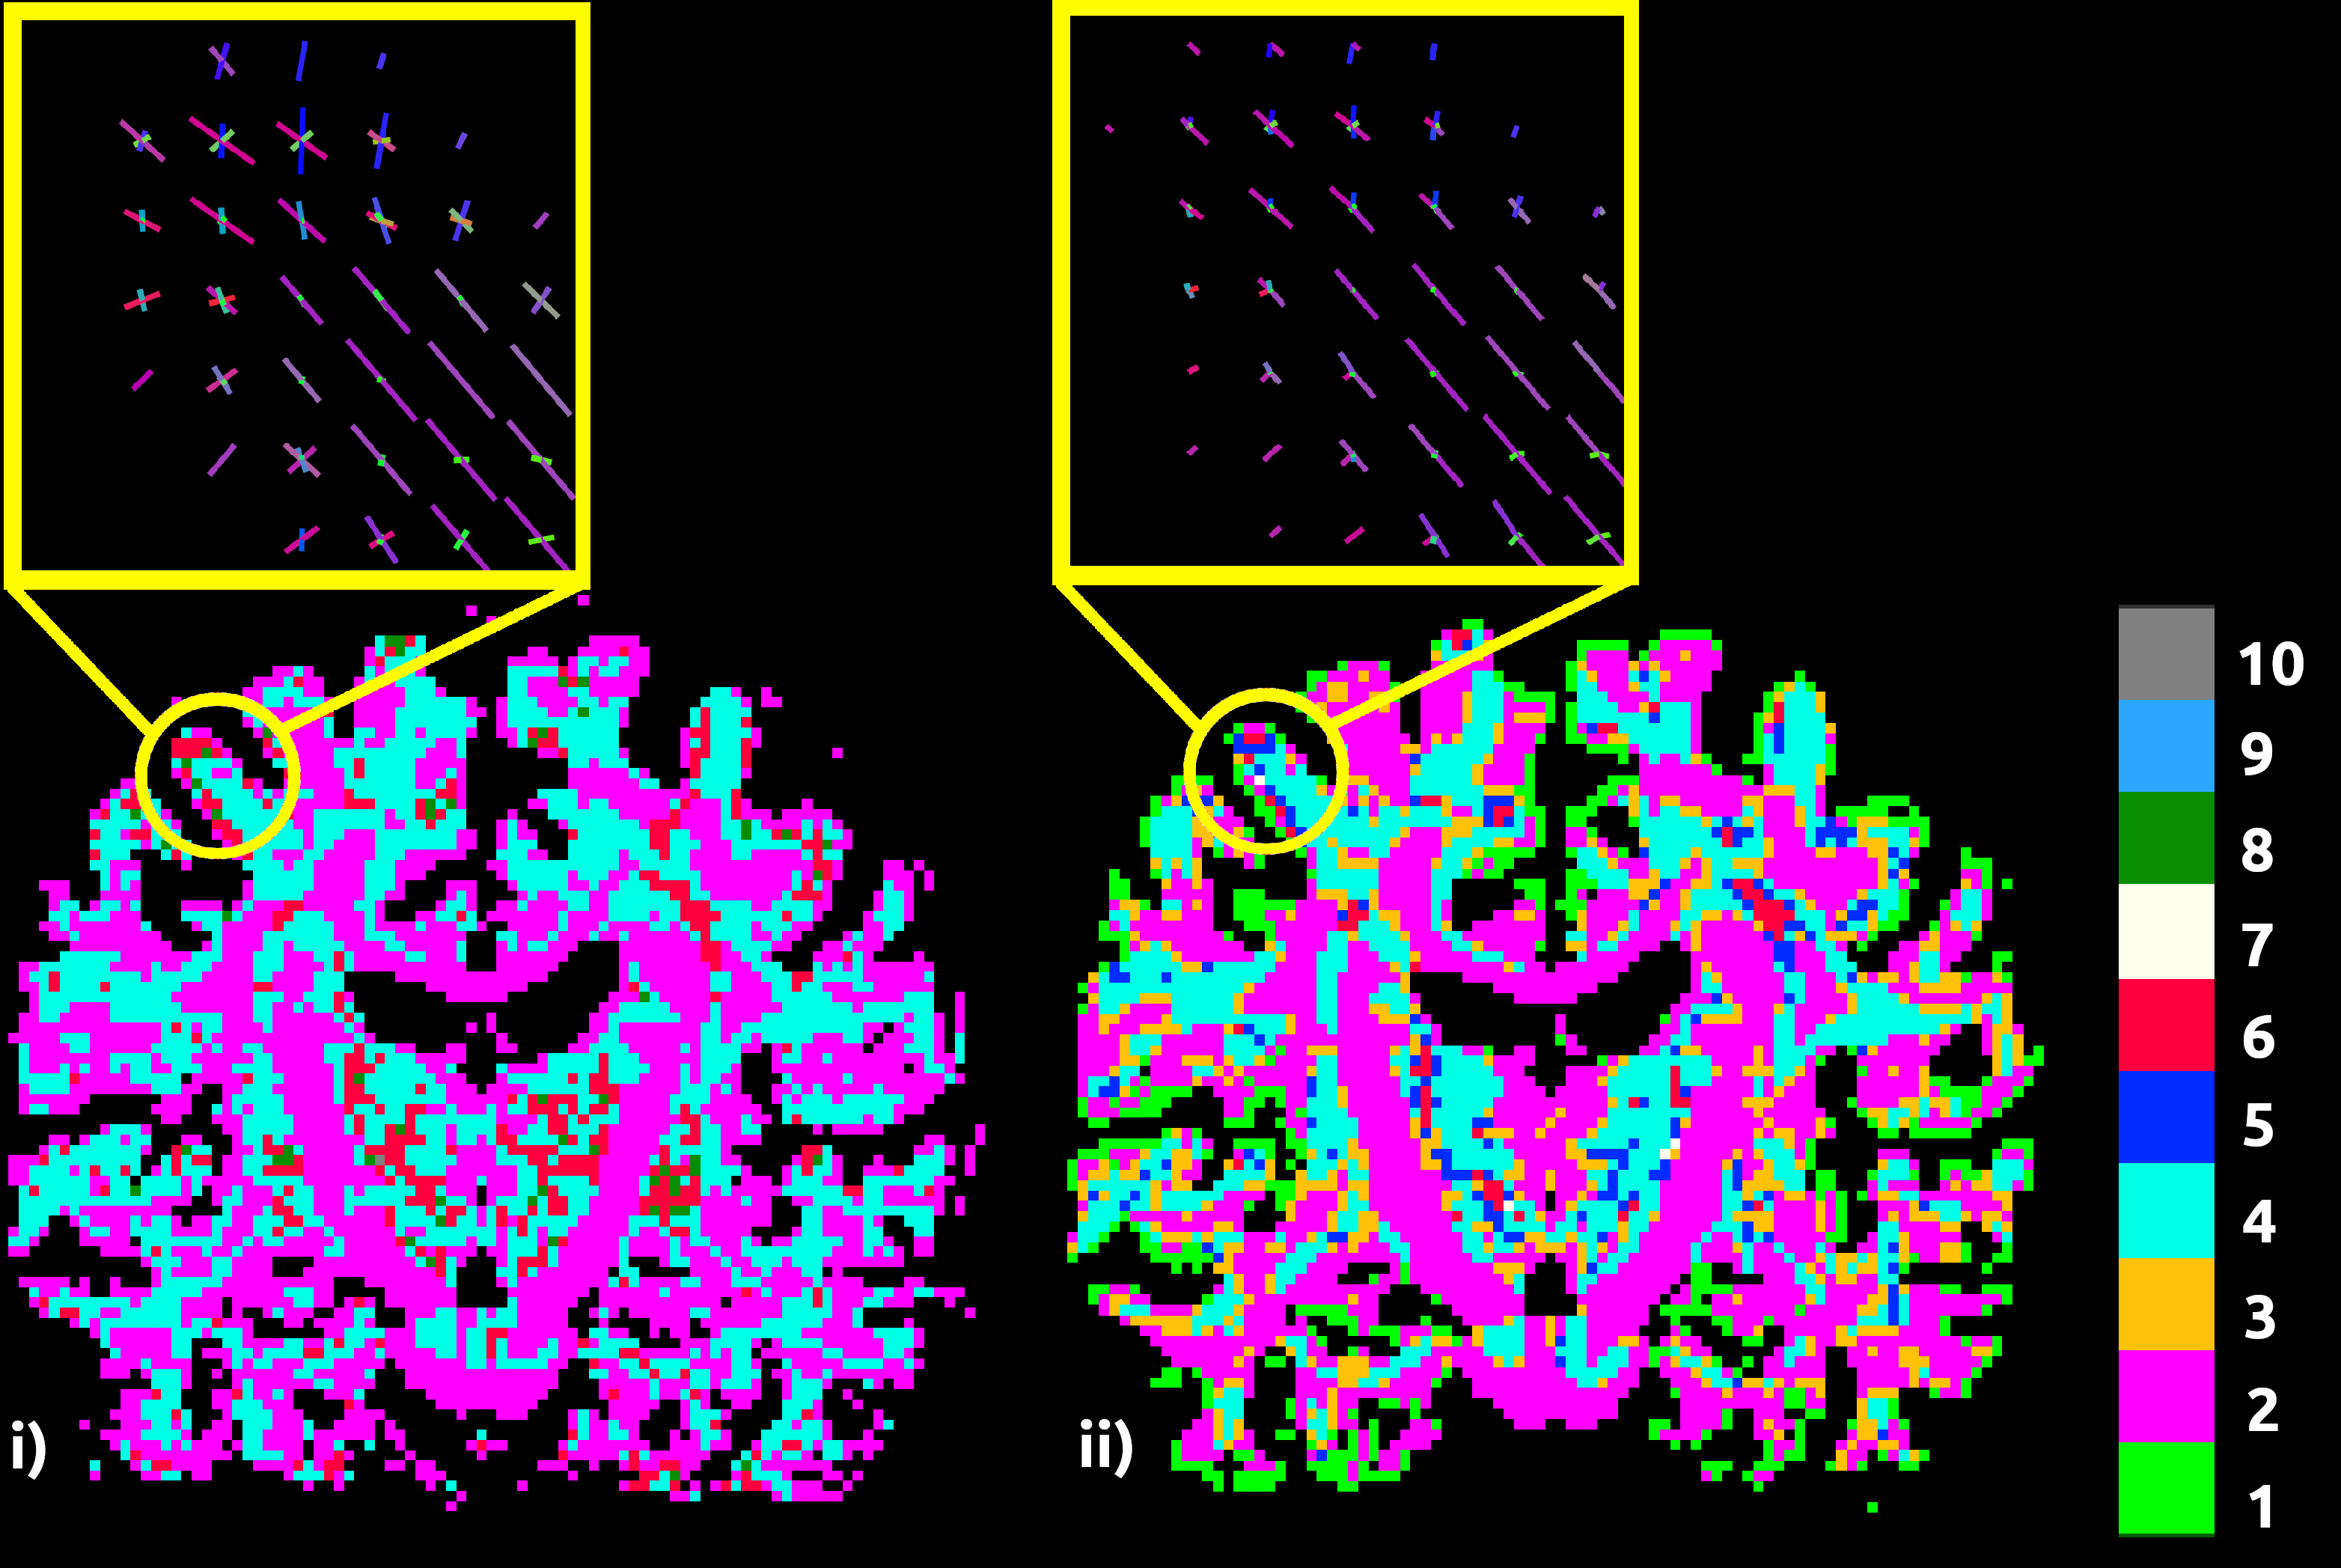
Figure 3: Nupeaks maps for input WM fODF (i) compared to ava-fODF (ii). The ava-fODF nupeaks map reveals odd nupeaks values at the regions bordering different even nupeaks values. The green ring in ii) is consistent with the unidirectional fiber orientations found at the WM/GM interface. Peaks extracted for fODF and ava-fODF in a gyral blade, in yellow, show that the filtering algorithm reduces the number of available fiber directions in voxels near the WM/GM interface.
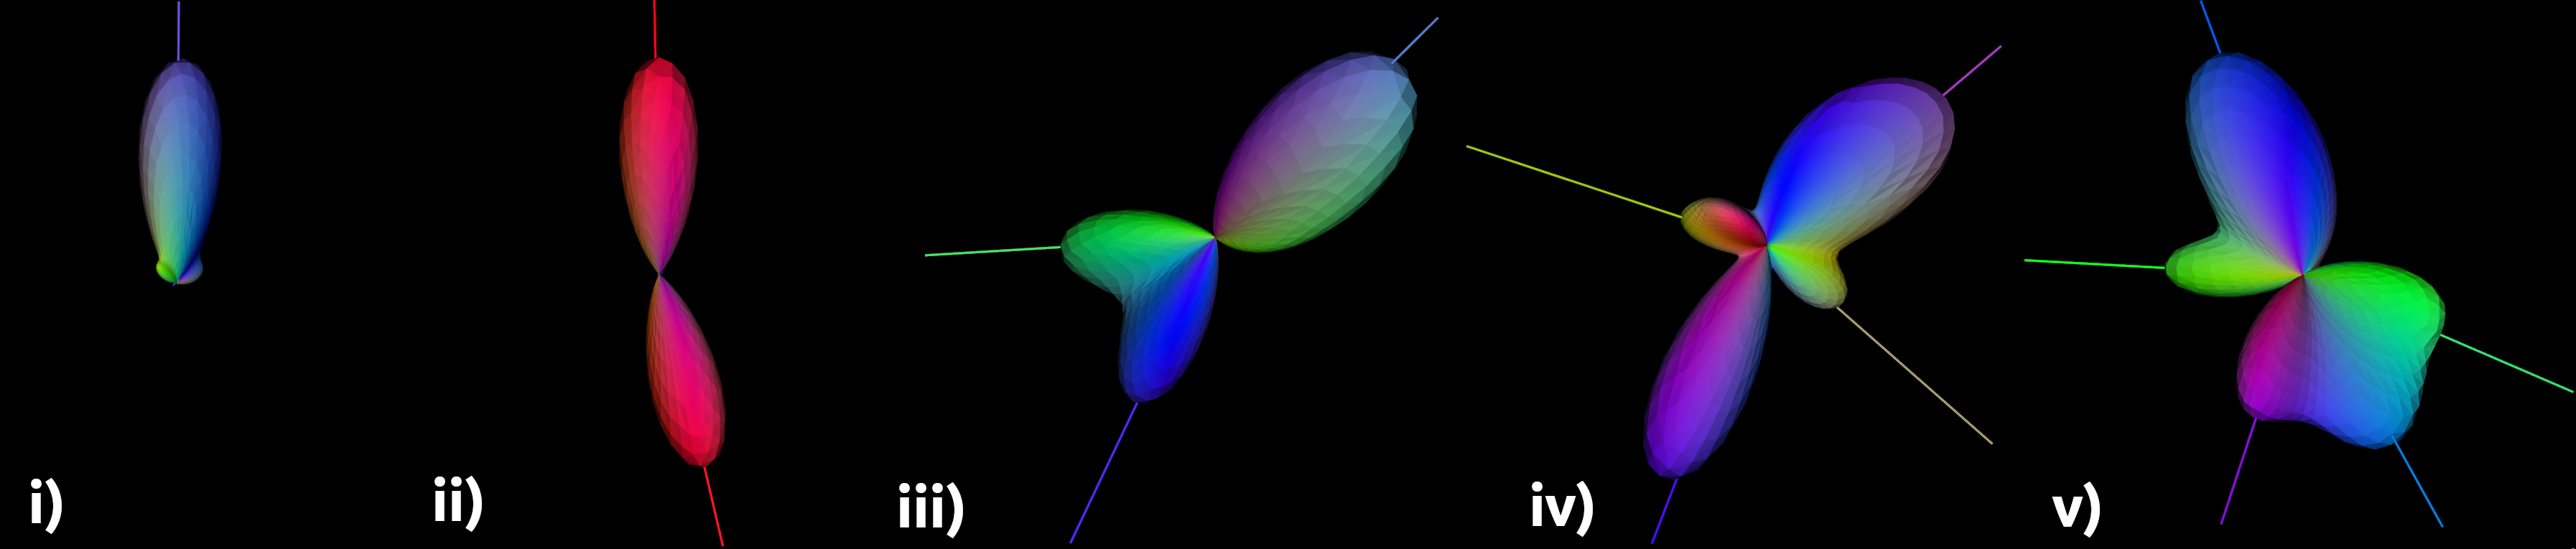
Figure 4: Visualization of ava-fODF found inside the WM as radially scaled spherical functions, with their extracted peak directions, for nupeaks values of 1 to 5 (left to right). These glyphs highlight new asymmetric fODF classes such as: i) unidirectional fODF, ii) bending single-fiber ODF, iii) Y-branchings, iv) asymmetric 2-fibers crossings and v) other complex fiber distributions.
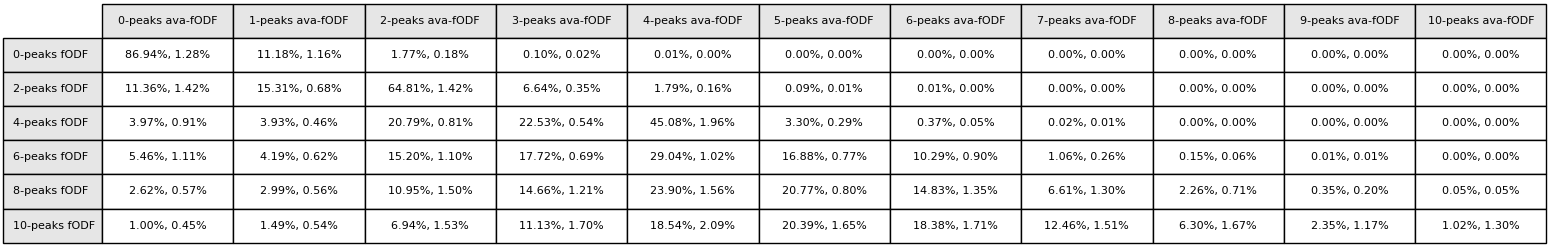
Figure 5: Mean proportions (with standard deviations) of n-peaks fODF becoming m-peaks ava-fODF in WM on 24 HCP subjects. For fODF with less than 4 peaks, the majority of n-peaks fODF stays n-peaks ava-fODF. However, where the number of peaks is of 4 or more, there are more fODF getting downgraded to a lesser number of ava-fODF peaks than there are keeping their original nupeaks value. For fODF of 6 or more peaks, an important proportion turns into 4-peaks ava-fODF.