0863
The microscopy connectome: towards 3D PLI tractography in the BigMac dataset1FMRIB Centre, Wellcome Centre for Integrative Neuroimaging, University of Oxford, Oxford, United Kingdom, 2Wellcome Centre for Integrative Neuroimaging, Experimental Psychology, Medical Sciences Division, University of Oxford, Oxford, United Kingdom, 3MRC Oxford Institute for Radiation Oncology, Department of Oncology, University of Oxford, Oxford, United Kingdom, 4Donders Institute for Brain, Cognition and Behaviour, Radboud University Nijmegen, Nijmegen, Netherlands, 5Nuffield Department of Clinical Neurosciences, University of Oxford, Oxford, United Kingdom
Synopsis
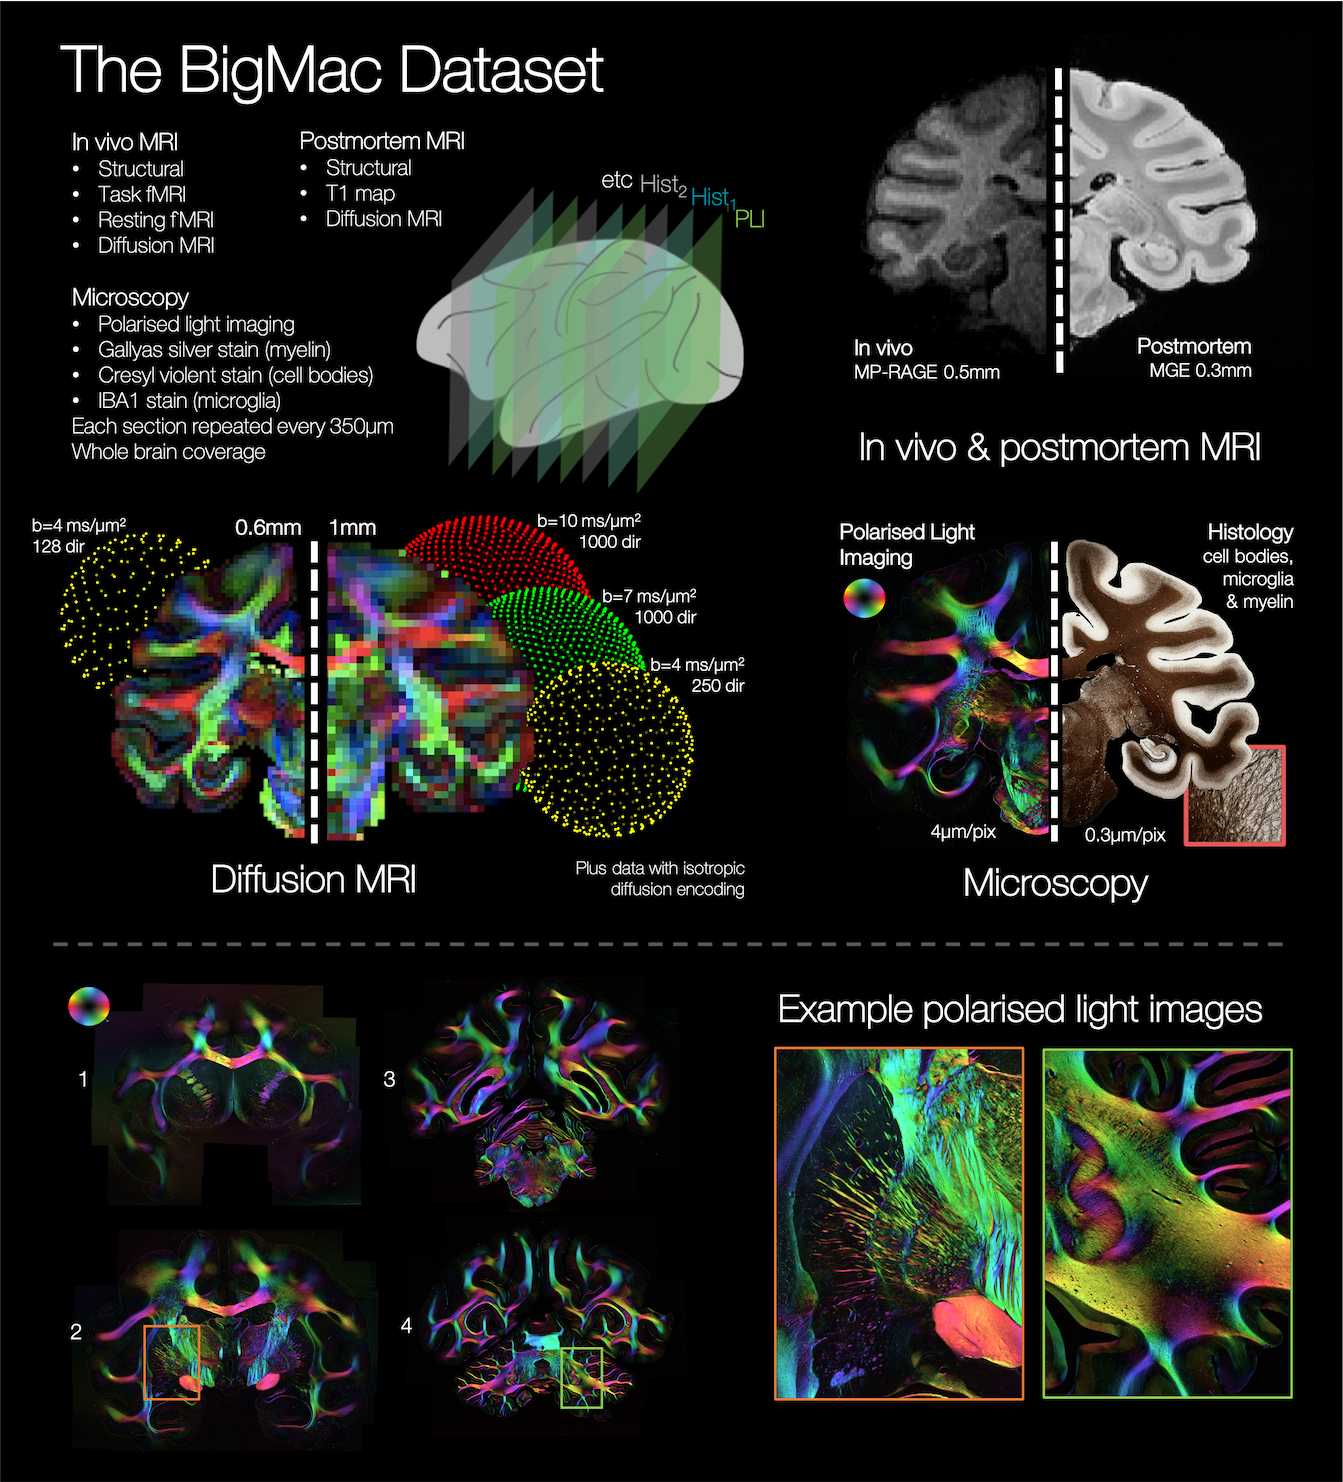
The BigMac dataset is a unique resource that includes extensive MRI and densely sampled microscopy data acquired in a single, whole macaque brain. However, the high-resolution microscopy currently only informs on the fibre orientations in the 2D plane of sampled slides, precluding 3D reconstruction of the microscopy connectome. Here we use precise co-registration and joint modelling of diffusion MRI and polarised light images to reconstruct the microscopy fibre orientations in 3D. This will facilitate future determination of the whole brain, microscopy-inspired connectome, which we expect will provide neuroanatomical insight, and play a vital role in validating and advancing invivo tractography.
Introduction
Multimodal datasets that combine diffusion MRI (dMRI) with microscopy data, offer a ‘ground truth’ estimate of the connectome, providing a unique opportunity to both assess the performance of tractography and, crucially, drive algorithm design. To facilitate fair comparison, the multimodal data ideally i) is acquired in the same single brain, ii) has whole brain coverage, iii) includes co-registration of microscopy and MRI data with high precision and iv) provides 3D fibre orientation estimates from microscopy (whereas many microscopy techniques are limited to 2D in-plane orientations).The BigMac dataset1 is a resource under active development that has the potential to fulfil these criteria. BigMac combines extensive MRI data (invivo and postmortem) with multi-contrast microscopy acquired throughout a single, macaque brain (Figure 1, criteria i&ii). In this work we demonstrate precise co-registration of the MRI and microscopy data (criterion iii), and reconstruct the 2D microscopy fibre orientations as full 3D vectors in dMRI space (criterion iv). This will facilitate future whole brain reconstruction of the 3D microscopy connectome at high spatial resolution. We expect this microscopy connectome to both provide new anatomical insight, and be a valuable resource for the diffusion modelling community. Upon publication, BigMac data and tools will be made openly available.
Method
The BigMac dataset includes polarised light imaging2,3,4 data (PLI) that utilises the birefringence of myelin to estimate the primary fibre orientation per microscopy pixel. A major shortcoming of conventional PLI is that fibre inclinations (through microscopy plane) can only be estimated by either specialist hardware4 (tilting stages) or strong assumptions about tissue properties (amount and birefringence of myelin).In BigMac, coronal PLI data were acquired every 350 μm along the rostro-caudal axis, with an in-plane resolution of 4 μm per pixel. Here we use the PLI estimate of the fibre orientations within the microscopy plane, and approximate the through-plane ‘inclination’ angle with that from dMRI, to reconstruct 3D ‘hybrid dMRI-microscopy fibre orientations’ at the resolution of the microscopy data. Though this work focuses on PLI, our current method is also applicable to e.g. myelin-stained slides.
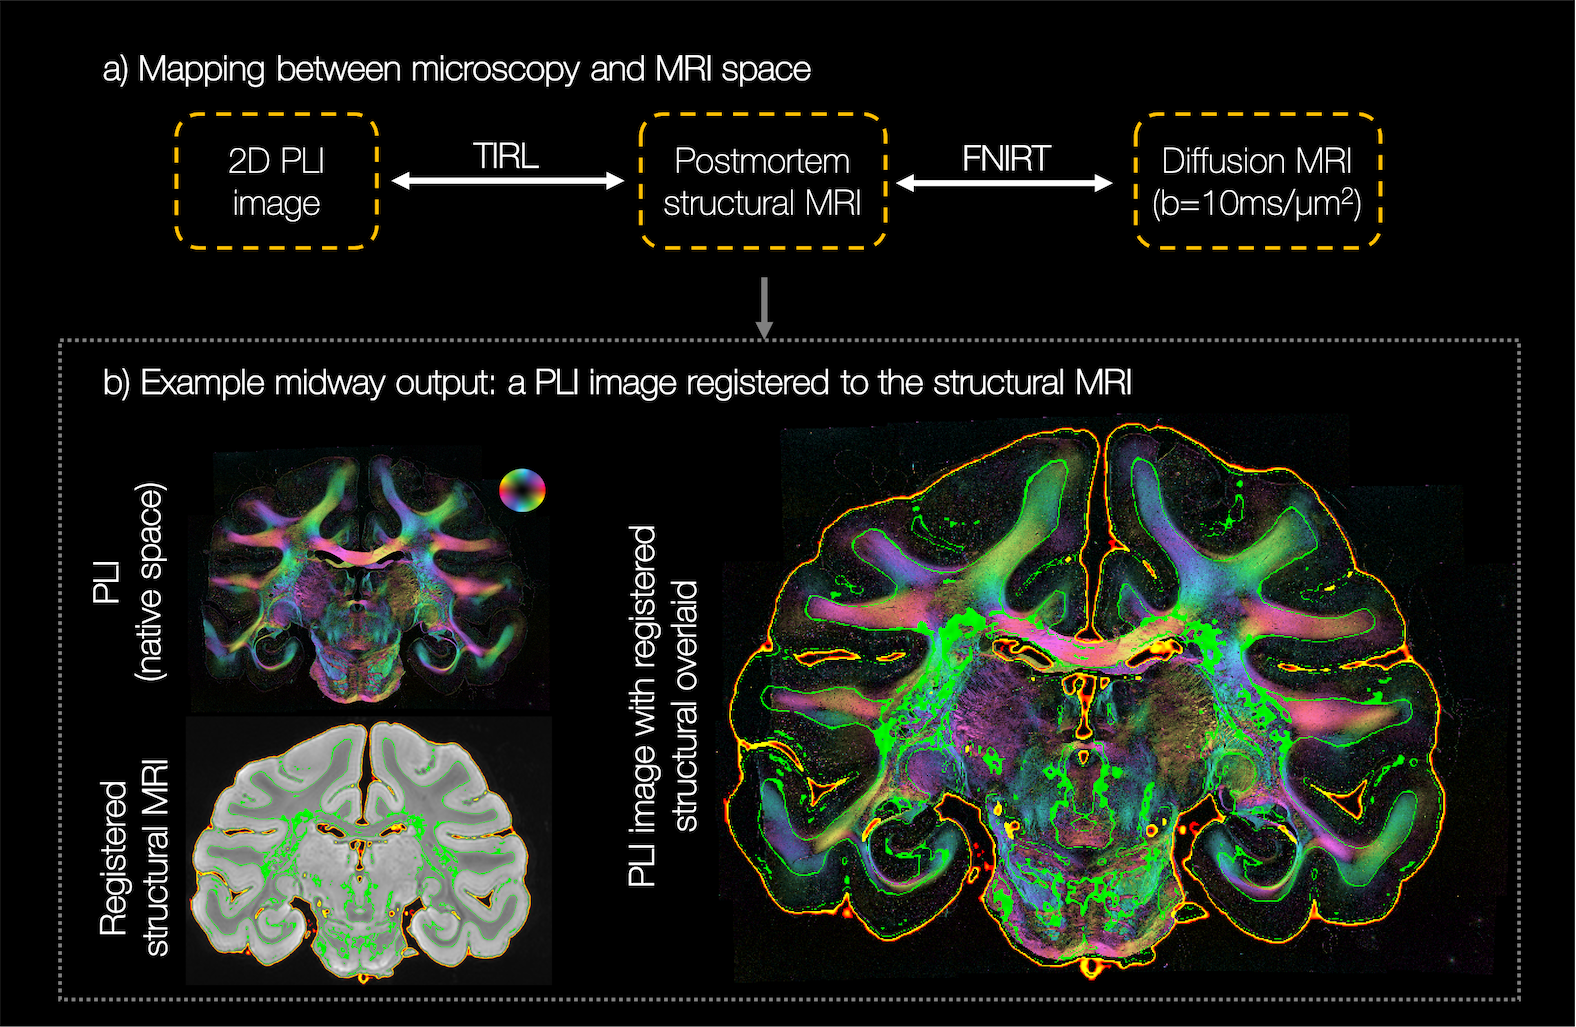
Diffusion MRI data (b=10ms/μm2, 1000 gradient directions, 1mm isotropic) were analysed using the ball and stick5,6 (BAS) model to estimate $$$\leq3$$$ fibre populations per voxel, with 50 orientation estimates or ‘samples’ per population. The PLI images were co-registered to the dMRI data using an optimised TIRL7 protocol (Figure 2). The in-plane angle was warped into the diffusion space and compared to the BAS samples within the corresponding dMRI voxel. To facilitate fair comparison, the BAS samples were projected onto the microscopy plane. Samples from BAS fibre populations with signal fractions <0.1 were excluded. Finally, the microscopy through-plane angle was approximated by that from the most similar BAS sample. This produced a hybrid dMRI-microscopy 3D fibre orientation per microscopy pixel. To have fibre orientations populate a substantial volume in dMRI space, the process was repeated for 25 consecutive PLI slides.
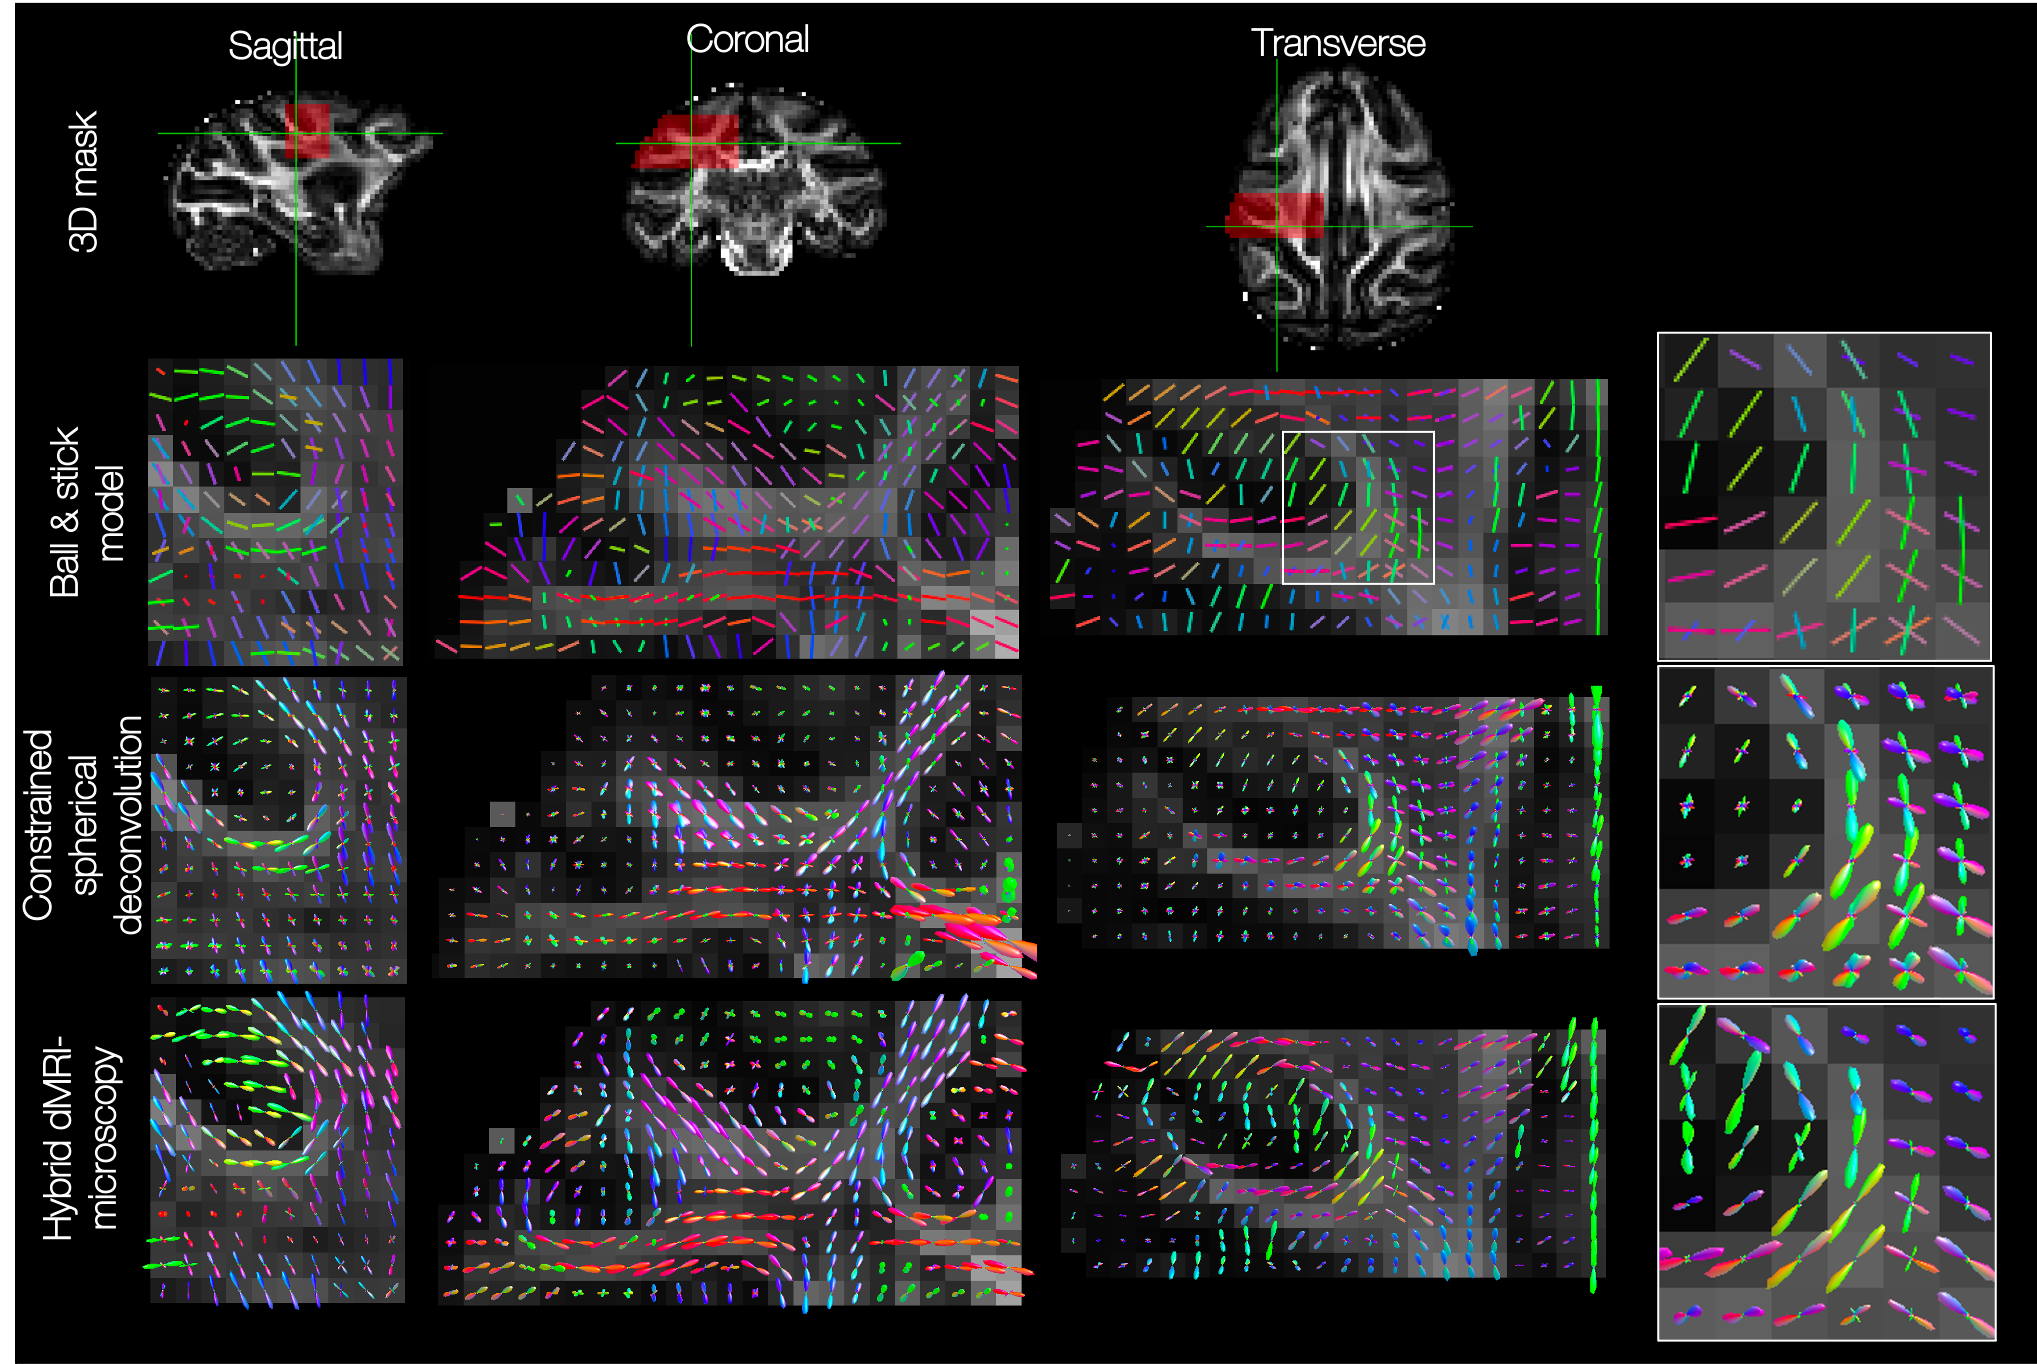
The hybrid fibre orientations were then combined into 3D fibre orientation distributions (FODs) for comparison with dMRI equivalents. Here, a set of voxels were defined in dMRI space. In each voxel, the hybrid dMRI-microscopy fibre orientations populated a 3D ‘orientation histogram’ defined by 256 points evenly spaced across the sphere. Spherical harmonics of order 8 were then fitted to the normalised histogram. In spherical harmonic format, the hybrid dMRI-microscopy FODs could then be visualised in standard MRI viewers8,9 and input into existing tractography methods9. For comparison, the dMRI data were also processed using constrained spherical deconvolution10.
Results
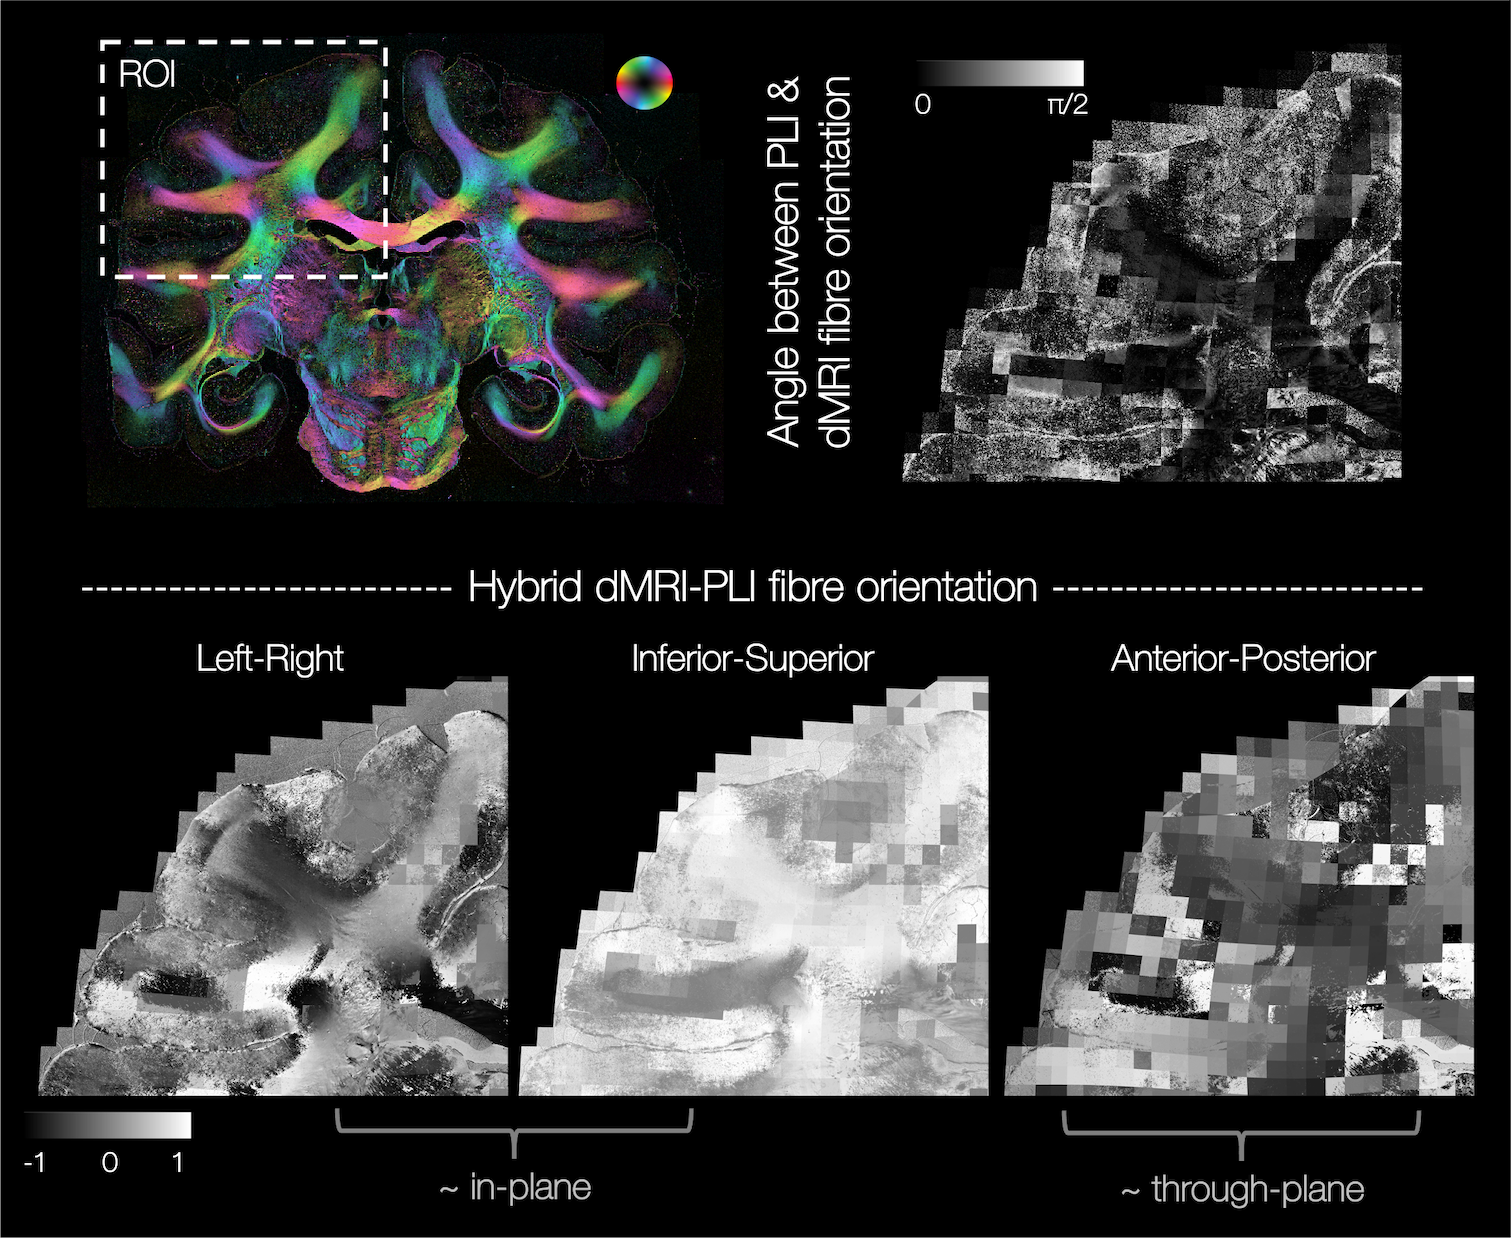
Figure 2 demonstrates excellent registration of the 2D PLI images into the 3D MRI volume, with close alignment of the tissue boundaries.In our method, the through-plane microscopy orientation is approximated by that from the BAS model. This assumption is most valid when the PLI and BAS fibre orientations in the microscopy plane are highly similar, as demonstrated throughout the majority of the white matter (Figure 3 top).
Figure 3 bottom shows example hybrid dMRI-PLI 3D fibre orientations from a single microscopy section. Near the microscopy plane (LR-IS), we retain high resolution information from the microscopy data (4x4μm). The through-plane information is often coarser resolution, comparative to the MRI.
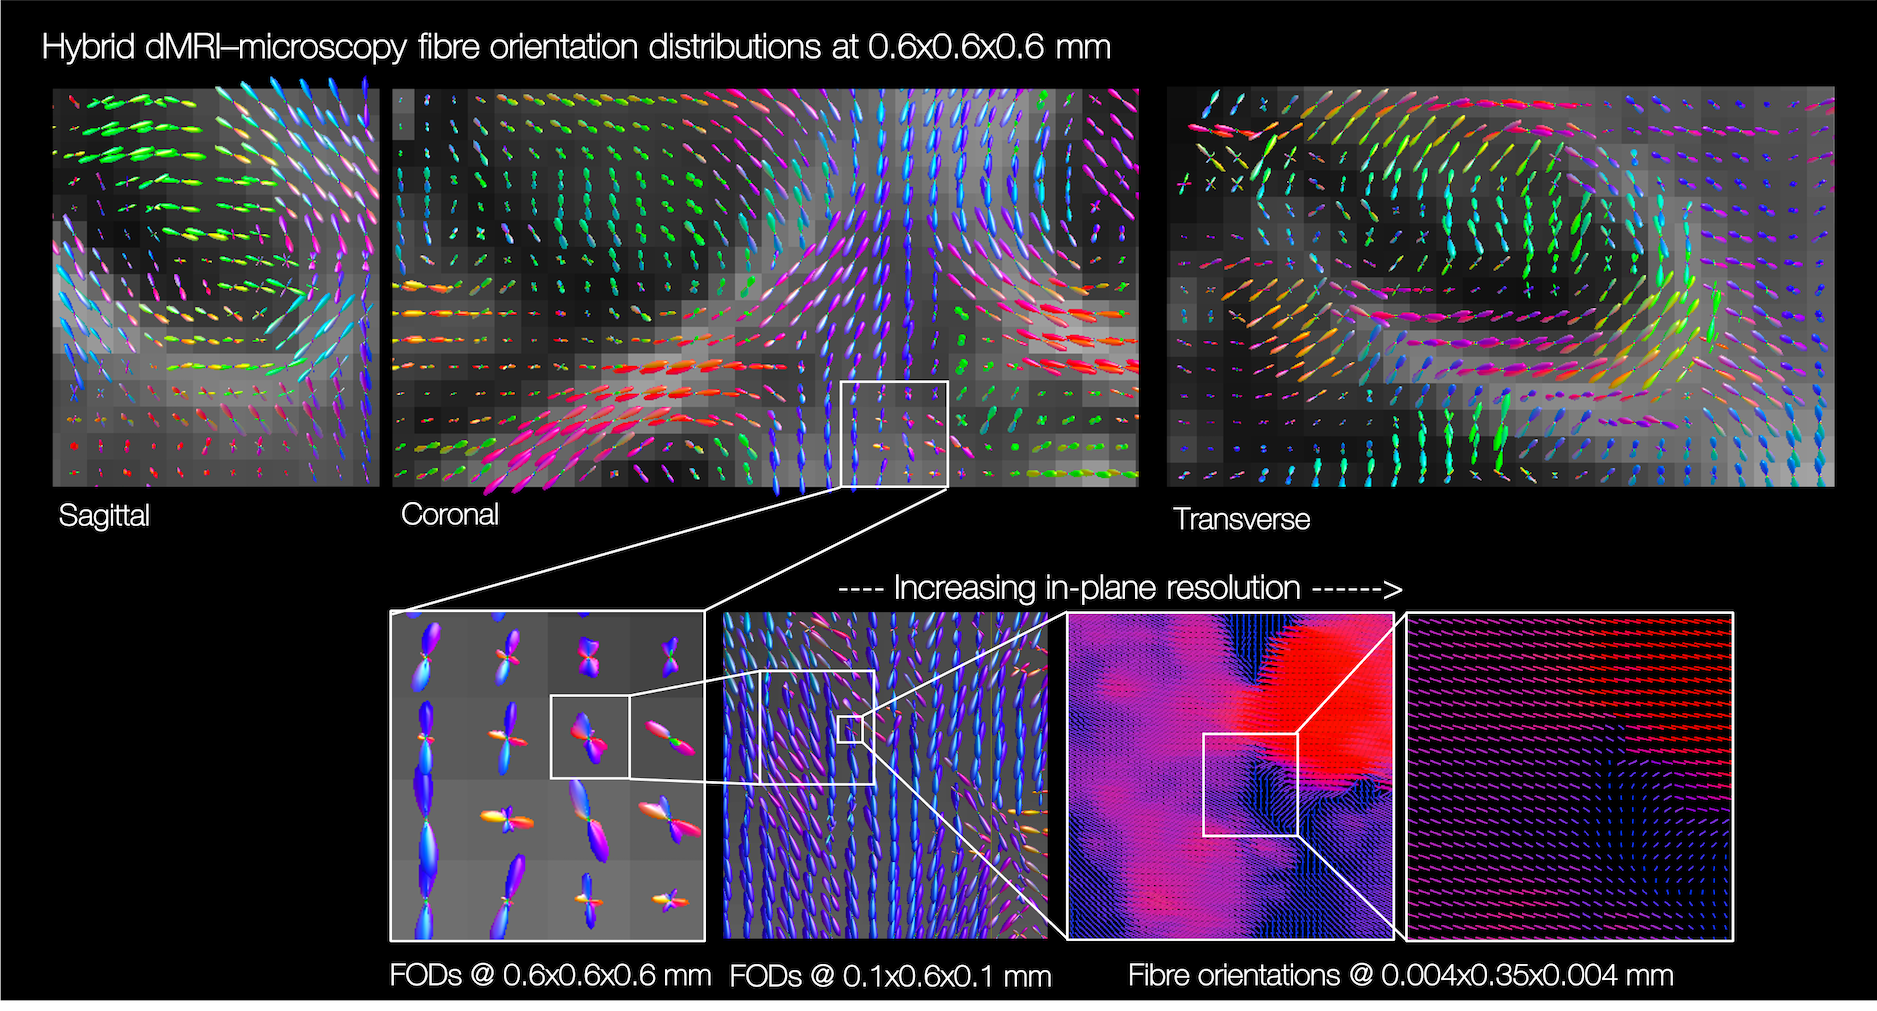
The hybrid dMRI-PLI fibre orientations were then reconstructed into FODs at varying spatial resolutions (Figures 4&5). Reassuringly, the hybrid dMRI-microscopy FODs show smoothly varying patterns in all three dimensions, but notably reconstruct fewer crossing fibre populations than that suggested by dMRI (Figure 4). Furthermore, we observe smoothly varying through-plane fibre orientations even when the hybrid FODs are of higher spatial resolution than the dMRI (0.6 versus 1 mm, Figure 5). Finally, the hybrid FODs show structural details at very high in-plane resolutions ($$$\gtrsim$$$4x4μm in-plane, $$$\gtrsim$$$350μm through-plane).
Future work
Here only the 2D ‘in-plane’ PLI estimate informs on the hybrid dMRI-PLI vectors. However, the PLI signal is itself sensitive to the fibre orientation in 3D2,3,4. A second PLI parameter, the retardance $$$\delta$$$, is related to the through-plane angle $$$\alpha$$$, where$$\delta\approx t\cos^2\alpha,$$
and $$$t$$$ is related to the thickness and birefringence of the myelin. Future work aims to use the dMRI data to estimate $$$t$$$. The PLI fibre orientation can then be reconstructed in 3D, without subsequent input from the dMRI data.
Acknowledgements
AFDH and INH were supported by the EPSRC and MRC (grants EP/L016052/1 and MR/L009013/1). AK and NS were funded by CRUK (grant C5255/A15935). The work of RBM is supported by BBSRC UK [BB/N019814/1]. JS was supported by a Sir Henry Dale Wellcome Trust Fellowship (105651/Z/14/Z). KLM and SJ were supported by the Wellcome Trust (grants WT202788/Z/16/A and WT215573/Z/19/Z). The Wellcome Centre for Integrative Neuroimaging is supported by core funding from the Wellcome Trust (203139/Z/16/Z). It should be noted that SJ and KM contributed equally to this work.References
1. Howard AFD, et al. The BigMac dataset: ultra-high angular resolution diffusion imaging and multi-contrast microscopy of a whole macaque brain, ISMRM 27th Annual Meeting, 2019
2. Axer H, et al. Quantitative estimation of 3-D fiber course in gross histological sections of the human brain using polarized light, Journal of Neuroscience Methods, 2001
3. Larsen L, et al. Polarized light imaging of white matter architecture, Microscopy Research and Technique, 2007
4. Axer M, et al. High-Resolution Fiber Tract Reconstruction in the Human Brain by Means of Three-Dimensional Polarized Light Imaging, Frontiers in Neuroinformatics, 2011
5. Behrens TE, et al. Characterization and propagation of uncertainty in diffusion-weighted MR imaging. Magnetic Resonance in Medicine, 2003
6. Behrens TE, et al. Probabilistic diffusion tractography with multiple fibre orientations. What can we gain? NeuroImage, 2007
7. Huszar IN, et al. Tensor Image Registration Library: Automated Non-Linear Registration of Sparsely Sampled Histological Specimens to Post-Mortem MRI of the Whole Human Brain, bioRxiv, 2019
8. McCarthy P, FSLeyes, Zenodo, 2020
9. Tournier JD, et al. MRtrix3: A fast, flexible and open software framework for medical image processing and visualisation. NeuroImage, 2019
10. Tournier JD, et al. Robust determination of the fibre orientation distribution in diffusion MRI: non-negativity constrained super-resolved spherical deconvolution. Neuroimage, 2007
11. Andersson JLR, et al. Non-linear registration, aka spatial normalisation, FMRIB technical report TR07JA2, 2010
Figures