0850
Diffusion Tensor Imaging and Fiber Tractography in Porcine Meniscus1Duke University, Durham, NC, United States, 2Radiology and Imaging Sciences, Indiana University, Indianapolis, IN, United States
Synopsis
Recently, diffusion MRI and tractography in musculoskeletal system has used to investigate the tissue microstructure, local collagen fiber alignment, and the 3D collagen network. To the best of our knowledge, nondestructively probing the local collagen fiber direction and 3D collagen fiber architecture is still limited. The water diffusion properties derived from DTI were quantified at different areas of meniscus using the proposed automatic segmentation method. Combining tractography and automatic segmentation, we were able to observe the structural connections among different areas of the meniscus.
Purpose
To evaluate the three-dimensional collagen fiber architecture of porcine meniscus using diffusion MRI.Introduction
Magnetic resonance imaging (MRI) is the modality of choice for diagnosing meniscal tears with both high sensitivity and specificity1. Diffusion MRI (dMRI) has been used to reveal the microstructure of different tissues due to its sensitivity to the microscopic cellular organization2. Recently, dMRI and tractography in musculoskeletal system has attracted more and more attention to investigate the tissue microstructure, local collagen fiber alignment, and the 3D collagen network3,4. To the best of our knowledge, nondestructively probing the local collagen fiber direction and 3D collagen fiber architecture have not been reported yet, probably due to a few reasons. First, the tractography is challenging in menisci due to the low FA and short T2 values. Second, the spatial resolution is often limited for meniscus MRI due to its thin-layer anatomical structure. Third, automatic segmentation of these tissues to different sub-regions is still lack for the structural connectivity analysis5.Methods
The specimens were scanned on a 7.0 T small animal MRI system (Magnex Scientific, Yarnton, Oxford, UK) equipped with 650 mT/m gradient coils (Resonance Research Inc., MA, USA). RF transmission and reception were achieved using a homemade solenoid coil. A modified 3D Stejskal-Tanner diffusion-weighted spin-echo pulse sequence to support k-space under sampling was performed for diffusion MRI scans6. The acquisition protocol was used with the following parameters: Matrix size = 512 ×256 × 256, FOV = 64 ×32 × 32 mm3, TR = 100 ms, TE = 13.0 ms, 125 μm isotropic spatial resolution, b value = 1000 s/mm2 with 81 diffusion gradient encoding directions and 8 non-diffusion-weighted (b0) measurements. An acceleration factor of 8.0 was used for a sparsity approach, which has been described in detail previously (Wang et al 2020). The gradient separation time was 5.5 ms and the diffusion gradient duration time was 4.5 ms for all scans. The scan time was 20.1 hours. Temperature was monitored throughout all the scans and the fluctuation was less than 1 ºC. The meniscus was automatically segmented to different zones according to Cooper’s classification.Results
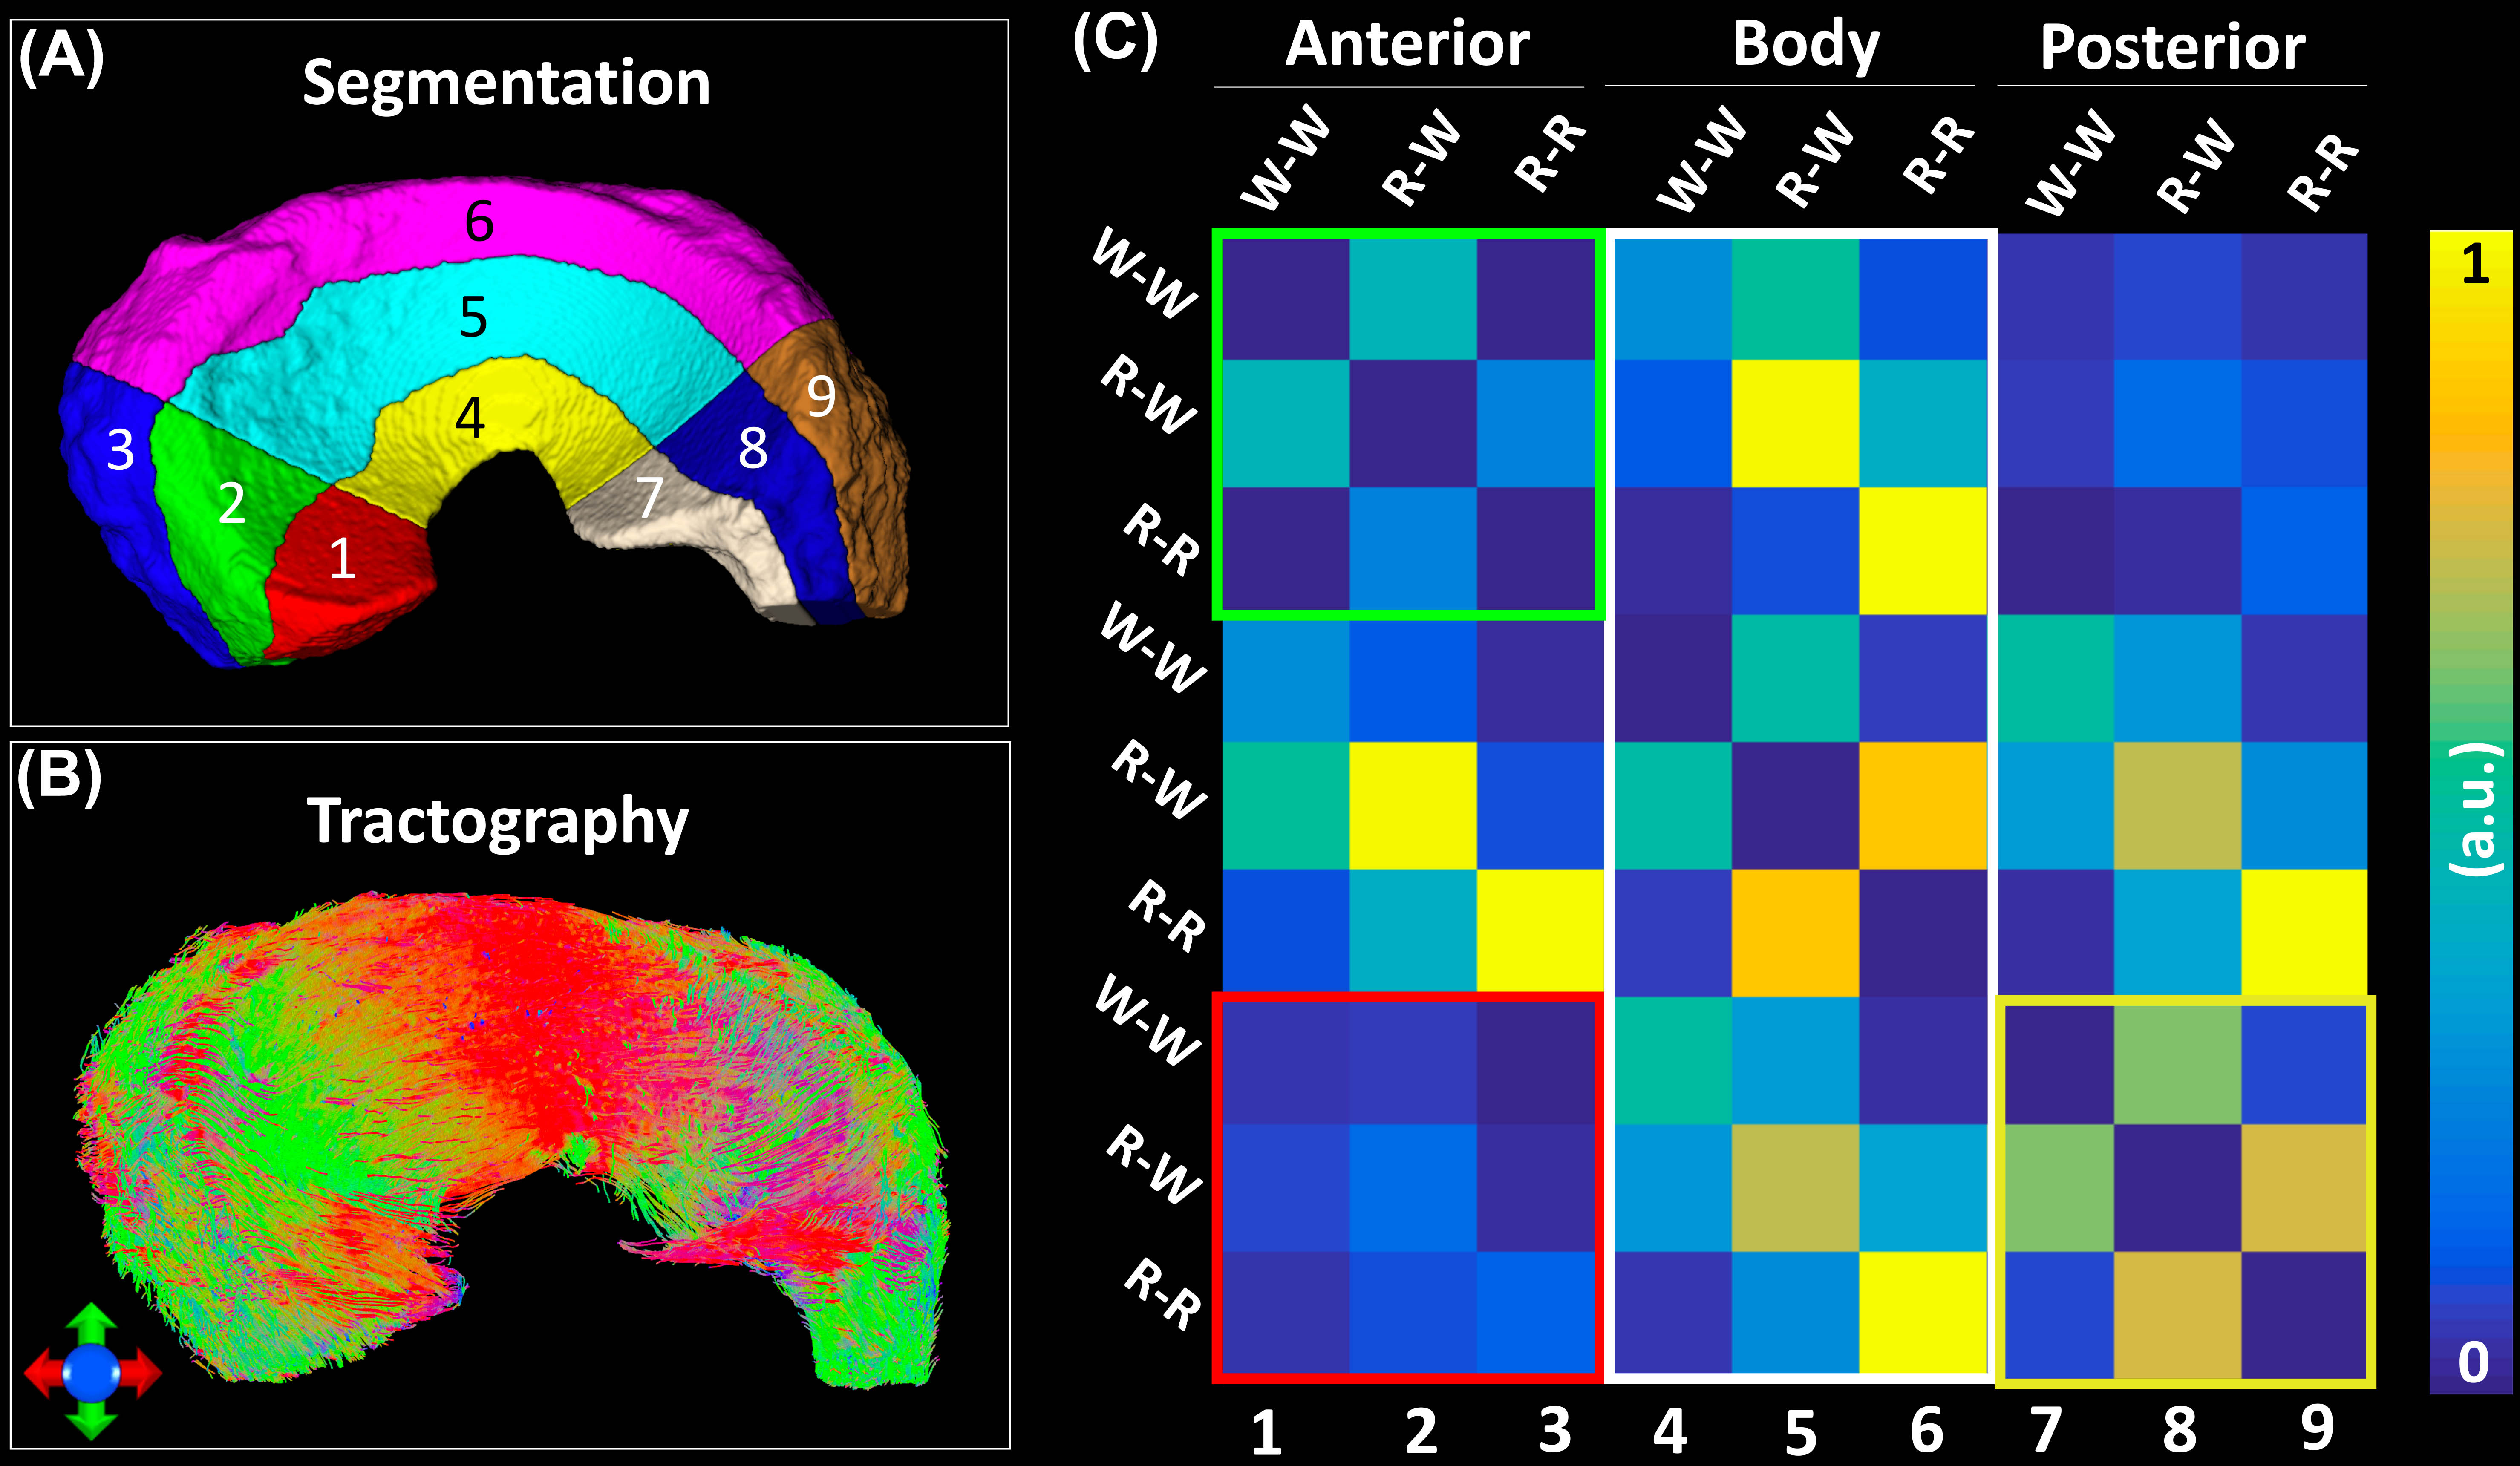
Figure 1 shows the automatic segmentation process used in this study, from the acquired DWI to the 9 different areas of meniscus. For Radial Segmentation, the meniscus was divided to R-R, R-W, and W-W zones. For Rotational Segmentation, the meniscus was divided to anterior, body, and posterior parts. In the final 9-region segmentation, each anterior, body, or posterior part contained W-W, R-W, and R-R zones. Figure 2 showed the mean volumes and quantitative DTI metrics in three different zones. Heterogeneous appearance of the meniscus at different zones was evident in FA image. The volume and FA gradually increased from W-W zone to R-R zone. In contrast, MD, AD, and RD values (d-f) gradually decreased from W-W zone to R-R zone. Figure 3 showed the color-FA and the fiber orientation images of meniscus at different regions. The collagen fiber showed orthotropic directions between the anterior part (ROI 1, green color) and the body part (ROI 3, red color), between the posterior part (ROI 4, green color) and the body part. In order to explore the entire meniscus 3D collagen fiber network, the tractography were performed in the whole meniscus area (Figure 4). The whole meniscus tracts revealed the coexistence of both radial and circumferential collagen fibers, especially in ROIs of 1, 3, 5 and 6. Figure 5 exhibited the automatic segmentation, the diffusion tractography, and the connection heatmap of meniscus. The anterior part showed low connections to the posterior part (red box in c), while the body part showed high connections to both anterior part and posterior part (white box in c).Discussion and Conclusion
The porcine meniscus microstructure was investigated using a 3D diffusion-weighed spin-echo pulse sequence. Strong zonal-dependent diffusion properties were demonstrated by DTI metrics (FA, MD, AD, and RD). The complex 3D collagen fiber architecture of the entire meniscus was successfully visualized by diffusion tractography. Combining tractography and automatic segmentation method, we were able to observe the structural connections among different areas of the meniscus. It may offer a novel method to evaluate the local meniscus tears and address the alteration of connections among different regions of the meniscus.Acknowledgements
This work was supported by NIH/NIBIB P41 EB015897 and Charles E. Putman MD Vision Award of the Department of Radiology, Duke University School of Medicine.References
1. Baum T, Joseph G, Karampinos D, Jungmann P, Link T, Bauer J 2013 Cartilage and meniscal T2 relaxation time as non-invasive biomarker for knee osteoarthritis and cartilage repair procedures. Osteoarthritis Cartilage 21 1474-14842.
2. Basser P J, Pierpaoli C 1996 Microstructural and physiological features of tissues elucidated by quantitative-diffusion-tensor MRI J. Magn. Reson. 111 209-2193.
3. Raya J G 2015 Techniques and applications of in vivo diffusion imaging of articular cartilage J. Magn. Reson. Imaging 41 1487-15044.
4. Wang N, Mirando AJ, Cofer G, Qi Y, Hilton MJ, Johnson GA. Diffusion tractography of the rat knee at microscopic resolution. Magnetic resonance in medicine 2019;81(6):3775-3786.Sweigart MA, Athanasiou KA. Toward tissue engineering of the knee meniscus. Tissue Eng 2001;7(2):111-129.5.
5. Saygılı A, Albayrak S 2019 An efficient and fast computer-aided method for fully automated diagnosis of meniscal tears from magnetic resonance images Artif. Intell. Med. 97 118-130.6.
6. Wang N, Mirando A J, Cofer G, Qi Y, Hilton M J, Johnson G A 2020 Characterization complex collagen fiber architecture in knee joint using high‐resolution diffusion imaging Magn. Reson. Med. 84 908-919
Figures