0849
The clinical value of MRI in quantitatively evaluating anterior cruciate ligament mucoid degeneration
Guangtao Fan1, Yudan Li1, Fenglin Xue2, Yilong Huang1, Yanlin Li3, Guoliang Wang3, Tianfu Qi1, Lisha Nie4, and Bo He1
1Department of Imaging, the First Affiliated Hospital of Kunming Medical University, Kunming, China, 2Department of Pathology, the First Affiliated Hospital of Kunming Medical University, Kunming, China, 3Department of Sports Medicine, the First Affiliated Hospital of Kunming Medical University, Kunming, China, 4GE Healthcare, Kunming, China
1Department of Imaging, the First Affiliated Hospital of Kunming Medical University, Kunming, China, 2Department of Pathology, the First Affiliated Hospital of Kunming Medical University, Kunming, China, 3Department of Sports Medicine, the First Affiliated Hospital of Kunming Medical University, Kunming, China, 4GE Healthcare, Kunming, China
Synopsis
The study aims to explore the clinical application value of MRI to quantitatively assess the anterior cruciate ligament mucoid degeneration (ACL-MD).The results indicated MRI Values of T1, T2 and T2*(relaxation time) show potential for diagnosis of ACL-MD and T2* may deliberately has the highest diagnostic efficacy.
Introduction
Anterior cruciate ligament mucoid degeneration (ACL-MD) is associated with nonspecific pain and limited extension or flexion of knee [1], which significantly reduces the quality of life of the patients. Due to lack of clinical knowledge, the diagnosis and treatment remain unclear[2], so it is urgent to strengthen the research in order to improve the understanding of this disease. Although conventional MRI examination is helpful for the diagnosis of ACL-MD, it is limited to the changes of qualitative morphology and signal intensity. ACL-MD is often misdiagnosed as partial ligament tear and other ligament injuries, and the previous studies have shown that its detection rate (2-14%) is far lower than autopsy (62.3%) [3-4]. Quantitative MRI is mostly used for non-invasive evaluation of the biochemical composition and ultrastructural changes of meniscus and cartilage, while studies on the evaluation of ACL are relatively rare, and no reports have been reported on ACL-MD. In this study, MRI was used to quantitatively analyze the changes in the relaxation time of ACL-MD and assess its diagnostic efficacy, so as to improve the understanding of ACL-MD and guide its clinical diagnosis and treatment.Material and Methods
This study was approved by the institutional review board, and written informed consent was obtained from all patients. Prospectively collecting 68 patients who were scheduled to undergo arthroscopic treatment from March to July 2020.The anterior cruciate ligament tissue from the lateral edge of the tibial end was taken during the operation examination. Basing on the pathological diagnosis result, some of them were divided into the group of normal anterior cruciate ligament group (21) and the ACL-MD group (19). All subjects underwent Routine sequences, sagittal 3D-FIESTA, T1mapping, T2mapping and T2*mapping (Figure 1) before the knee joint surgery on a 3.0 T MRI scanner(Discovery MR 750W, GE Healthcare, Waukesha, USA).The total acquisition time = 30 min 54 sec. Scan parameters of these sequence were shown in Table 1, and the scanned images were post-processed to measure the T1, T2, and T2* values of the tibial end of the anterior cruciate ligament of the knee joint, the relaxation time of the normal group and the ACL-MD group was compared by independent sample t test, and the gender difference between the two groups was tested by c² test. Diagnostic performances of T1 mapping, T2 mapping and T2* mapping was determined by receiver operating characteristic (ROC) analysis.Results
The T1, T2, and T2* values of ligaments in the ACL-MD group were (1291.9±273.4) ms, (54.8±10.6) ms, (30.6±6.4) ms, which were significantly higher than those in the normal group (1087.0±121.0) ms, (44.8±7.1) ms and (20.4±4.8)ms , and the difference was statistically significant (t values were 3.011, 3.473, 5.658, all P <0.001). The detailed results are shown in Table 2. By drawing the ROC curve(Figure 2 ) and calculating the AUC, the T1、T2、T2* AUC values are 0.747, 0.764, 0.912, the sensitivity of T1, T2, T2* values to diagnose the ACL-MD were 63.2%, 63.2%, 100%, and the specificity were 100%, 95.2%, 76.2%;T1mapping and T2mapping had better diagnostic efficiency in the diagnosis of ACL-MD, and the diagnostic efficiency of T2*mapping was better than T1mapping and T2mapping (Table 3).Discussion and Conclusion
ACL-MD is often misdiagnosed or missed, because of the lack of specificity of conventional MRI findings and clinical knowledge. Quantitative MRI can reflect the minute changes in the chemical composition of the tissue, and quantitative values can be obtained by measuring the value [5]. In this study, MRI was used to quantitatively analyze the changes in the relaxation time of ACL-MD and assess its diagnostic efficacy, so as to improve the clinical understanding of ACL-MD. The results demonstrated objective, quantifiable difference in T1,T2 and T2* values between normal group and ACL-MD group . The mean values of T1, T2 and T2* in ACL- MD group were all higher than those in the normal group, which we suspected might be related to the disordered arrangement of the collagen fibers and increased water content of MD-ACL compared with the normal ACL. More studies about ACL-MD and Quantitative MRI have also generated promising results that explain and substantiate our results. Hasegawa et al [4] suggest that the histological evolution of ACL-MD is the result of degradation of collagen fibers and deposition of new glycosaminoglycans. T1 value is sensitive to the change of proteoglycan content in tissues and affected by collagen content, T2 value is mainly positively correlated with the anisotropy and water content of collagen fibers [6-7]. The T2* value is similar in principle to the T2 value but more sensitive than the T2 value[8]. All in all, this study indicated MRI Values of T1, T2 and T2*(relaxation time) show potential for diagnosis of ACL-MD and T2* may deliberately has the highest diagnostic efficacy. This study is based on the normal ACL and MD-ACL, perhaps in future, quantitative MRI can be used to identify ACL diseases with similar appearances on ordinary MRI.Acknowledgements
No acknowledgements found.References
[1] Saad A, Waldron D, Iqbal A, et al. Anterior translation of the tibia in relation to femur in mucoid degeneration of ACL - An observational study[J]. Journal of Orthopaedics, 2020, 18:240-243.[2] Hotchen AJ, Demetriou C, Edwards D, et al. Mucoid Degeneration of the Anterior CruciateLigament: Characterization of Natural History, Femoral Notch Width Index, and Patient Reported Outcome Measures[J]. J Knee Surg, 2019,32(6):577-583.[3] Celikyay F, Yuksekkaya R, Bilgic E. A Retrospective Comparison of ACL Tear and Mucoid Degeneration MRI Findings and an Emphasis on Evaluating of ACL, Blumensaat, and PCL Angles[J]. J Belg Soc Radiol. 2020, 104(1):36.[4] HasegawaA, OtsukiS, PauliC, et al. Anterior cruciate ligament changes in human joint in agingand osteoarthritis[J]. Arthritis Rheum, 2012, 64(3): 696–704.[5] Huang SY, Li XH, Huang L, et al. T2* Mapping to characterize intestinal fibrosis in crohn's disease [J]. J Magn Reson Imaging. 2018;10.1002/jmri.26022. [6]Fei Wang, Si Shen, Quan Zhou,et al. A Preliminary Study of the Clinical Applicability of Quantitative T1 and T2 Mapping of the Knee Cartilage: An Experimental Approach[J]. Iranian Journal of Radiology, 2018, In Press(In Press).[7]Subburaj K, Kumar D, Souza RB, et al. The acute effect of running on knee articular cartilage and meniscus magnetic resonance relaxation times in young healthy adults[J]. Am J Sports Med, 2012, 40(9): 2134‐2141.[8]Krepkin K , Bruno M , Raya, José G, et al. Quantitative assessment of the supraspinatus tendon on MRI using T2/T2* mapping and shear-wave ultrasound elastography: a pilot study[J]. Skeletal Radiology, 2017, 46(2):191-199.Figures
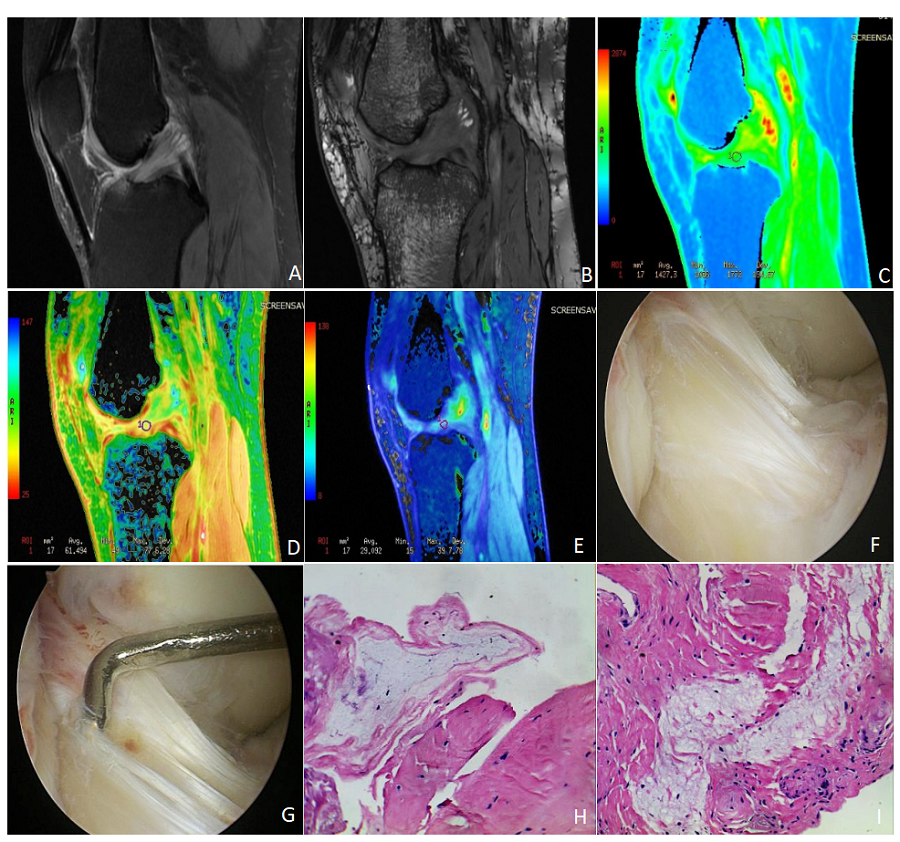
Figure 1: Images of an ACL-MD patient who is a 61-year-old female with the OSag fs (Oblique Sagittal fat suppression Proton Density weighted image), sagittal 3D-FIESTA, T1mapping, T2mapping, T2*mapping, arthroscopy and pathology.
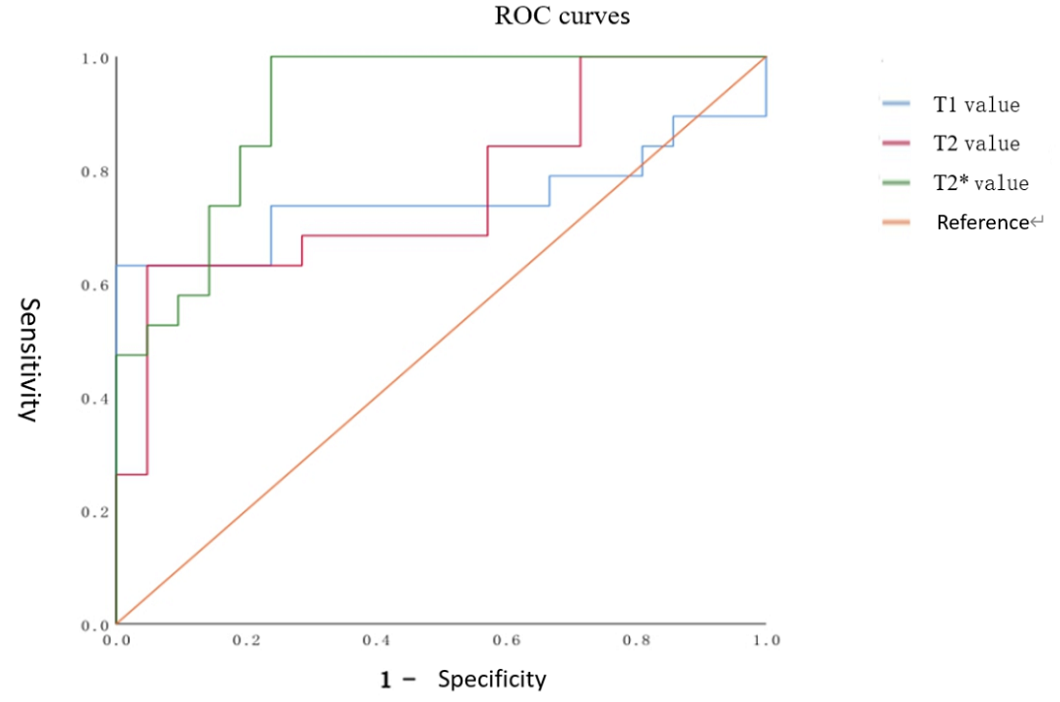
Figure 2: The curves of T1, T2, and T2* values in the ACL-MD group.
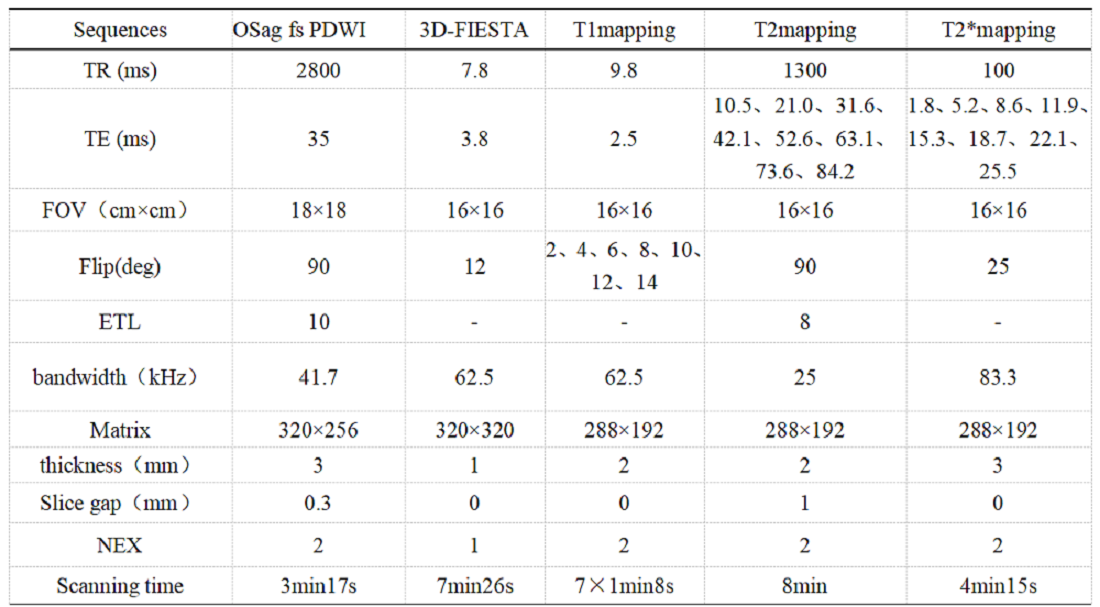
Table 1: Parameters of MRI sequences in this study.
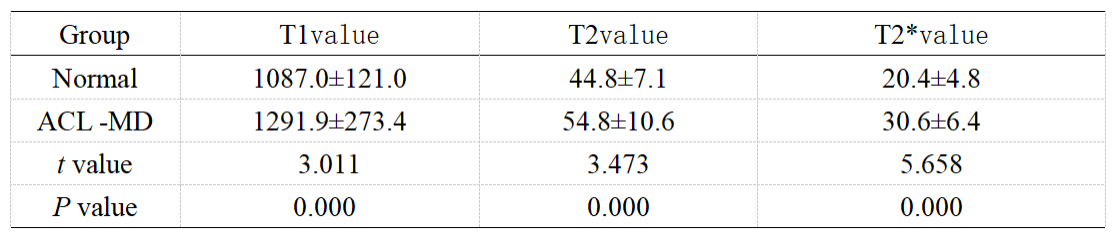
Table 2: T-test of the T1, T2, and T2* values in normal and ACL-MD groups.
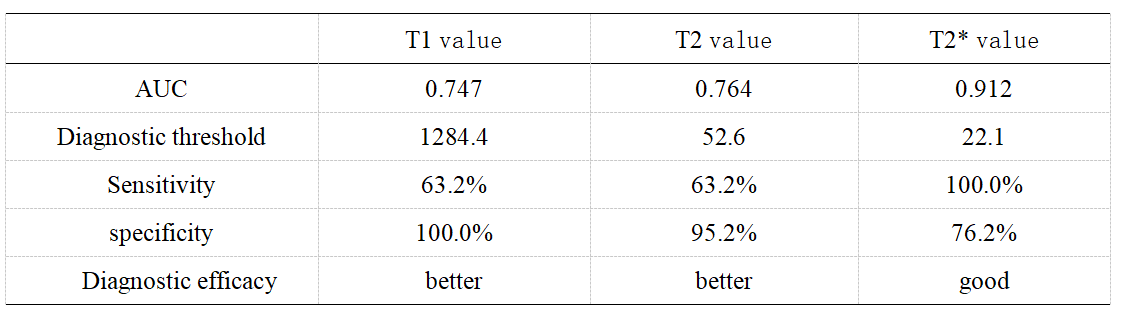
Table 3: The diagnostic efficacy of MRI quantitative parameters T1, T2, and T2* values in diagnosing ACL-MD.