0848
Tumor T1 for early chemotherapeutic response evaluation in patients with osteosarcoma with correlation to histological necrosis1Centre for Biomedical Engineering, Indian Institute of Technology Delhi, New Delhi, India, 2Radio diagnosis, All India Institute of Medical Sciences Delhi, New Delhi, India, 3Department of Medical Oncology, Dr. B.R. Ambedkar Institute-Rotary Cancer Hospital (IRCH), All India Institute of Medical Sciences Delhi, New Delhi, India, 4Department of Biomedical Engineering, All India Institute of Medical Sciences Delhi, New Delhi, India
Synopsis
The spin relaxation time (T1) of the water protons, an intrinsic property of tissue, can be a useful marker of therapeutic response in osteosarcoma. T1 values were estimated in whole tumor volume before and after completion of chemotherapy and histogram analysis was performed to characterize tumor T1 and its changes in the course of chemotherapy. Results showed mean and skewness of T1 relaxation time in tumor may be useful as non-invasive imaging markers of chemotherapeutic response in osteosarcoma.
Introduction
Anticancer treatment response is a vital prognostic factor. To evaluate therapeutic response histopathological examination is the current gold standard, but possible only after surgery. Hence, early non-invasive biomarkers are often important to explore the early treatment effects and to optimize the overall treatment. Spin-lattice relaxation time of water protons (T1) is an intrinsic tissue property1. Tumor hypocellularity after treatment often associated with decrease in T1 values; hence may characterize therapeutic changes in tumor2,3. Aim of this study was to characterize tumor T1 and its changes in the course of chemotherapy and evaluates its potential as marker of chemotherapy response in patients with osteosarcoma.Methods
Dataset: Total twenty patients (N=20, Male:Female=14:6, Age=16.4±3.6 years; Metastatic:localized=7:13) with biopsy proven osteosarcoma were analysed retrospectively. MRI acquisitions were performed using a 1.5T Philips Achieva®MR scanner before neoadjuvant chemotherapy (NACT)(baseline) and after NACT completion(follow-up). Conventional T1W and , T2W images along with 3D spoiled gradient recalled echo (SPGR) images were acquired with varying flip angles at 500,100,200&300 with fixed TR=4.1msec and TE=1.9msec. All patient undergone surgery after completing NACT followed by histopathological examination. Histological necrosis <50% was considered as chemotherapy Non-response (NRes) and ≥50% necrosis was considered as Response (Res).Image Analysis: SPGR is one of the rapid MRI scanning pulse sequences and has been widely used in clinical diagnosis. SPGR intensity (SI) is a function of the longitudinal relaxation time T1 and the scanning parameters, repetition time(TR), echo time(TE), and flip angle(FA) and can be described as1,2:
$$SI= M(1-K)Sinα/(1-KCosα), where K= exp(–TR/T1) [1]$$
T1 values were estimated by least-square fitting of the above equation for increasing α angles along with constant TR. Figure1.a-d shows the SPGR images of T1-weighted images with variable flip angle along with the evaluated T1 map in Figure1.e for a representative patient. Region of interest(ROI) for tumor and heathy tissue volume was demarcated at baseline and follow-up covering whole tumor. Figure1.f,g show the distribution of T1 values within the tumor and healthy tissue volume respectively. Histogram parameters - mean, standard-deviation(SD), skewness, kurtosis and entropy were evaluated on T1 values in tumor and healthy tissue at both baseline and follow-up for each patient. For all parameters relative percentage changes from baseline to follow-up (Δ) in tumor were evaluated for each patient.
Statistical Analysis: Inter-group comparison of all histogram parameters was performed using Mann-Whitney-U(MWU) test for tumor versus healthy tissue or Response versus Non-response groups. Intra-group variations of parameters from baseline to follow-up was tested using Mann-Whitney-Wilcoxon(MWW) test. A p-value<0.05 was considered for statistical significance. Receiver operating characteristics (ROC) curve analysis was used to assess the performance of significant parameters for identifying Response group. Image analysis and statistical calculations were performed using an in-house built toolbox in MATLAB® (MathWorksInc.,v2017,Philedelphia,USA) and SPSS software v16 (IBM SPSS statistics).
Results
For the current study Response:Non-response ratio was 9:11. Histogram analysis of T1 values in tumor and healthy tissues and its statistical significance is presented in Table1. At baseline, a comparatively higher (p=0.07) mean T1 values (880.49±193.32msec versus 737.88±226.64msec) was observed in tumor than healthy tissue. Entropy of T1 in tumor was significantly higher (p<0.001) than healthy tissue at both baseline and follow-up. A significant reduction in mean (p<0.001) and SD (p=0.008) and increase in skewness (p=0.005) of T1 values in tumor were observed after chemotherapy. No significant (p>0.05) difference in T1 values was observed between baseline and follow-up in healthy tissue.Histogram analysis of T1 values in tumor in response and Non-response group is presented in Table2. At baseline, a significantly higher T1-mean (p=0.007) and lower T1-skewness (p=0.04) were observed in tumor among Response group than the Non-response group. After NACT, a significant reduction in T1-mean (p=0.008) and increase in T1-skewness (p=0.008) were observed among Response group showing significantly higher average ΔT1-mean=-33±15% (p=0.01) and ΔT1-skewness=65±49% (p=0.01) than the Non-response group (ΔT1-mean=-13±16%; ΔT1-skewness=45±35%). Figure2 depicts the estimated T1 maps of a representative patient each from the two response groups at baseline and follow-up. A higher reduction of tumor T1 was observed after chemotherapy for responder (Figure2.A.a,c) than that of Non-response (Figure2.B.a,c). Histogram of tumor T1 for Responder was low picked at baseline and became more positively skewed after chemotherapy (Figure2.A.b,d); while for Non-responder it was high picked at baseline and became positively skewed after NACT (Figure2.B.b,d).
Using ROC curve analysis, T1-mean and T1-skewness at baseline individually produced Sn=88%,78%; Sp=72%,82% and AUC=0.86,0.77 at threshold of ≥885msec and ≤-0.12 respectively and jointly showed Sn=88%;Sp=72%;AUC=0.86 in identifying the Responders (Figure3.a). After NACT, ΔT1-mean and ΔT1-skewness individually produced Sn=78%,82%; Sp=78%,82% and AUC=0.84,0.84 at threshold of ≥-22.47% and ≥-45.25% respectively and jointly showed Sn=89%;Sp=92%;AUC=0.92 in identifying the Responders (Figure3.b).
Discussion
A comparatively higher T1 was observed in osteosarcoma than healthy tissue due to hyper-cellularity and lower intracellular water volume in tumor as reported earlier3,4. Significantly higher entropy of T1 in tumor indicated higher randomness in T1 value in tumor than the healthy tissue. After successful chemotherapy, due to cell death and increase in extracellular space, a higher reduction in tumor T1 were observed among Responders similar to the previous studies3,5,6.Conclusion
Tumor T1 values and its histogram analysis have potential to characterize the chemotherapeutic changes in osteosarcoma and may be useful as non-invasive imaging marker of chemotherapy response.Acknowledgements
Authors would like to acknowledge both the institutes - Indian Institute of Technology Delhi and All India Institute of Medical Sciences, New Delhi for providing the required support to conduct this study.References
1. Cheng HLM, Wright GA. Rapid high-rsolution T1 mapping by variable flip angles: Accurate and precise measurements in the presence of radiofrequency field inhomogeneity. Magn Reson Med. 2006;55(3):566-574. doi:10.1002/mrm.20791
2. Johnson GA. Rapid calculation of T1 using variable flip angle gradient refocused imaging. 1987;(February). doi:10.1016/0730-725X(87)90021-X
3. McSheehy PMJ, Weidensteiner C, Cannet C, et al. Quantified tumor T1 is a generic early-response imaging biomarker for chemotherapy reflecting cell viability. Clin Cancer Res. 2010;16(1):212-225. doi:10.1158/1078-0432.CCR-09-0686
4. Braunschweiger PG, Schiffer LM, Furmanski P. 1H-NMR relaxation times and water compartmentalization in experimental tumor models. Magn Reson Imaging. 1986;4(4):335-342. doi:10.1016/0730-725X(86)91043-X
5. Suh JS, Yun MJ, Jeong EK, Shin KH, Yang WI. Osteosarcoma: Correlation of T1 Map and Histology Map. J Korean Radiol Soc. 1999;41(3):577-583. doi:org/10.3348/jkrs.1999.41.3.577
6. Rofstad EK, Steinsland E, Kaalhus O, Chang YB, Høvik B, Lyng H. Magnetic resonance imaging of human melanoma xenografts in vivo: Proton spin-lattice and spin-spin relaxation times versus fractional tumour water content and fraction of necrotic tumour tissue. Int J Radiat Biol. 1994;65(3):387-401. doi:10.1080/09553009414550451
Figures
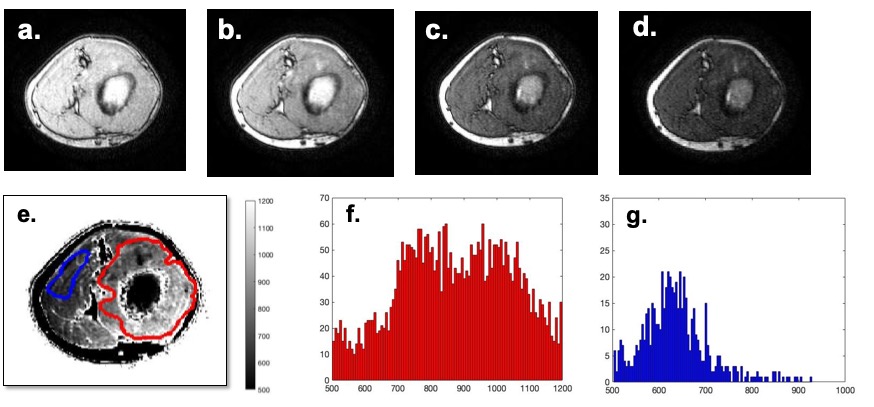
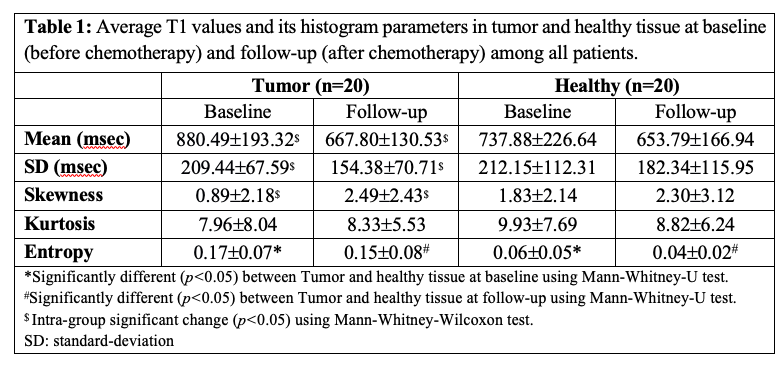
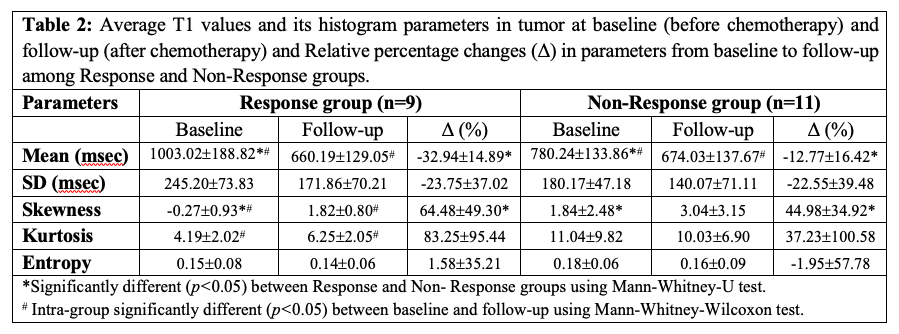
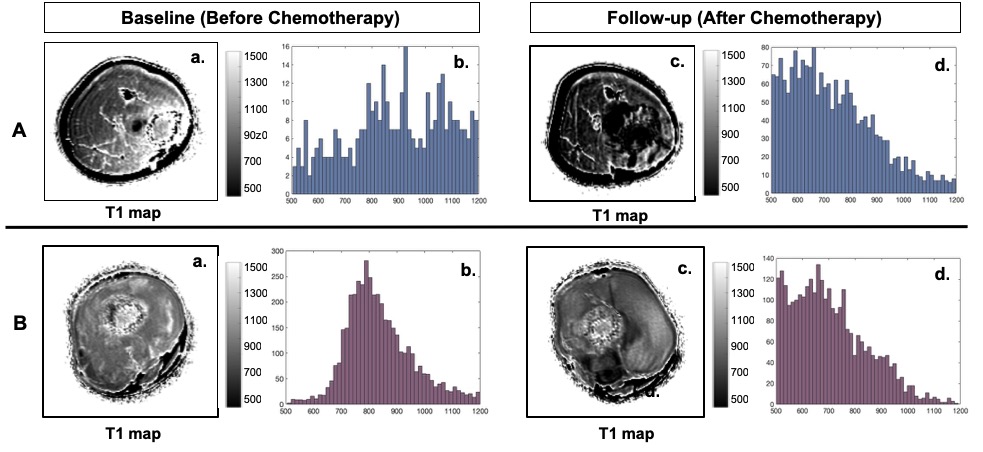
Figure 2: Images are from A. a representative patients (M, 15 years) from Response group with osteosarcoma in right Tibia. B. a representative patients (M, 14 years) from Non-Response group with osteosarcoma in right femur.
For A and B: a, c) Estimated T1 maps and b, d) Histogram of T1 values in tumor at baseline and follow-up respectively.
A comparatively higher reduction tumor T1 can be observed after chemotherapy for Responder than Non-responder. Histogram of tumor T1 for Responder was low picked at baseline and became more positively skewed after chemotherapy than Non-responder.
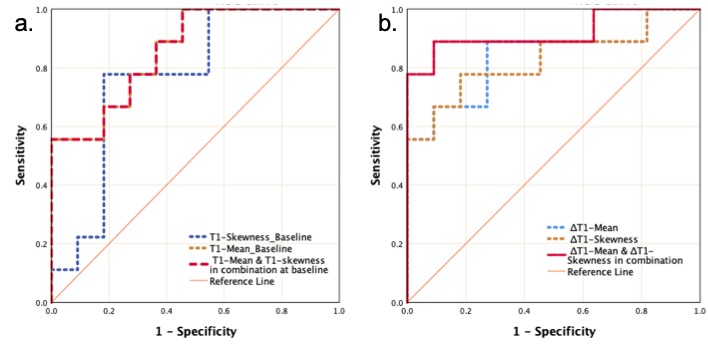
Figure 3: ROC curve analysis using statistically significant (p<0.5) histogram parameters of T1 value in tumor a) at baseline and b) its relative percentage changes (Δ) at follow-up.
a) At baseline T1-mean and T1-skewness in combination produced AUC=0.86, sensitivity=88%, specificity=72% in identifying chemotherapeutic response.
b) After chemotherapy, ΔT1-mean and ΔT1-skewness in combination produced AUC=0.92, sensitivity=89%, specificity=92% in identifying chemotherapeutic response.