0847
Differences in distribution of MRI-based fat fraction in lower limb skeletal muscles of six different neuromuscular disorders1NMR Laboratory, Neuromuscular Investigation Center, Institute of Myology, Paris, France, 2NMR Laboratory, CEA/DRF/IBFJ/MIRCen, Paris, France, 3CEA, DRF, Service Hospitalier Frédéric Joliot, Orsay, France
Synopsis
Quantitative MRI fat-water separation techniques such as Dixon are often used to evaluate disease progression in muscle of neuromuscular diseases. Although the mean fat fraction (FF) value per region of interest (ROI) is a valuable objective MRI biomarker, it does not reflect the variation of FF within this ROI. In this study we analyzed 6582 muscle ROIs in leg and thigh of 6 different neuromuscular diseases and analyzed, besides the mean FF, other statistical metrics such as median, standard deviation, kurtosis and skewness. The differences in FF distribution might reveal additional information about the individual patient’s disease evolution.
Introduction
Magnetic resonance imaging (MRI) is a powerful tool in the evaluation of the status and the progression of muscle destruction in neuromuscular diseases (NMDs). In the last five years, many studies in NMDs have implemented quantitative MRI-based fat-water separation techniques such as the Dixon method1. Following segmentation of the FF maps, a mean FF value per muscle, muscle group or global segment can then be reported2. Although the mean FF value per region of interest (ROI) is a valuable objective MRI biomarker, it does not reflect the variation of FF within this ROI. Indeed, with these quantitative methods, less focus is put on the actual images. Image texture analysis algorithms have been subject to research in the field of muscle imaging to elucidate whether there is additional information in the patterns that are less or not visible to the human eye3. The aim of this work was to look further than the mean FF value per ROI and to apply other simple statistical metrics, as a way to investigate the FF heterogeneity in different NMDs.Methods - Database
For this study, we investigated 216 leg and 210 thigh MRI data sets (left and right sides), obtained in 6 different NMDs (Duchenne muscular dystrophy/DMD: n=36 for legs; dysferlinopathy/DYS: n= 43 for legs and thighs; facioscapulohumeral dystrophy/FSHD: n=21 for thighs; inclusion body myositis/IBM: n=80 for legs and thighs; immune-mediated necrotizing myositis/IMNM: n=43 for legs and thighs; late-onset Pompe disease: n=14 for legs and thighs.Methods - Data acquisition
All data were obtained on a 3T clinical Trio/Prisma Siemens system. The quantitative MRI protocol included a 3D gradient echo sequence (Dixon) with TEs of 2.75, 3.95 and 5.15 ms, a TR of 10 ms, a flip angle of 3°, a spatial resolution of 1x1x5 mm3 and a 448x224x64 matrix size4.Methods - Data processing/analysis
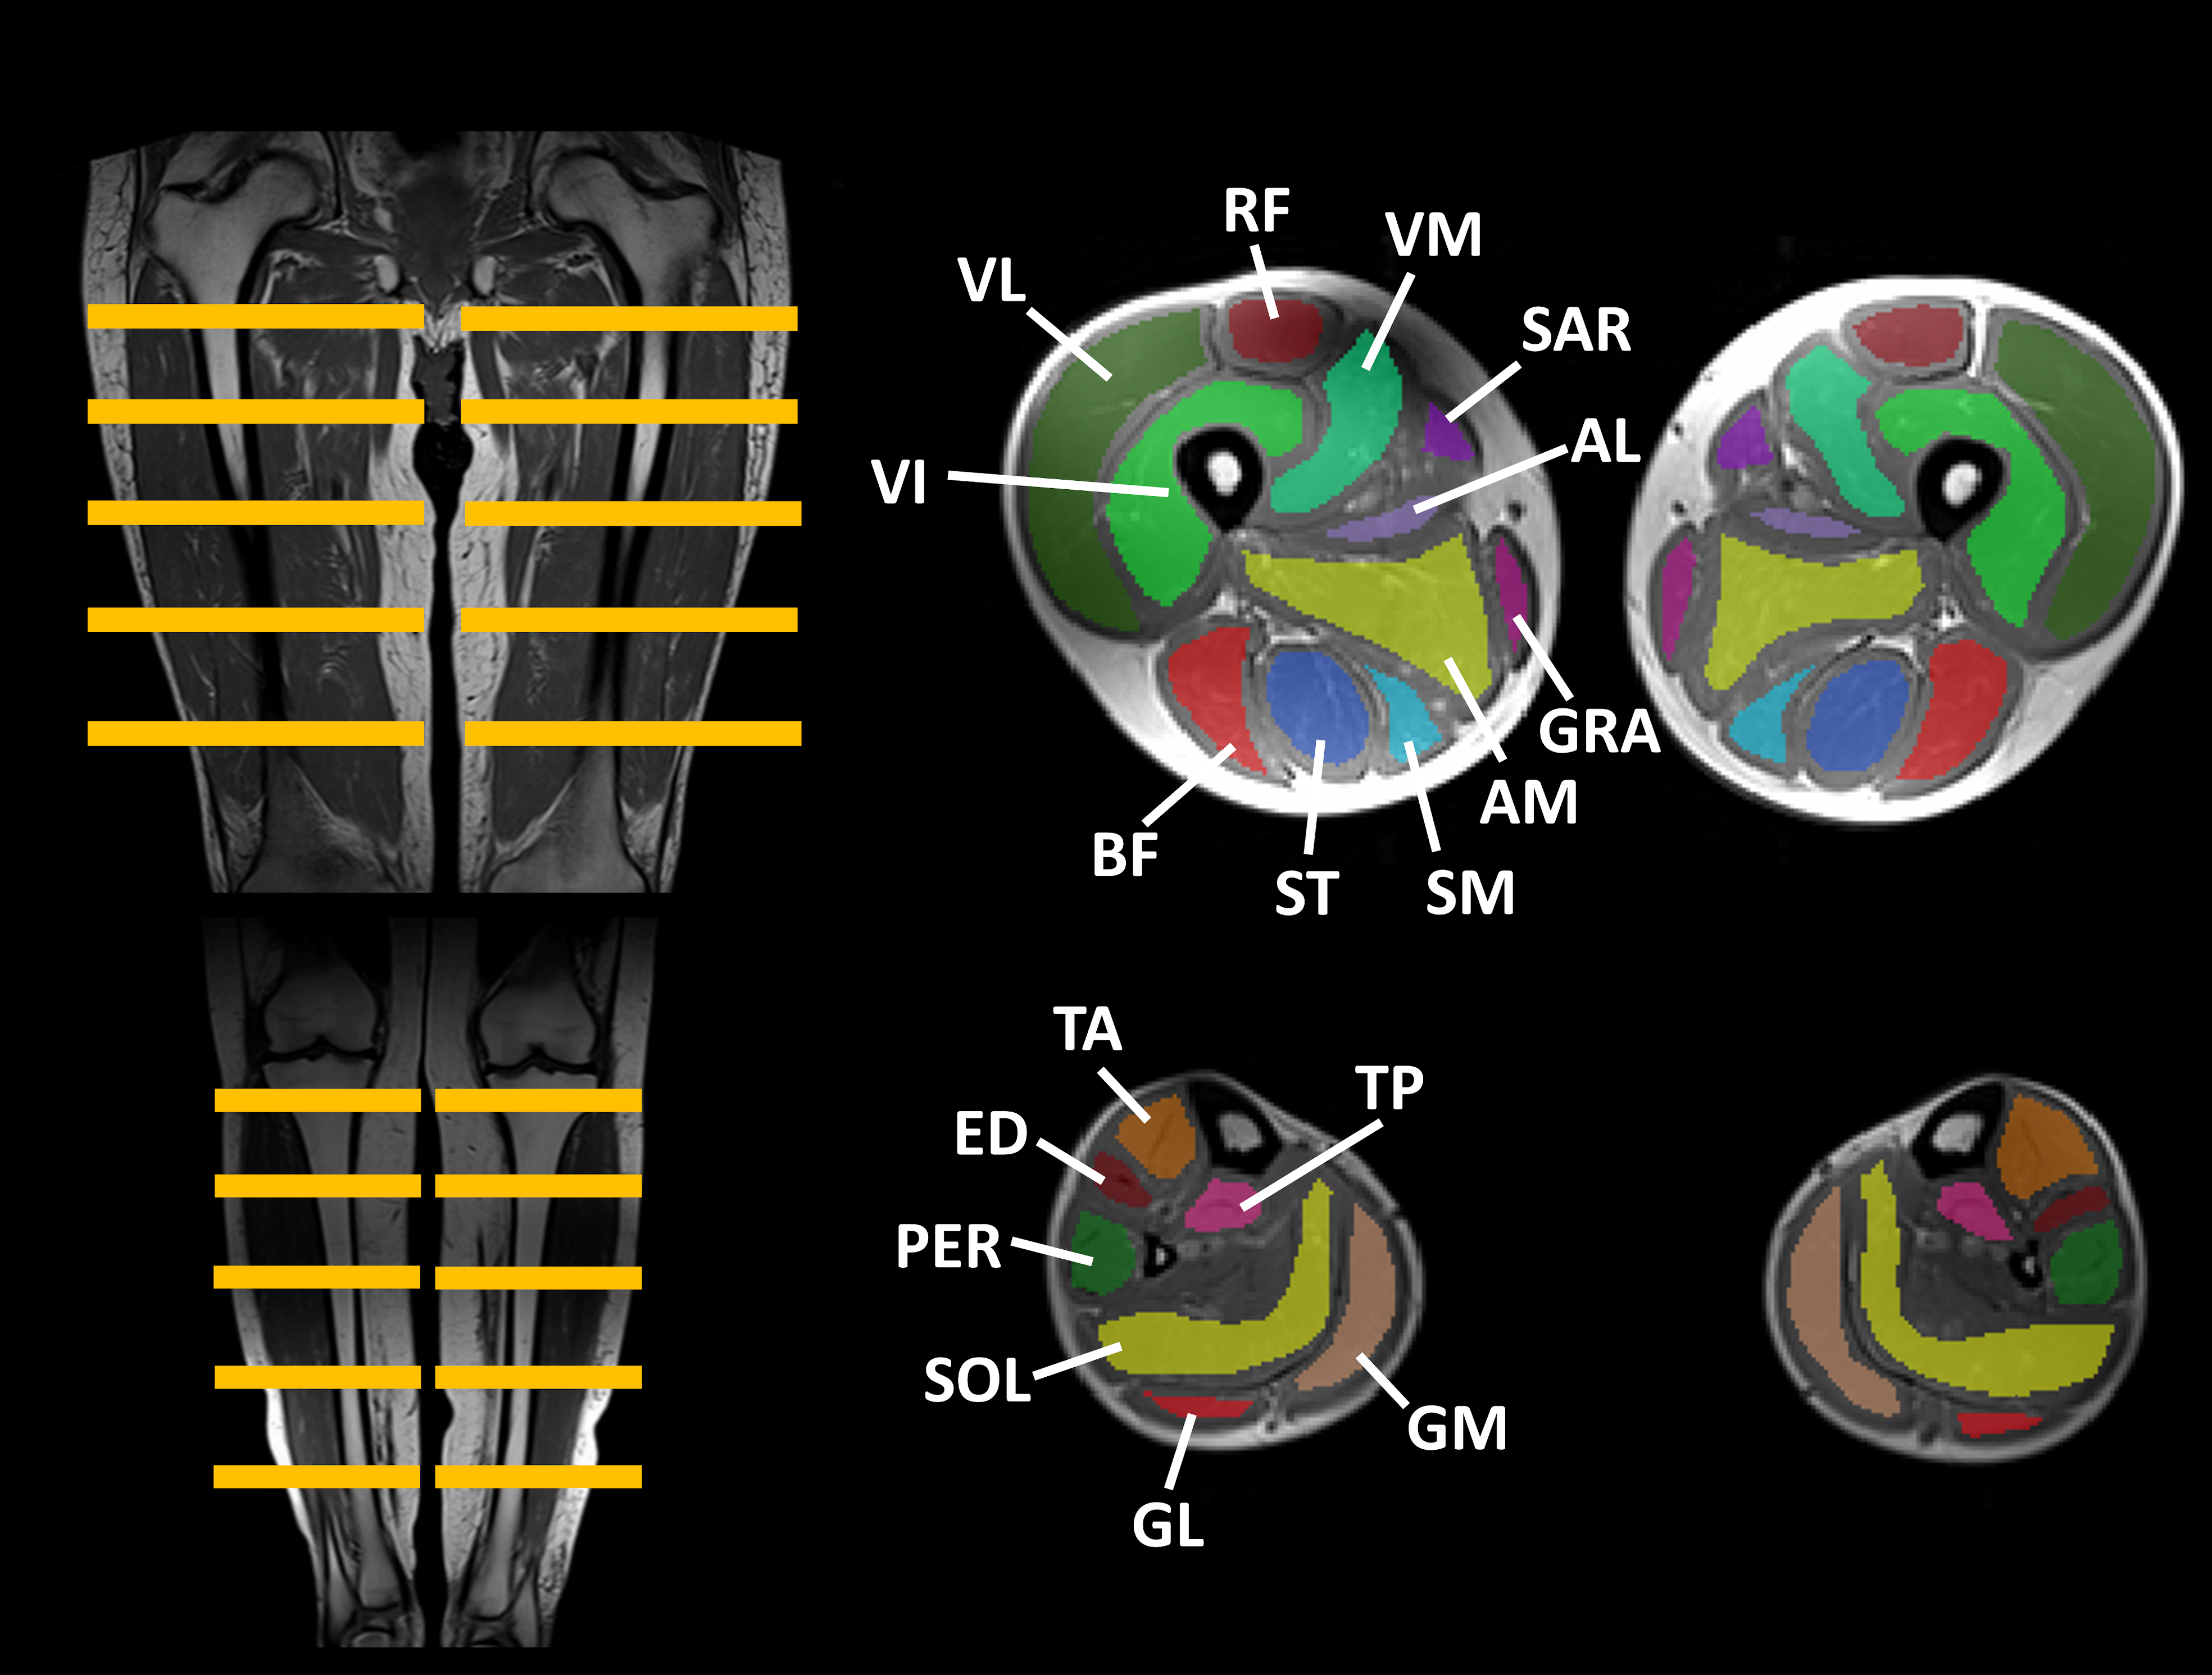
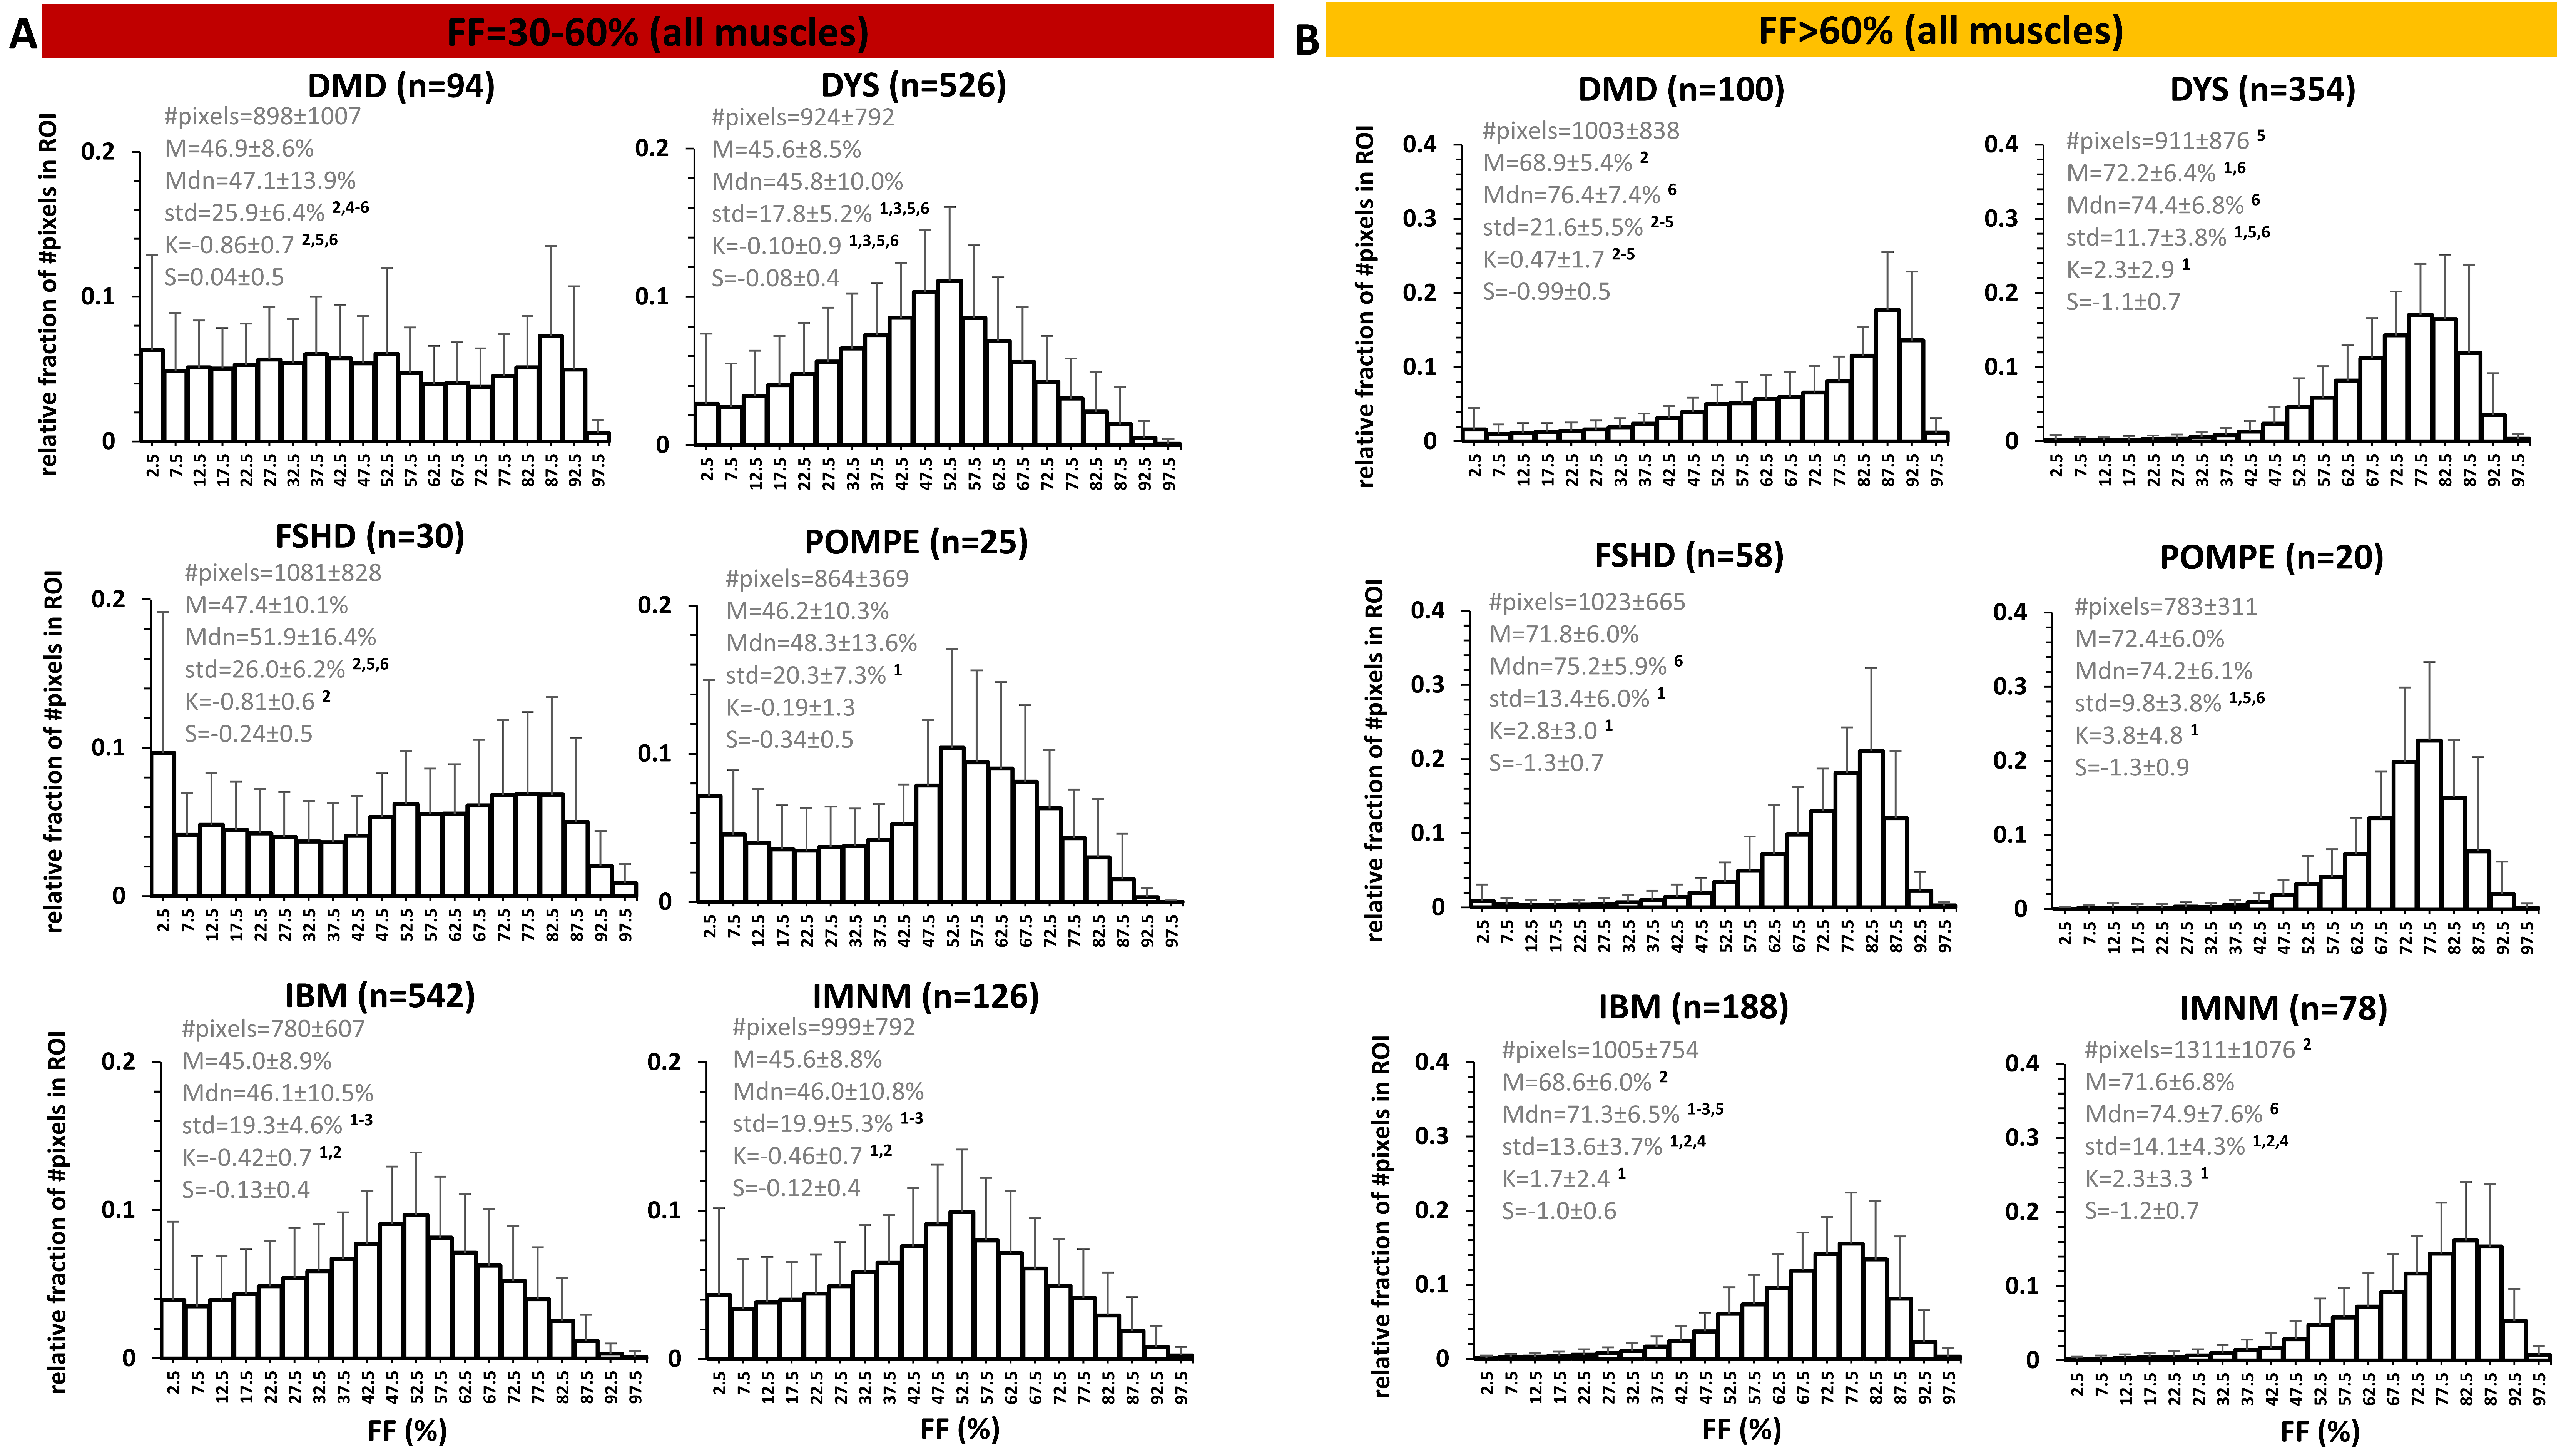
Manual segmentation was performed in 14 leg muscles and 22 thigh muscles (Fig. 1), on 5 slices, avoiding the muscle borders (fasciae, intermuscular and subcutaneous fat). The central slice was always positioned at the same anatomical level5. From the generated FF maps4, the analysis per ROI included the assessment of mean (M), median (Mdn), standard deviation (std), kurtosis (K=3=normal distribution; K<3: flatter than normal distribution; K>3: more peaked than normal distribution) and skewness (-0.5<S>0.5: normal distribution; S<-0.5: negative skew, M<Mdn; S>0.5: positive skew, M>Mdn) of the FF distribution. Histograms were generated for all ROIs. As a first analysis, we categorized ROIs into 4 FF categories: FF≤10%, 10%<FF≤30%, 30%<FF≤60% and FF>60%, which correspond to Lamminen-Mercuri (LM) scores 1, 2, 3 and 4, respectively6, which is a pseudo-quantitative scoring system based on a visual radiological assessment of T1-weighted MRI to roughly determine the degree of muscle fat replacement. Then, we also looked into smaller FF categories (e.g. 30-35%, 45-50%, 55-60%). Statistical analysis (Kruskal-Wallis) included the comparison of the FF distribution parameters between the different NMDs, per FF category (significance level: P<.005).Results
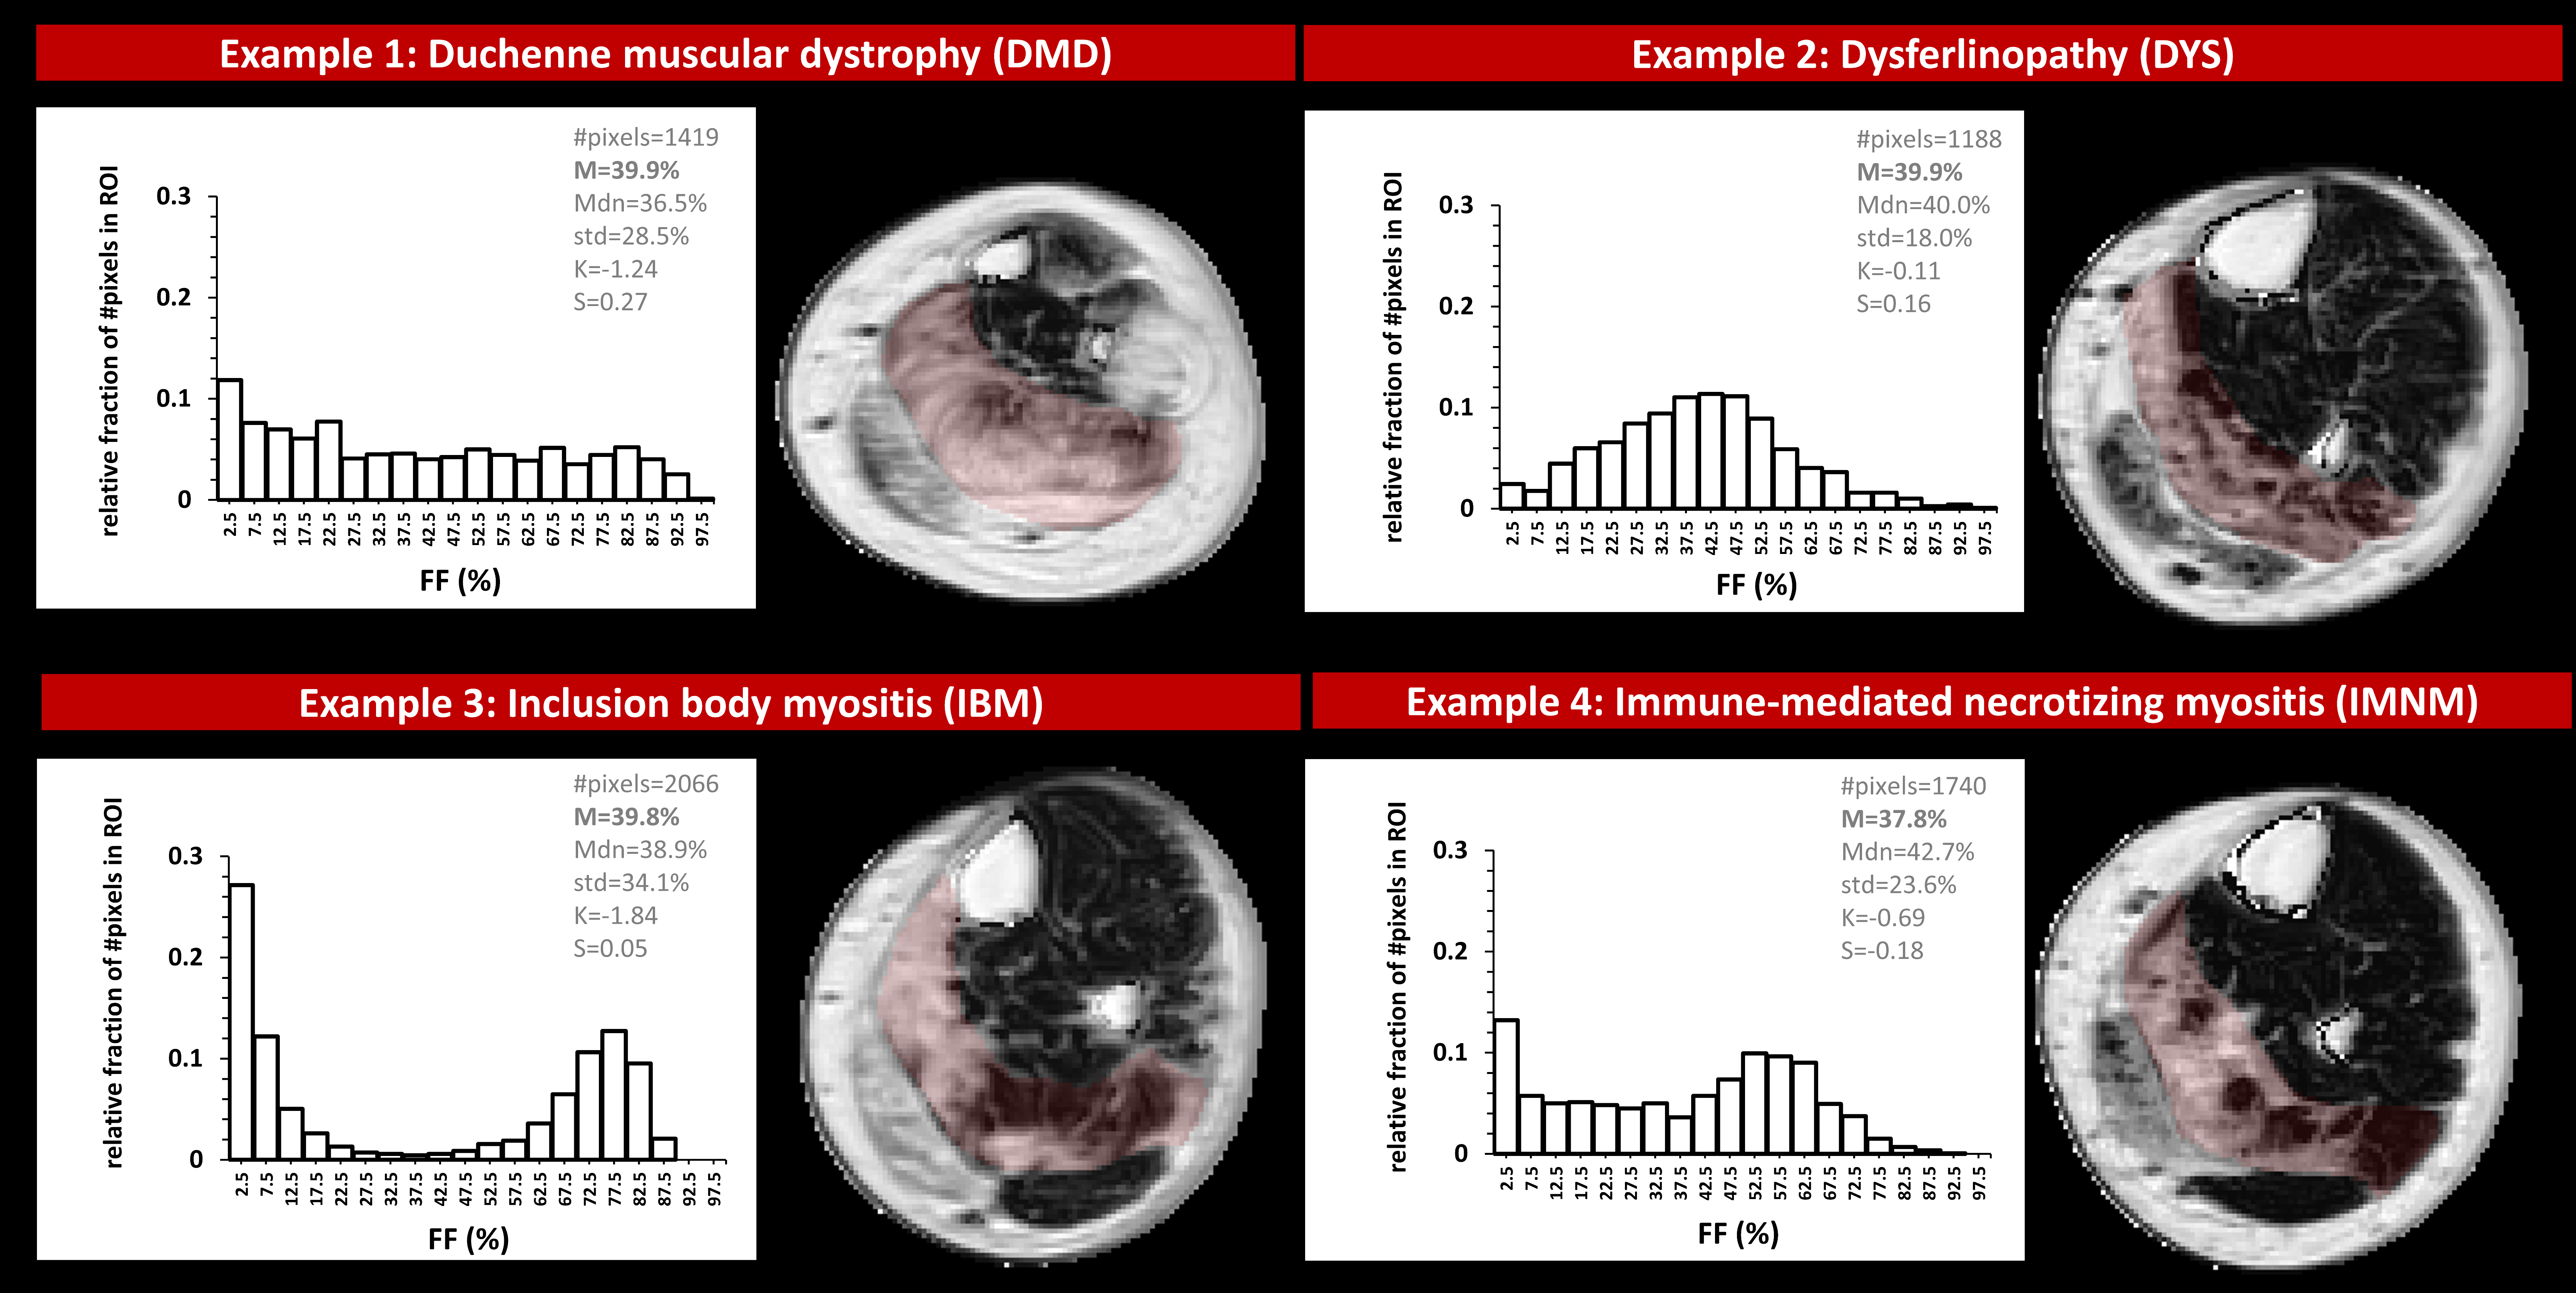
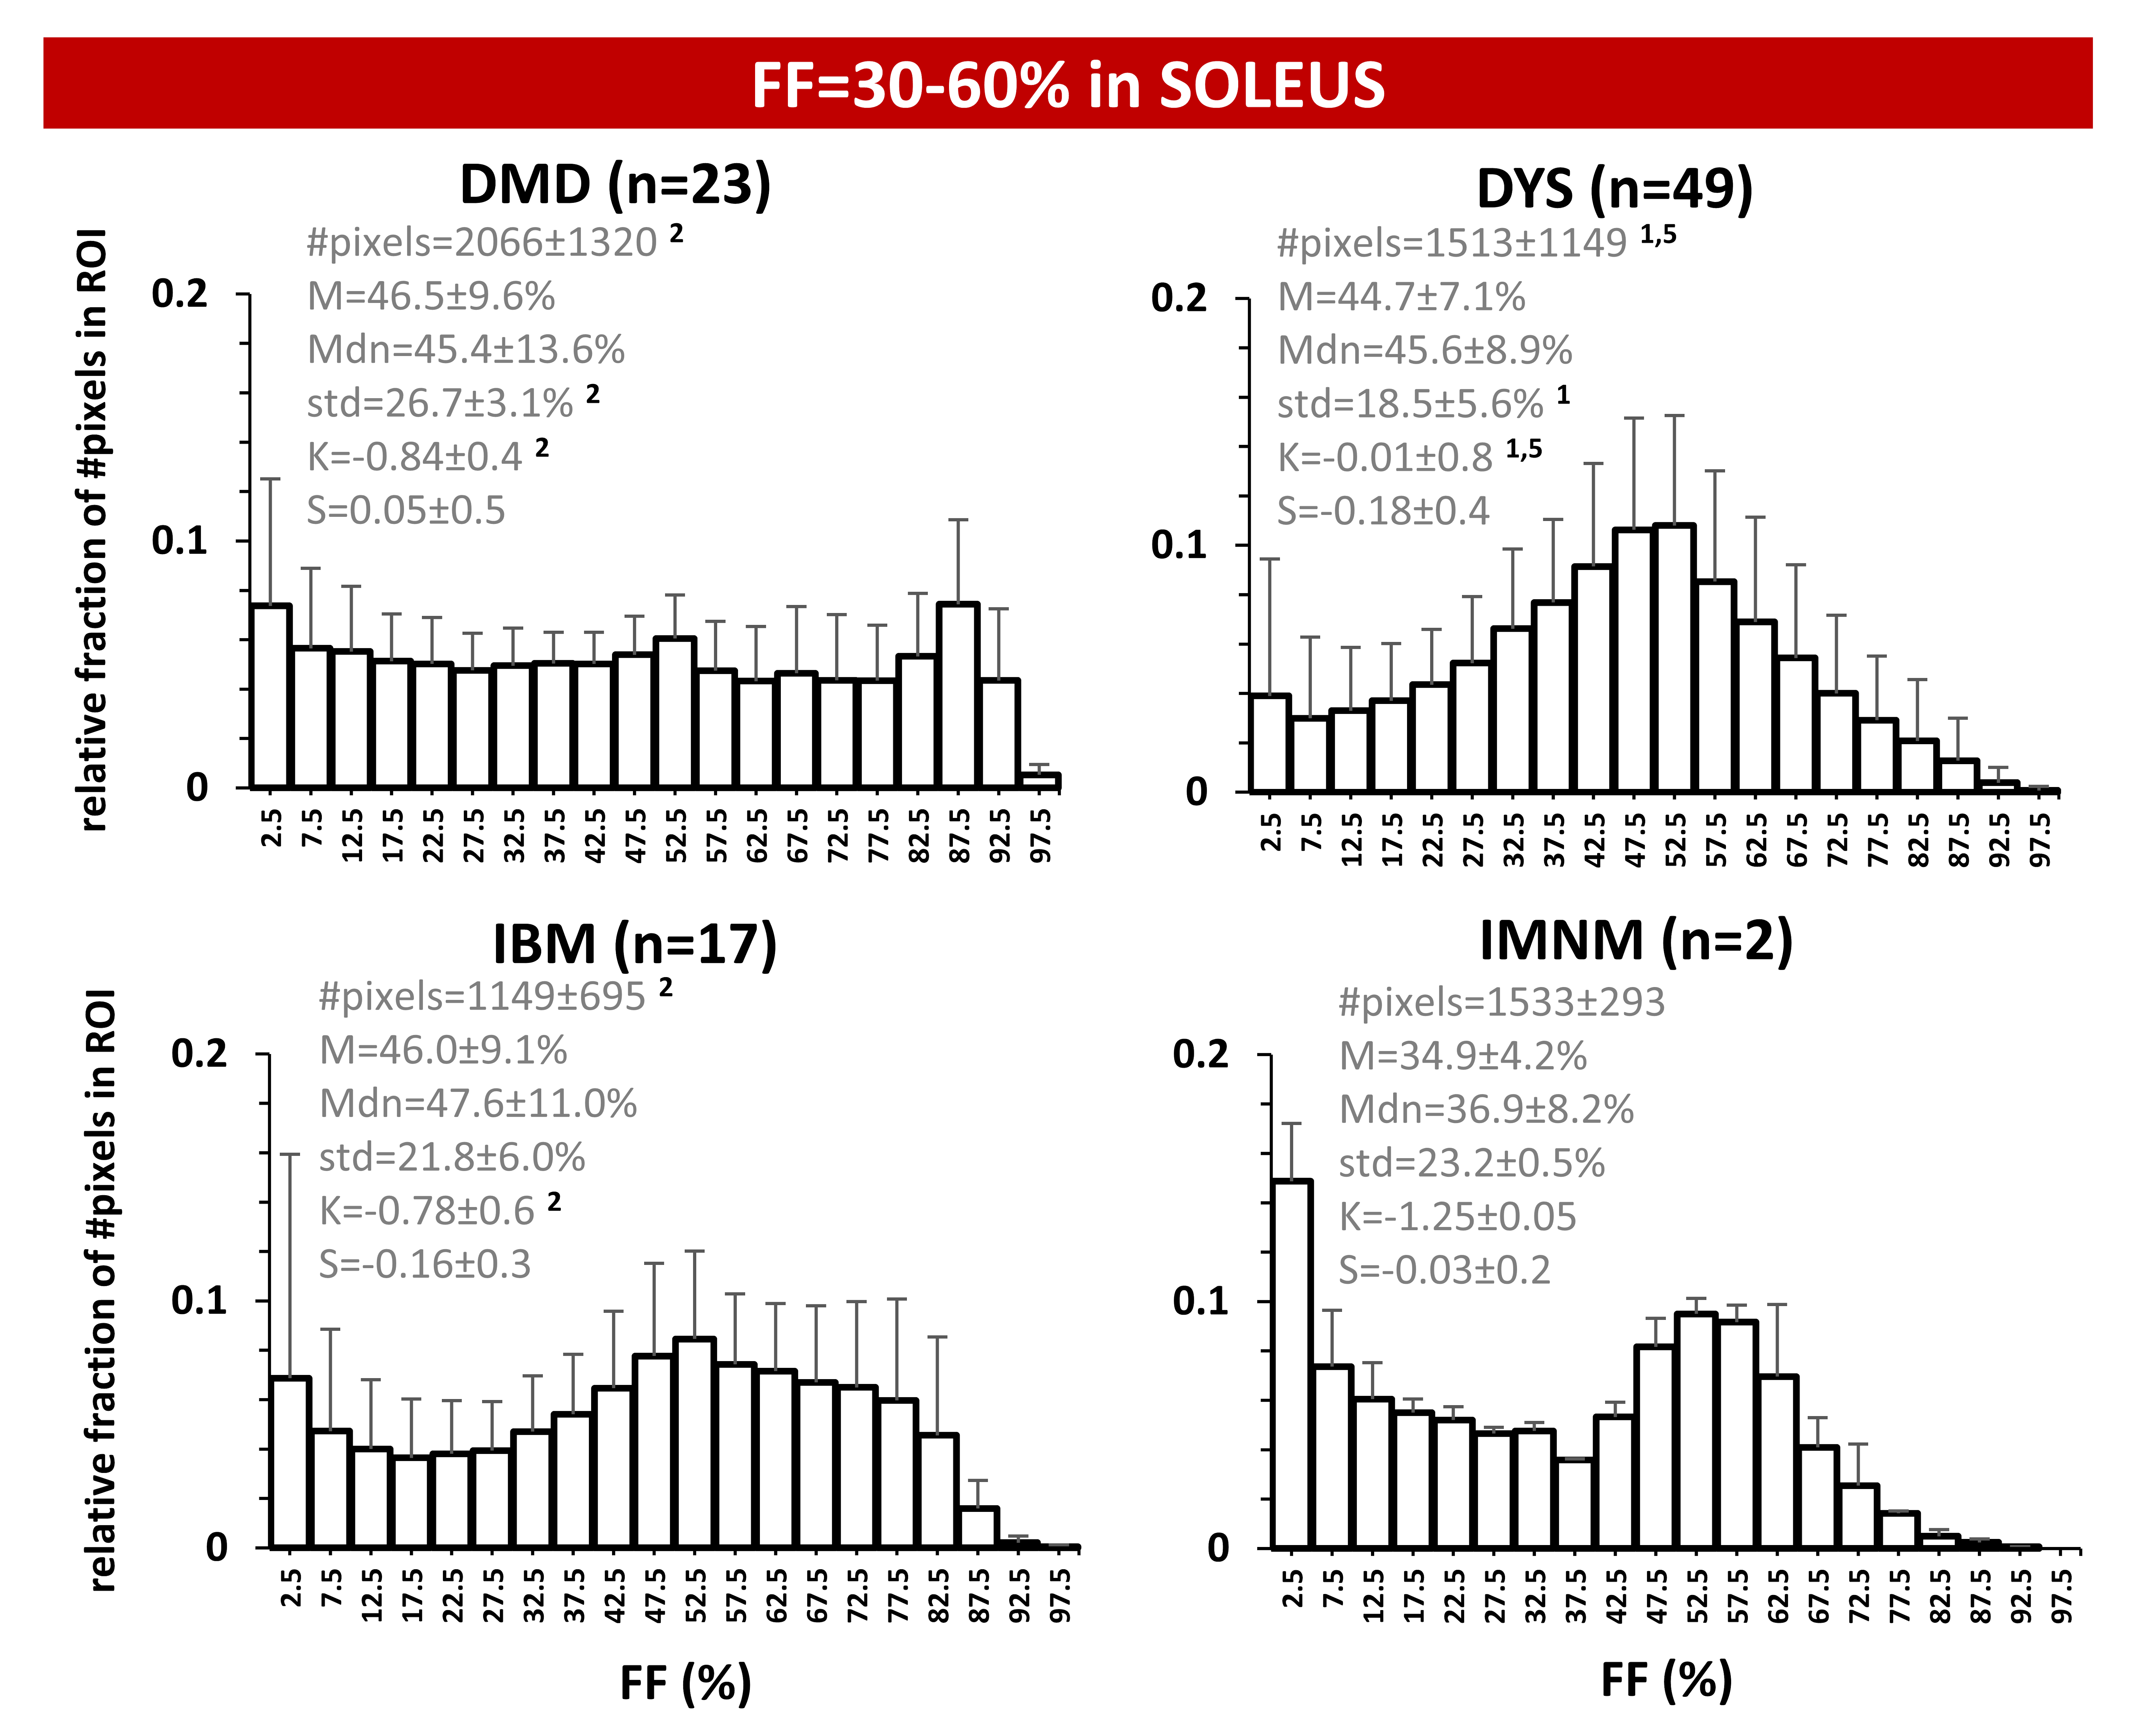
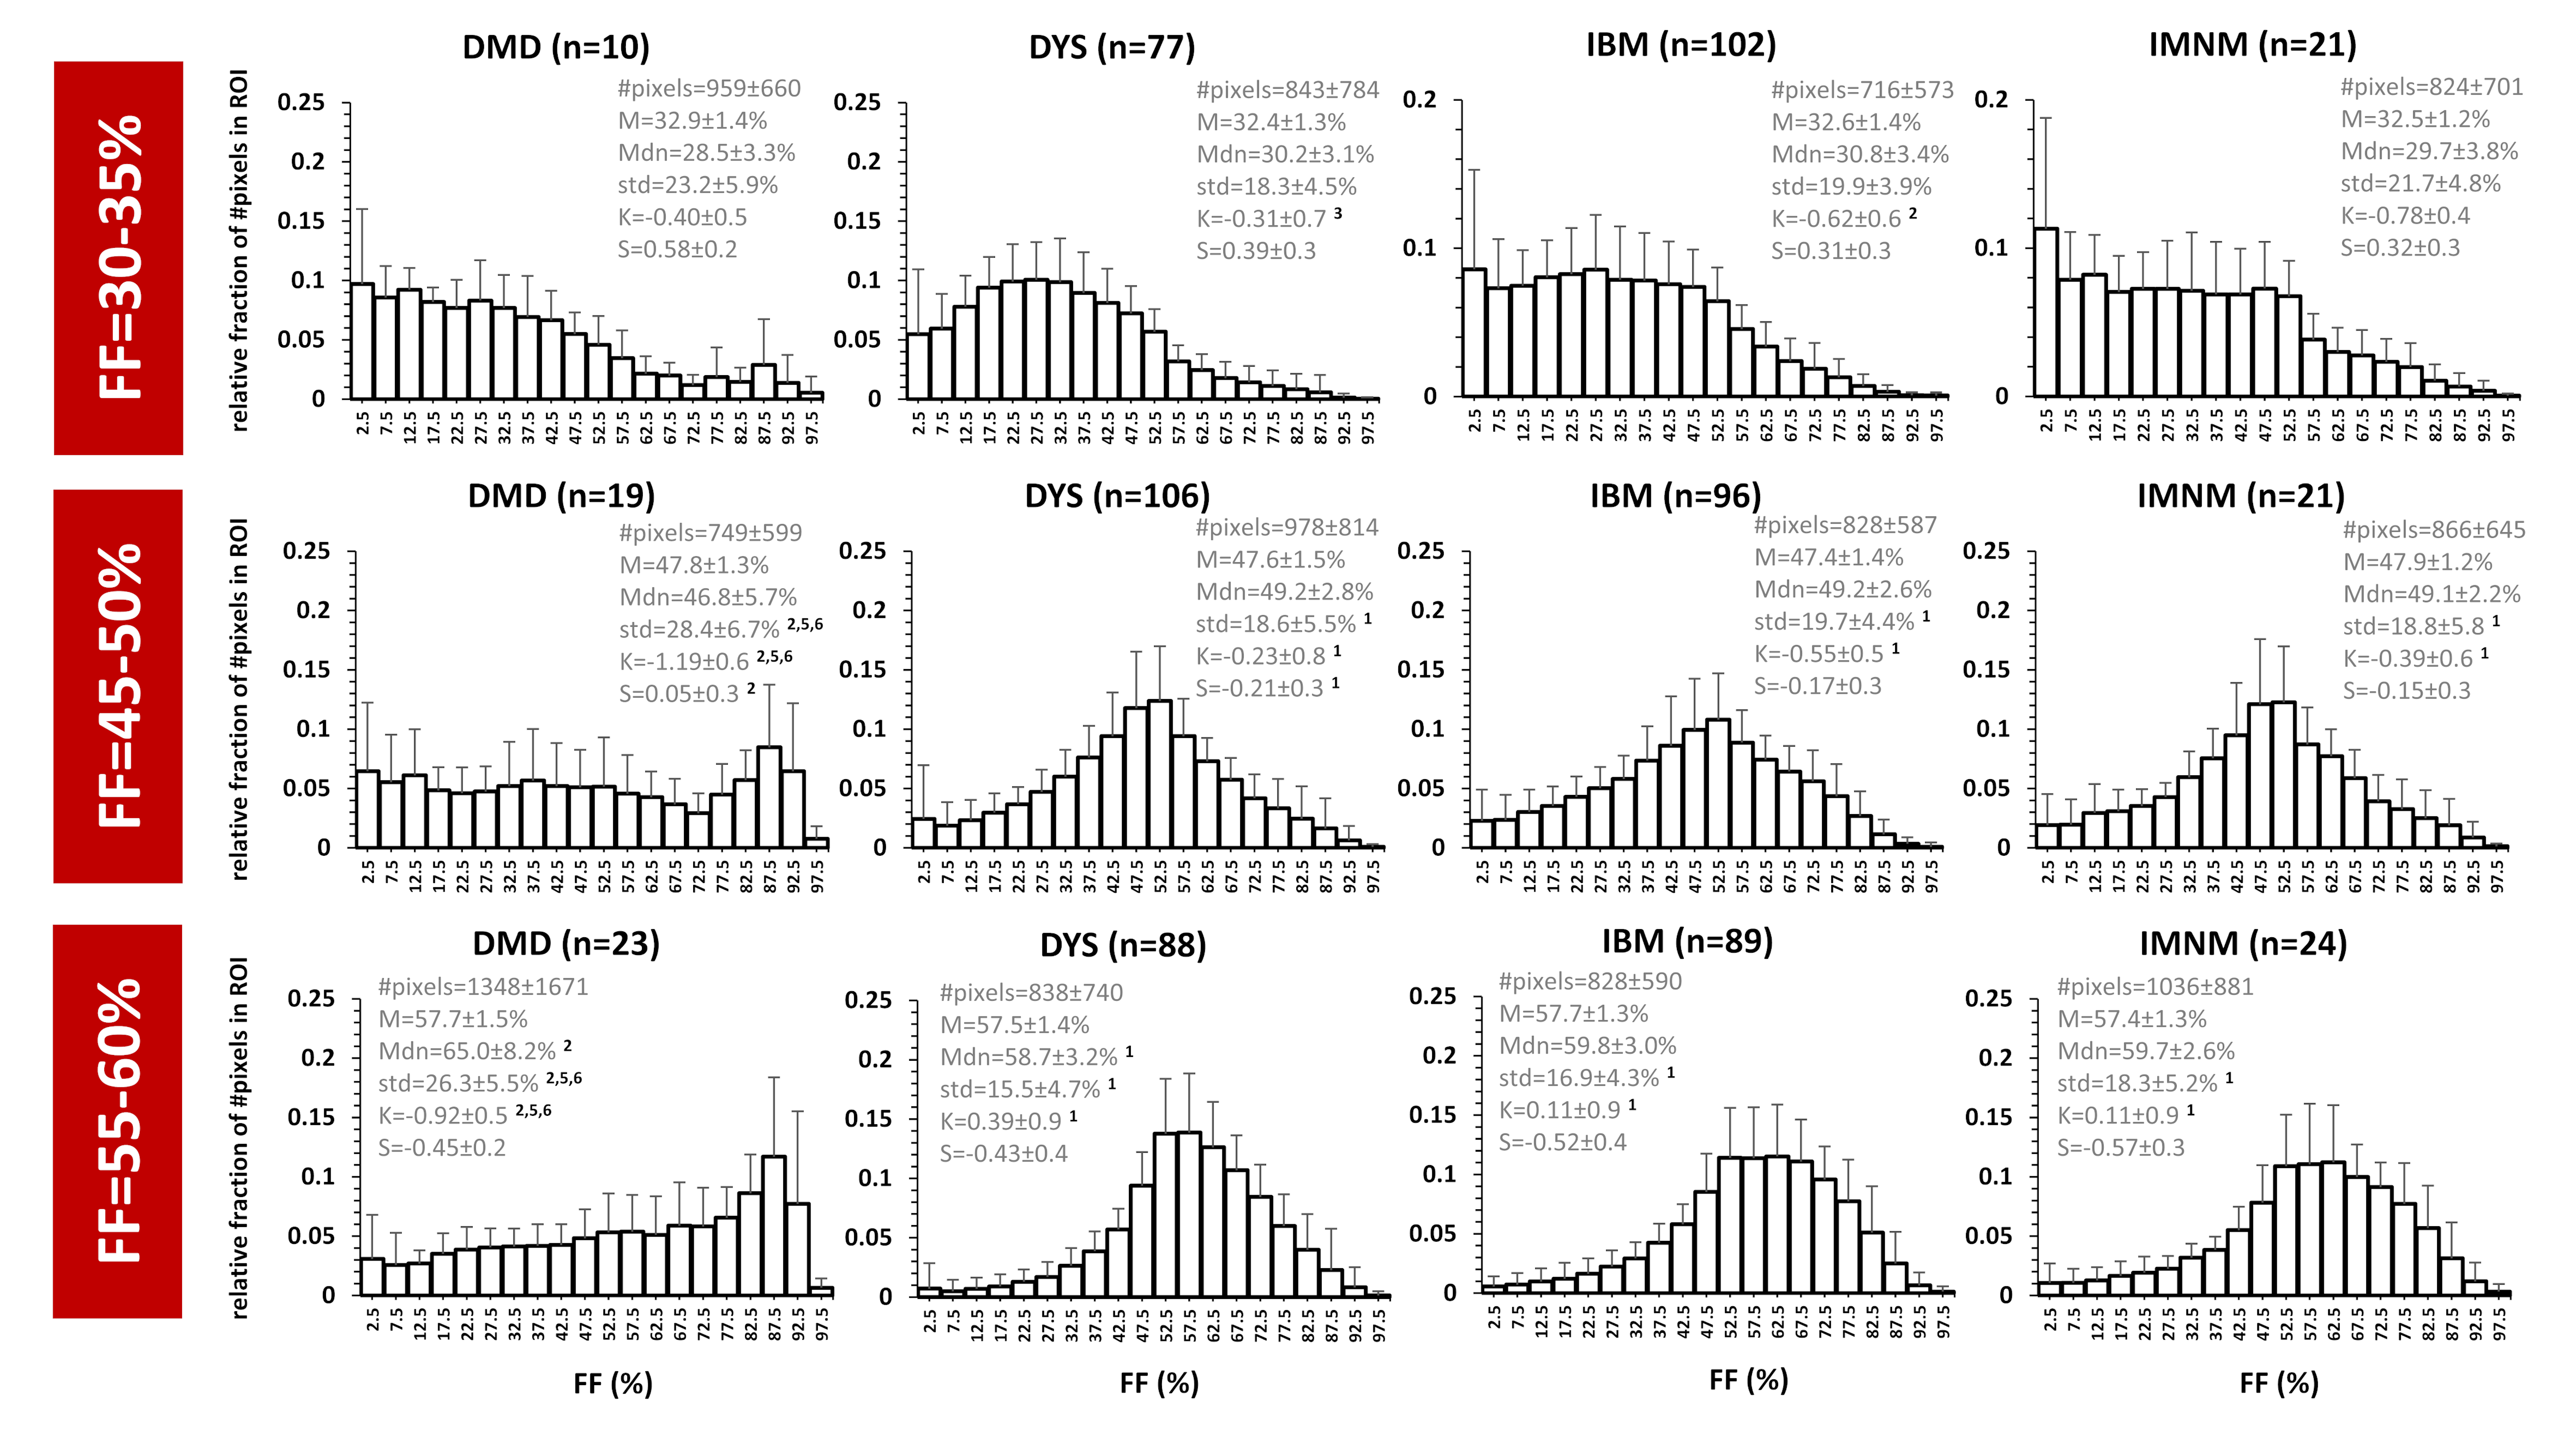
Overall, the FF metrics were evaluated in 6582 leg and thigh muscles. For ROIs with FF≤10%, FF histograms were, logically, highly positively skewed and showed very high K values (>>3) for all 6 NMDs. Highly significant differences were observed for all metrics between (almost) all NMDs. The ROIs with FF of 10-30% were also positively skewed and showed K-values between 1 and 2.5. Here, only significant differences were found for M, Mdn and S between DYS and other NMDs. The ROIs with FF of 30-60% showed no significant differences between any of the NMDs for M and Mdn values. The significant differences found in this FF category were found for std and K, especially between DMD or DYS and the other NMDs; and histograms were rather flat (K<3) but not skewed such as the other FF categories (Fig. 2A). The ROIs with FF>60% showed predominantly differences in std between NMDs, particularly between DMD or DYS and the other NMDs (Fig. 2B). When looking more closely to the interesting FF category of 30-60%, first, at the soleus of 4 selected patients a highly similar mean FF (Fig. 3), we observed that the FF histograms corresponded to the ones in the overall analysis (Fig. 2A), except for IBM which demonstrates a highly particular FF distribution in this particular example. The next step was then to look at the FF distribution (between 30-60% FF) in all soleus muscles for the different NMDs (Fig. 4). Again we observed that the same pattern was seen for DMD and DYS, and somewhat less for IBM, as compared to the overall analysis (Fig. 2A). We see that the differences between DMD and the other NMDs are also evident when we zoom into smaller FF categories (Fig. 5).Discussion
We observed that the muscles that are moderately affected (FF=30-60%) showed mean FF values that were the same between the investigated NMDs and that the differences in FF between these diseases could be attributed to other parameters such as std and K. Overall, the analysis of FF distribution and the heterogeneity of muscle fat replacement might reveal additional information about the individual patient’s disease evolution (i.e. natural history) and the effects of treatment7.Acknowledgements
No acknowledgement found.References
1Carlier PG, Marty B, Scheidegger O, et al. Skeletal muscle quantitative nuclear magnetic resonance imaging and spectroscopy as an outcome measure for clinical trials. J Neuromuscul Dis. 2016;3(1):1-28.
2Reyngoudt H, Marty B, Boisserie JM, et al. Global versus individual muscle segmentation to assess quantitative MRI-based fat fraction changes in neuromuscular diseases. Eur Radiol. 2020; doi: 10.1007/s00330-020-07487-0.
3De Certaines JD, Larcher T, Duda D, et al. Application of texture analysis to muscle MRI: 1-What kind of information should be expected from texture analysis? EPJ Nonlinear Biomed Phys. 2015;1-3:1-14.
4Azzabou N, Loureiro de Sousa P, Caldas E, Carlier PG. Validation of a generic approach to muscle water T2 determination at 3T in fat-infiltrated skeletal muscle. J Magn Reson Imaging. 2015;41(3):645-653.
5Gidaro T, Reyngoudt H, Le Louër J, et al. Quantitative nuclear magnetic resonance imaging detects subclinical changes over 1 year in skeletal muscle of GNE myopathy. J Neurol. 2020;267(1):228-238.
6Baudin PY, Marty B, Robert B, et al. Qualitative and quantitative evaluation of skeletal muscle fatty degenerative changes using whole-body Dixon nuclear magnetic resonance imaging for an important reduction of the acquisition time. Neuromuscul Disord. 2015;25(10):758-763.
7Chen G, Jiang J, Wang X, et al. Evaluation of hepatic steatosis before liver transplantation in ex vivo by volumetric quantitative PDFF-MRI. Magn Reson Med. 2020; doi: 10.1002/mrm.28592.
Figures