0846
Association Between UTE-MRI T2* Relaxation Times and Symptoms During Exercise Therapy for Patellar Tendinopathy1Radiology & Nuclear Medicine, Erasmus University Medical Center, Rotterdam, Netherlands, 2Orthopaedics, Erasmus Univerity Medical Center, Rotterdam, Netherlands
Synopsis
Patellar tendinopathy (PT) is an overuse injury of the patellar tendon in athletes involving typical degenerative changes to the patellar tendon. The association of MRI-assessed structural changes with symptoms is largely unknown. UTE-MRI was implemented to study longitudinal changes in T2* within the patellar tendon in athletes performing exercise therapy for PT. We found that T2* relaxation times in the degenerative tissue of the patellar tendon were associated with symptom severity and that decreased T2* was associated with clinical improvement.
INTRODUCTION
Patellar tendinopathy is a painful activity-related injury of the patellar tendon, frequently occurring in jumping athletes, such as basketball and volleyball players.1 Exercise therapy is considered as the preferential treatment for patellar tendinopathy (PT). However, there is conflicting evidence for structural patellar tendon adaptation in response to exercise therapy on conventional imaging methods and its association with symptoms is weak. Imaging of tendons using MRI with conventional pulse sequences is typically limited by the fast free induction decay of collagen.2 Ultrashort echo time (UTE) MRI enables the detection of signal from short T2* tissues such as tendon, which can be used for voxel-wise T2* quantification.3 Patellar tendinopathy involves heterogeneous tissue changes, where degenerative tissue changes disorganize the tendon structure that is normally composed of aligned collagen.4 Our first study aim was to investigate the association between T2* relaxation times within different tissue compartments of the patellar tendon and symptom severity. The second aim was to investigate the association between baseline T2* and clinical outcome after exercise therapy. The third aim was to evaluate the association between longitudinal T2* changes and changes in severity of symptoms in athletes with PT.METHODS
MRI was performed on the symptomatic knee of jumping athletes, aged 18-35 years, with clinically diagnosed and ultrasound confirmed PT. Imaging was performed on a 3.0T system (GE Discovery MR750), using a 16 channel flexible surface coil (NeoCoil). Using a research prototype 3D-UTE-Cones sequence5 (GE Healthcare, Waukesha, WI, USA), 16 echoes were acquired with echo times ranging from 0.032ms to 26.32ms, constant repetition time of 83.4ms, and spatial resolution of 0.6x0.6x1.5mm. Image registration was performed to facilitate spatial one-to-one mapping of voxels across longitudinal UTE-acquisitions. Participants were scanned at baseline directly after enrollment in the trial and re-scanned after 12 and 24 weeks follow-up. Participants underwent exercise therapy as treatment for PT during 24 weeks. For quantitative T2* analysis, mono-exponential and bi-exponential models were fitted to registered UTE-images.6 A previous described method was used to perform T2* analysis in different tissue compartments within the patellar tendon, to overcome the issue of spatial T2* variation.7 This was performed by thresholding the percentage of short T2* components from the bi-exponential model: 1) mostly short T2* (60-100% short), 2) mostly long T2* (0-30% short) and 3) interface that separated the two (30-60% short). These subregions were considered to represent aligned collagen, degenerative tissue, and interface, respectively. The corresponding mono-exponential T2* relaxation times were calculated. Clinical outcome was assessed using a validated questionnaire (VISA-P) for pain, function and ability to play sports in PT.8 Associations between T2* and VISA-P score were assessed using multiple linear regression analyses. Adjusted general linear models were used to assess associations between baseline T2* and clinical outcome after 24 weeks. Longitudinal data were analyzed using adjusted Generalized Estimating Equations (GEE).RESULTS
A total of 76 athletes (58 men; mean age 24 years ± 3.8) were included. The estimated mean VISA-P score improved significantly from 57 (95%CI, 53-61) at baseline to 72 (95%CI, 67-76; P<.001) at 12 weeks and 80 (95%CI, 76-84; P<.001) at 24 weeks follow-up. Adjusted linear regression analysis demonstrated a statistically significant linear association between VISA-P score and T2* in both degenerative tissue (P=.002) and in the interface between aligned collagen and degenerative tissue (P=.005). There was no significant association of baseline T2* with clinical outcome after 24 weeks of exercise therapy for all of the tissue compartments of the patellar tendon (degenerative tissue (P=.29), aligned collagen (P=.95) and the interface compartment (P=.55)). A significant decrease in T2* was found in the voxels that represented the degenerative tissue of the patellar tendon, from 14.2±3.2 ms at baseline to 13.5±3.4 ms at 12 weeks (adjusted mean difference (95% CI)= 0.7 ms (0.1-1.3), P=.09) and 12.8±3.5 ms at 24 weeks (adjusted mean difference (95% CI)= 1.3 ms (0.6-2.0), P=.001) (Figure 1). The significant T2* decrease in degenerative tissue was significantly associated with improvement in severity of symptoms (main effect, -1.2 [95% CI: -2.0 to -0.4]; P=.005) (Figure 2). There was no association with clinical outcome for the aligned collagen (P=.77) and interface (P=.06) tissue compartments.DISCUSSION
The longitudinal decrease in T2* relaxation times within the degenerative tissue of the patellar tendon provides a better insight into the structural changes that occur as response to exercise therapy. Most conservative treatment options focus on structural adaptation of the patellar tendon, but clinically available imaging modalities lack the ability to measure this structural adaptation.CONCLUSION
Subregional quantitative analysis of T2* using UTE-MRI in patients with patellar tendinopathy leads to the identification of tissue-specific T2* relaxation times which can facilitate the detection of changes in tendon hydration state over time. Decreasing T2* relaxation times in the degenerative tissue of the patellar tendon are associated with improved clinical outcome after exercise therapy for patellar tendinopathy, while it is unsuitable as a single predictive measurement at baseline for clinical outcome.Acknowledgements
No acknowledgement found.References
1. Zwerver J, Bredeweg SW, Van Den Akker-Scheek I. Prevalence of jumper’s knee among nonelite athletes from different sports: A cross-sectional survey. Am J Sports Med. 2011;39(9):1984–1988.
2. Chang EY, Du J, Chung CB. UTE imaging in the musculoskeletal system. J Magn Reson Imaging. 2015;41(4):870-883.
3. Robson MD, Gatehouse PD, Bydder M, Bydder GM. Magnetic Resonance: An Introduction to Ultrashort TE (UTE) Imaging. J Comput Assist Tomogr. 2003;27(6):825-846.
4. Parkinson J, Samiric T, Ilic MZ, Cook J, Feller JA, Handley CJ. Change in proteoglycan metabolism is a characteristic of human patellar tendinopathy. Arthritis Rheum. 2010;62(10):3028–3035.
5. Du J, Bydder M, Takahashi AM, Carl M, Chung CB, Bydder GM. Short T2 contrast with three-dimensional ultrashort echo time imaging. Magn Reson Imaging. 2011;29(4):470-482.
6. Du J, Diaz E, Carl M, Bae W, Chung CB, Bydder GM. Ultrashort echo time imaging with bicomponent analysis. Magn Reson Med. 2012;67(3):645-649.
7. Breda SJ, Poot DHJ, Papp D, et al. Tissue‐Specific T2* Biomarkers in Patellar Tendinopathy by Subregional Quantification Using 3D Ultrashort Echo Time MRI. J Magn Reson Imaging. February 2020:jmri.27108.
8. Zwerver J, Kramer T, van den Akker-Scheek I. Validity and reliability of the Dutch translation of the VISA-P questionnaire for patellar tendinopathy. BMC Musculoskelet Disord. 2009;10:102.
Figures
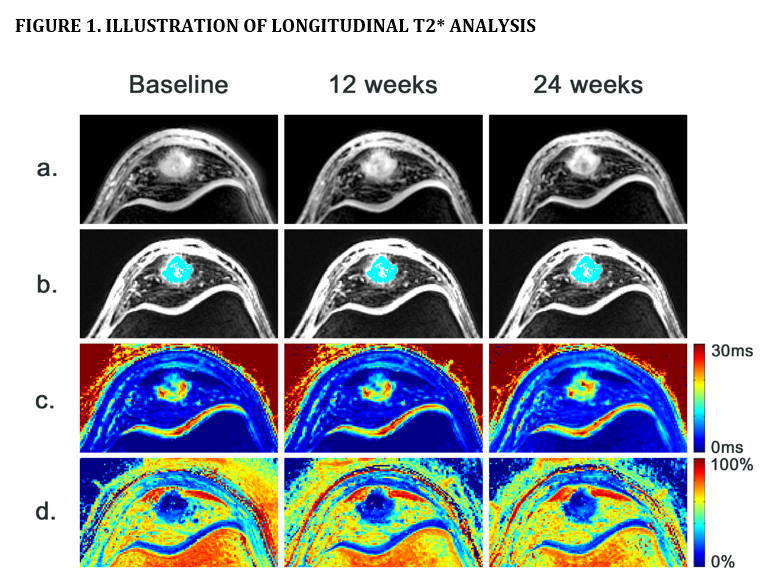
A) Axial 3D-UTE images of the proximal patellar tendon in a patient with patellar tendinopathy.
B) Selected voxels for tissue-specific T2* analysis in the degenerative tissue of the patellar tendon. Mean T2* decreased from 19.9±7.3 ms (baseline) to 17.2±5.8 ms (12 weeks) to 16.8±4.9 ms (24 weeks).
C) Mono-exponential T2* maps, on a scale from dark blue (short T2* relaxation times) to red (long T2* relaxation times).
D) Bi-exponential fitting maps, displaying the percentage of short T2* components on a scale from dark blue (0% short T2* components) to red (100% short T2* components).
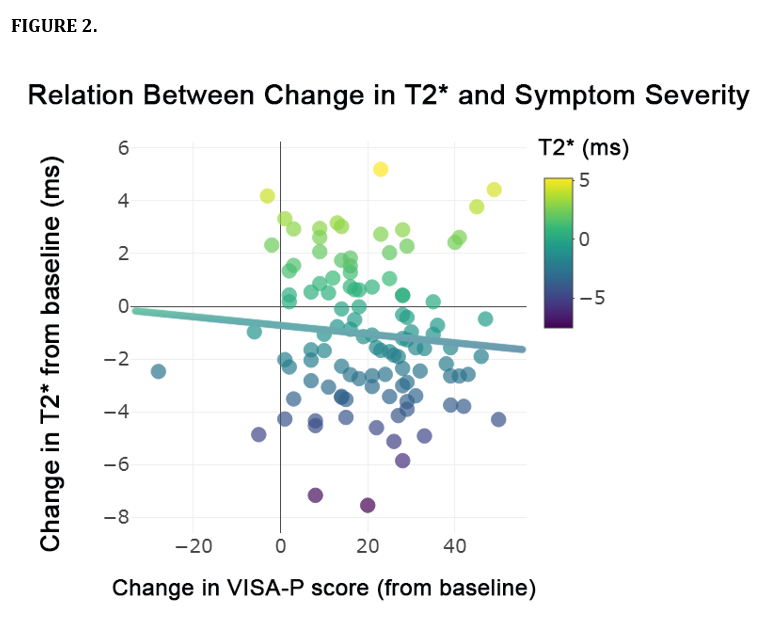
Relation between the change in T2* relaxation times and symptom severity. Symptom severity was assessed using the validated VISA-P questionnaire (scale 0-100), where 100 represents no pain, unrestricted function and maximum ability to play sports.