0843
A Method for Measuring B0 Field Inhomogeneity using Quantitative DESS (qDESS)1Department of Radiology, Stanford University, Stanford, CA, United States, 2Department of Biomedical Data Science, Stanford University, Stanford, CA, United States, 3Department of Bioengineering, Stanford University, Stanford, CA, United States, 4Department of Electrical Engineering, Stanford University, Stanford, CA, United States
Synopsis
Quantitative T2 mapping is a valuable tool for studying OA changes. qDESS is a rapid sequence that provides accurate T2 measurements and SNR-efficient morphological imaging. B0 mapping is an auxiliary scan acquired to correct field inhomogeneity-induced errors using techniques such as WASSR and 2-GRE. This work proposes a method for B0 mapping that exploits the phase difference between the two echoes acquired with qDESS. The experiments with phantom and in-vivo simultaneous bilateral knee acquisitions showed that the B0 maps obtained with the qDESS method were in good agreement with those obtained using the WASSR method and the 2-GRE method.
Introduction
Quantitative T2 mapping is a valuable tool for assessing macromolecular changes in collagenous tissues and studying osteoarthritis (OA) progression1,2. The quantitative double-echo in steady-state (qDESS) pulse sequence provides accurate T2 measurements and SNR-efficient morphological imaging in five minutes or less and is becoming more widely utilized in knee OA research8. However, acquiring accurate T2 measurements can require long scan times, and often multiple sequences. For example, B0 mapping is an auxiliary scan acquired to correct field inhomogeneity-induced errors in qMRI4,5, using techniques such as the off-resonance saturation-based Water Saturation Shift Referencing6 (WASSR) and two Gradient‐Recalled-Echo7 (2-GRE).This work proposes a method for B0 mapping that exploits the phase difference between the two echoes acquired with a qDESS sequence9. This may allow implementing B0 correction for qDESS T2 mapping without acquiring an additional scan with an additional benefit of co-registration of the T2 and B0 maps. The method was validated with phantom and in-vivo simultaneous bilateral knee acquisitions by comparing the B0 maps obtained using the proposed method with those obtained using the WASSR method and a standard 2-GRE method.
Theory
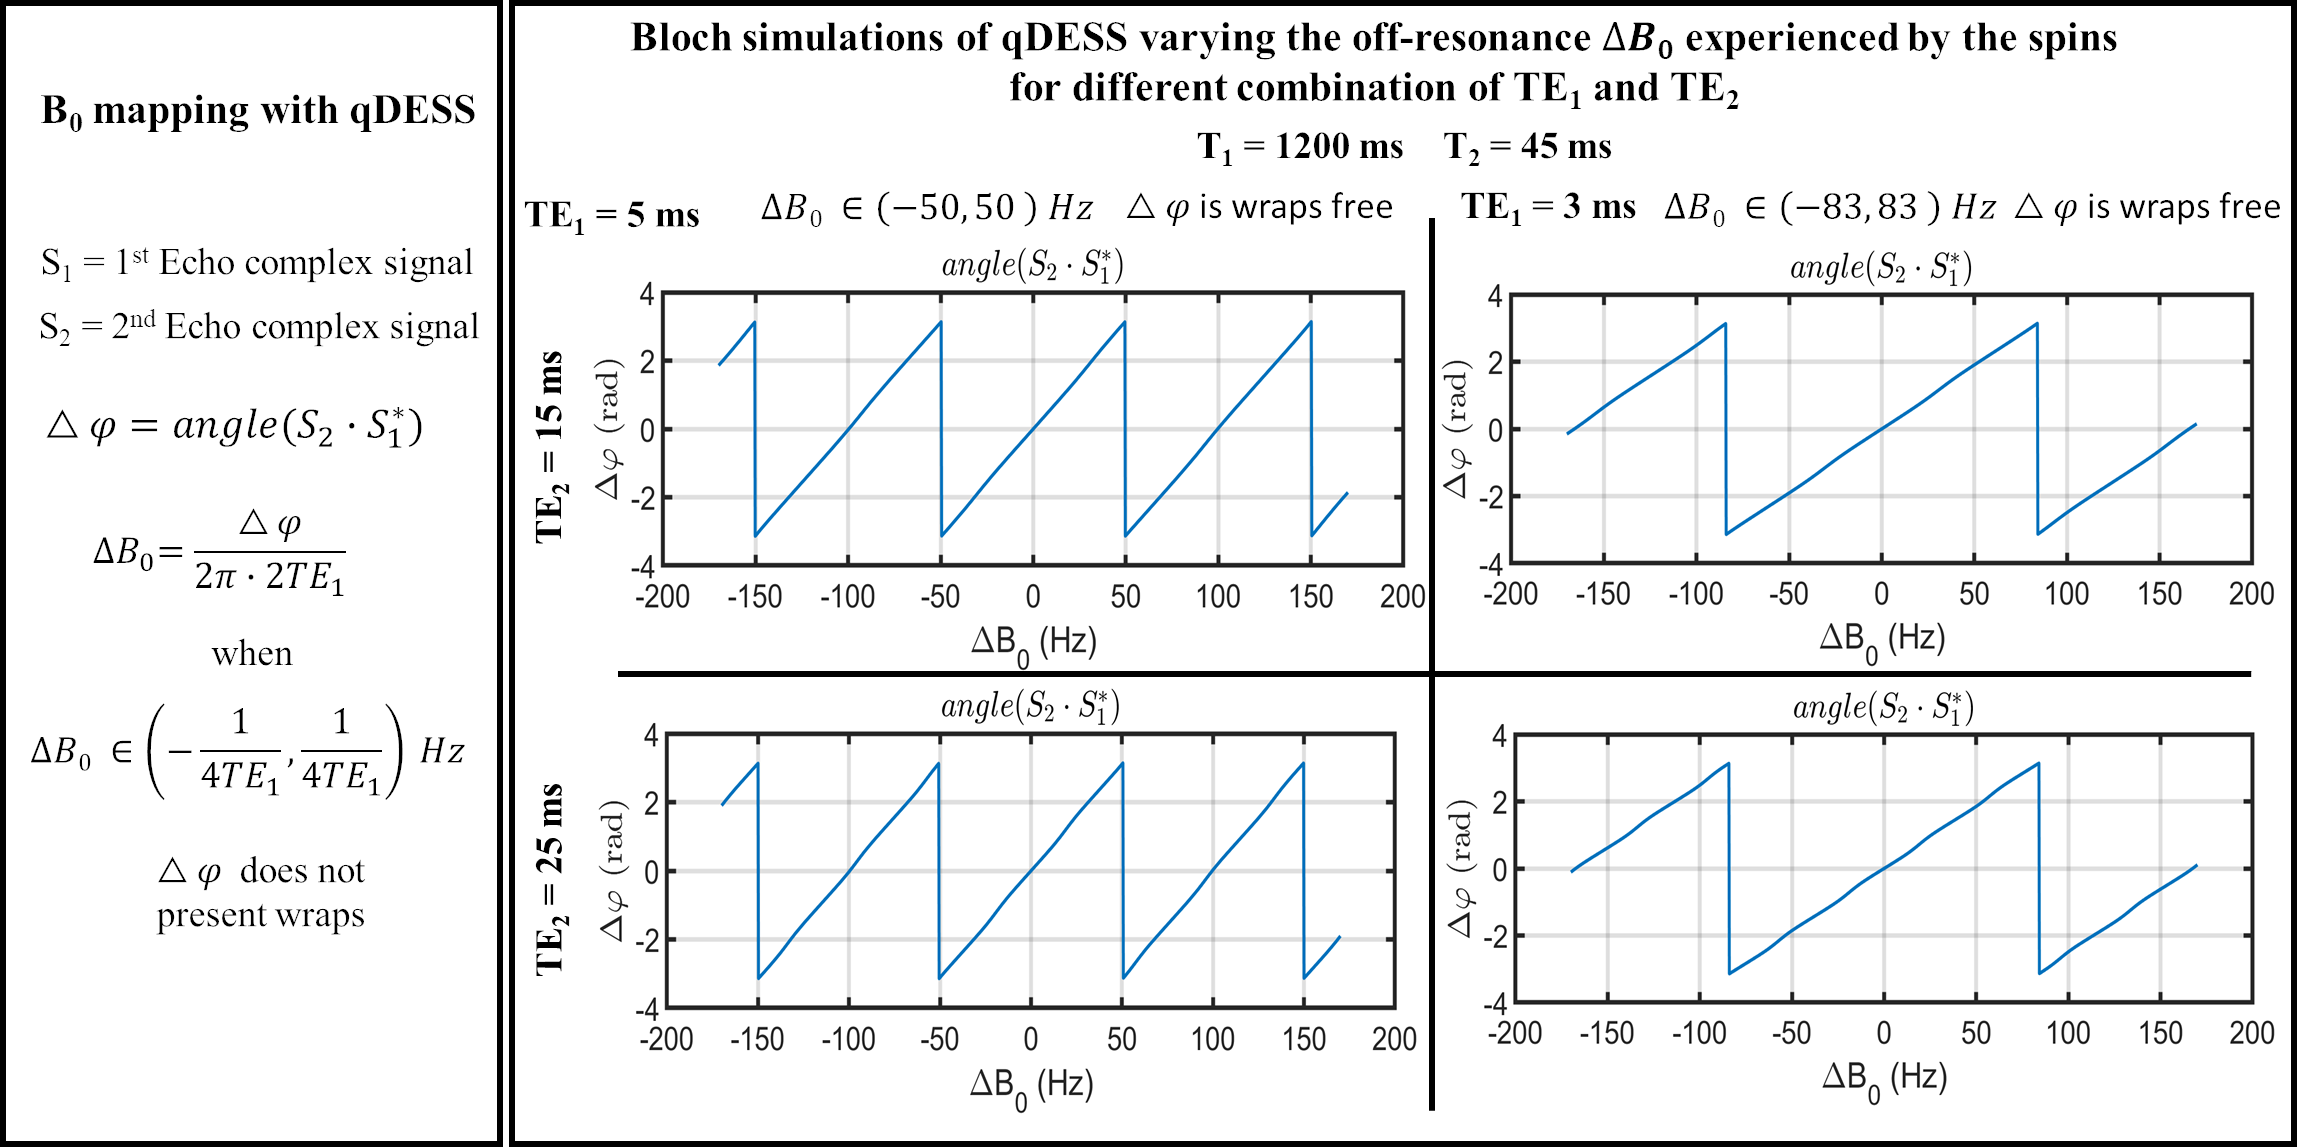
For the first (S1) and second (S2) qDESS echoes acquired at echo times TE1 and TE2, respectively, ΔB0 (in Hz) can be computed according to eq.1. $$ \Delta B_{0} = \frac{angle(S_{1} \cdot S_{2}^{*})}{2 \pi \cdot 2TE_{1}} $$Where the numerator is the phase difference, Δφ, between S2 and S1 and $$$ angle(S_{1}\cdot S_{2}^{*}) $$$ is the Hermitian inner product10 of the two echoes. When ΔB0 varies more than the $$$ \left( -\frac{1}{4TE_{1}},\frac{1}{4TE_{1}} \right) $$$ range across the volume, Δφ is affected by phase wraps and requires unwrapping for accurate B0 mapping.
Methods
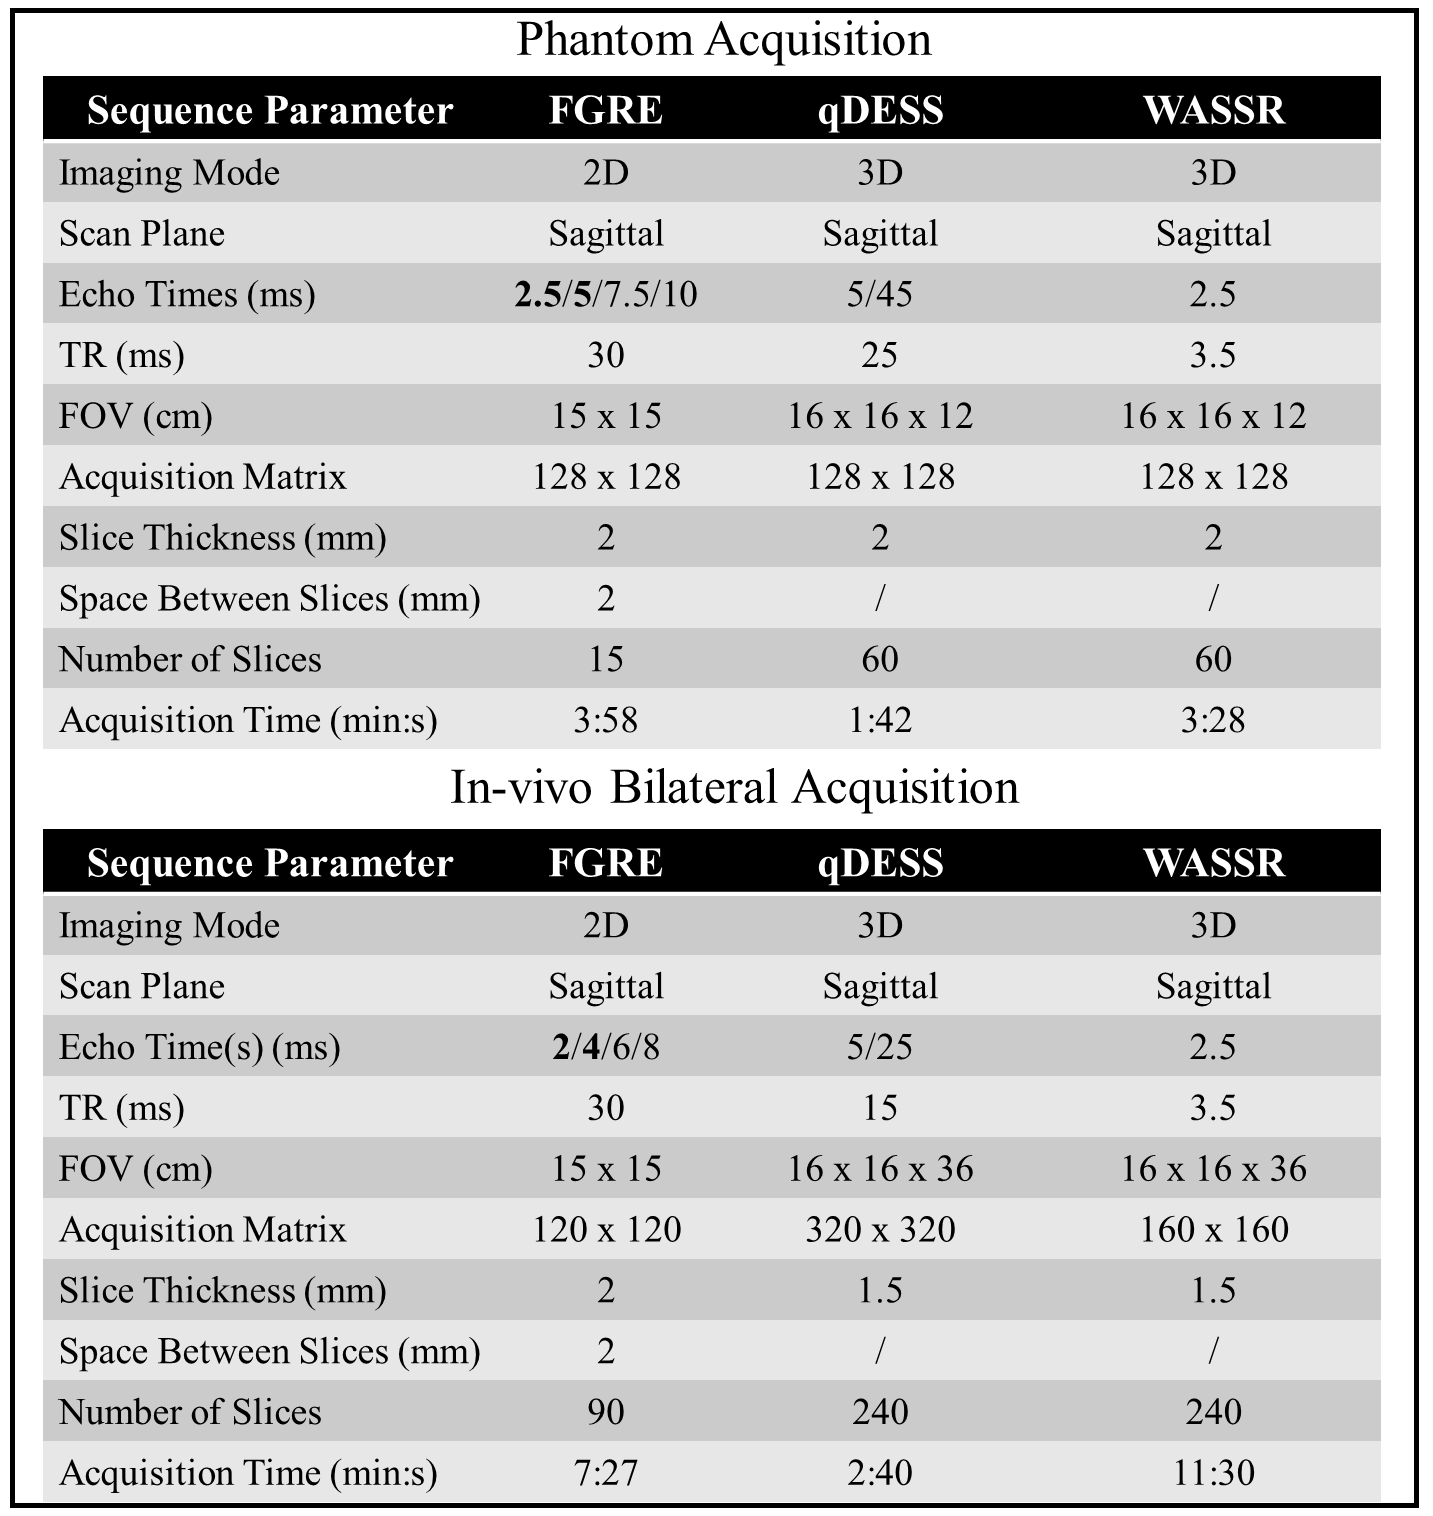
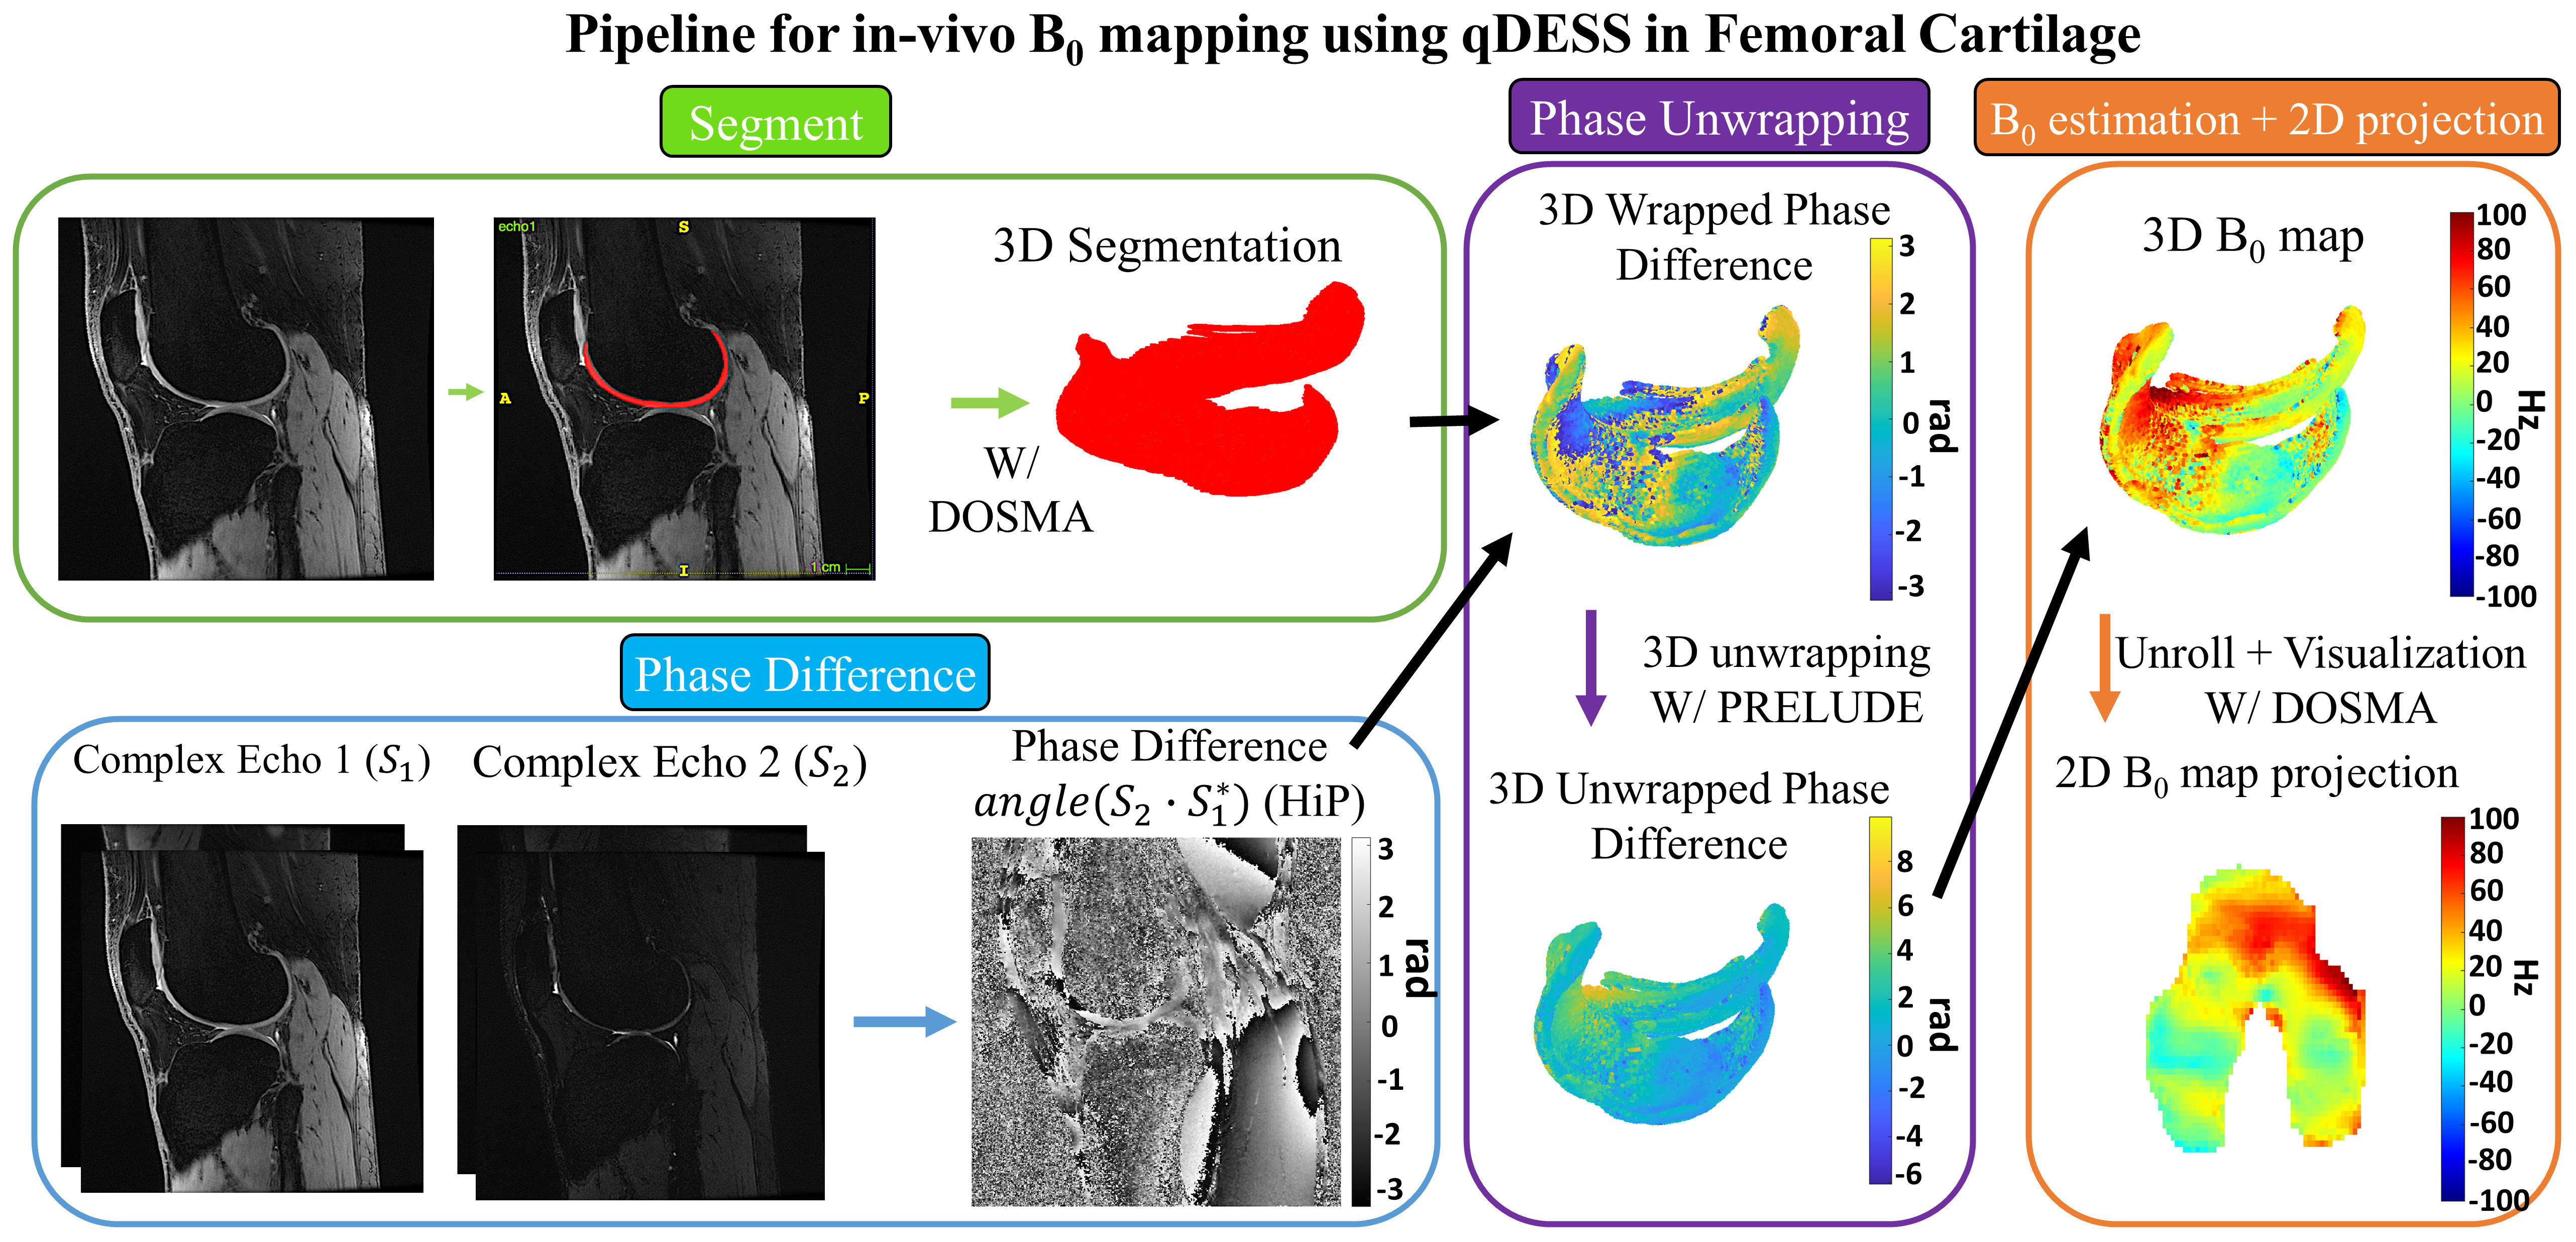
To verify Eq. 1, qDESS Bloch simulations varying the ΔB0 experienced by the spin ensembles for different combinations of TE1 and TE2 were simulated. To validate the qDESS B0 measurement method, a phantom and a healthy subject were scanned using qDESS, WASSR, and fast multi-echo GRE (FGRE) sequences. MRI acquisitions were performed on a 3T SIGNA Premier scanner (GE Healthcare, Milwaukee, WI, USA) using 16-channel flexible phased-array, receive-only coils (NeoCoil, Pewaukee, WI, USA). For the healthy subject, a simultaneous bilateral knee acquisition was used11. The first two echoes of the FGRE acquisition were used to implement the 2-GRE method. All sequence parameters are summarized in Fig.1. The coil-combined phase difference between the second and the first echo was obtained using the sum Hermitian inner product method12. WASSR and FGRE volumes were registered to the first echo of qDESS.For the in-vivo data, B0 mapping was assessed in the femoral cartilage (FC) and the pipeline is summarized in Fig. 2. For both knees, after coil-combination, the FC was segmented using DOSMA13, and the 3D segmented phase map was unwrapped with PRELUDE14. qDESS B0 maps were then computed according to eq. 1 and projected onto a 2D space for visualization15.
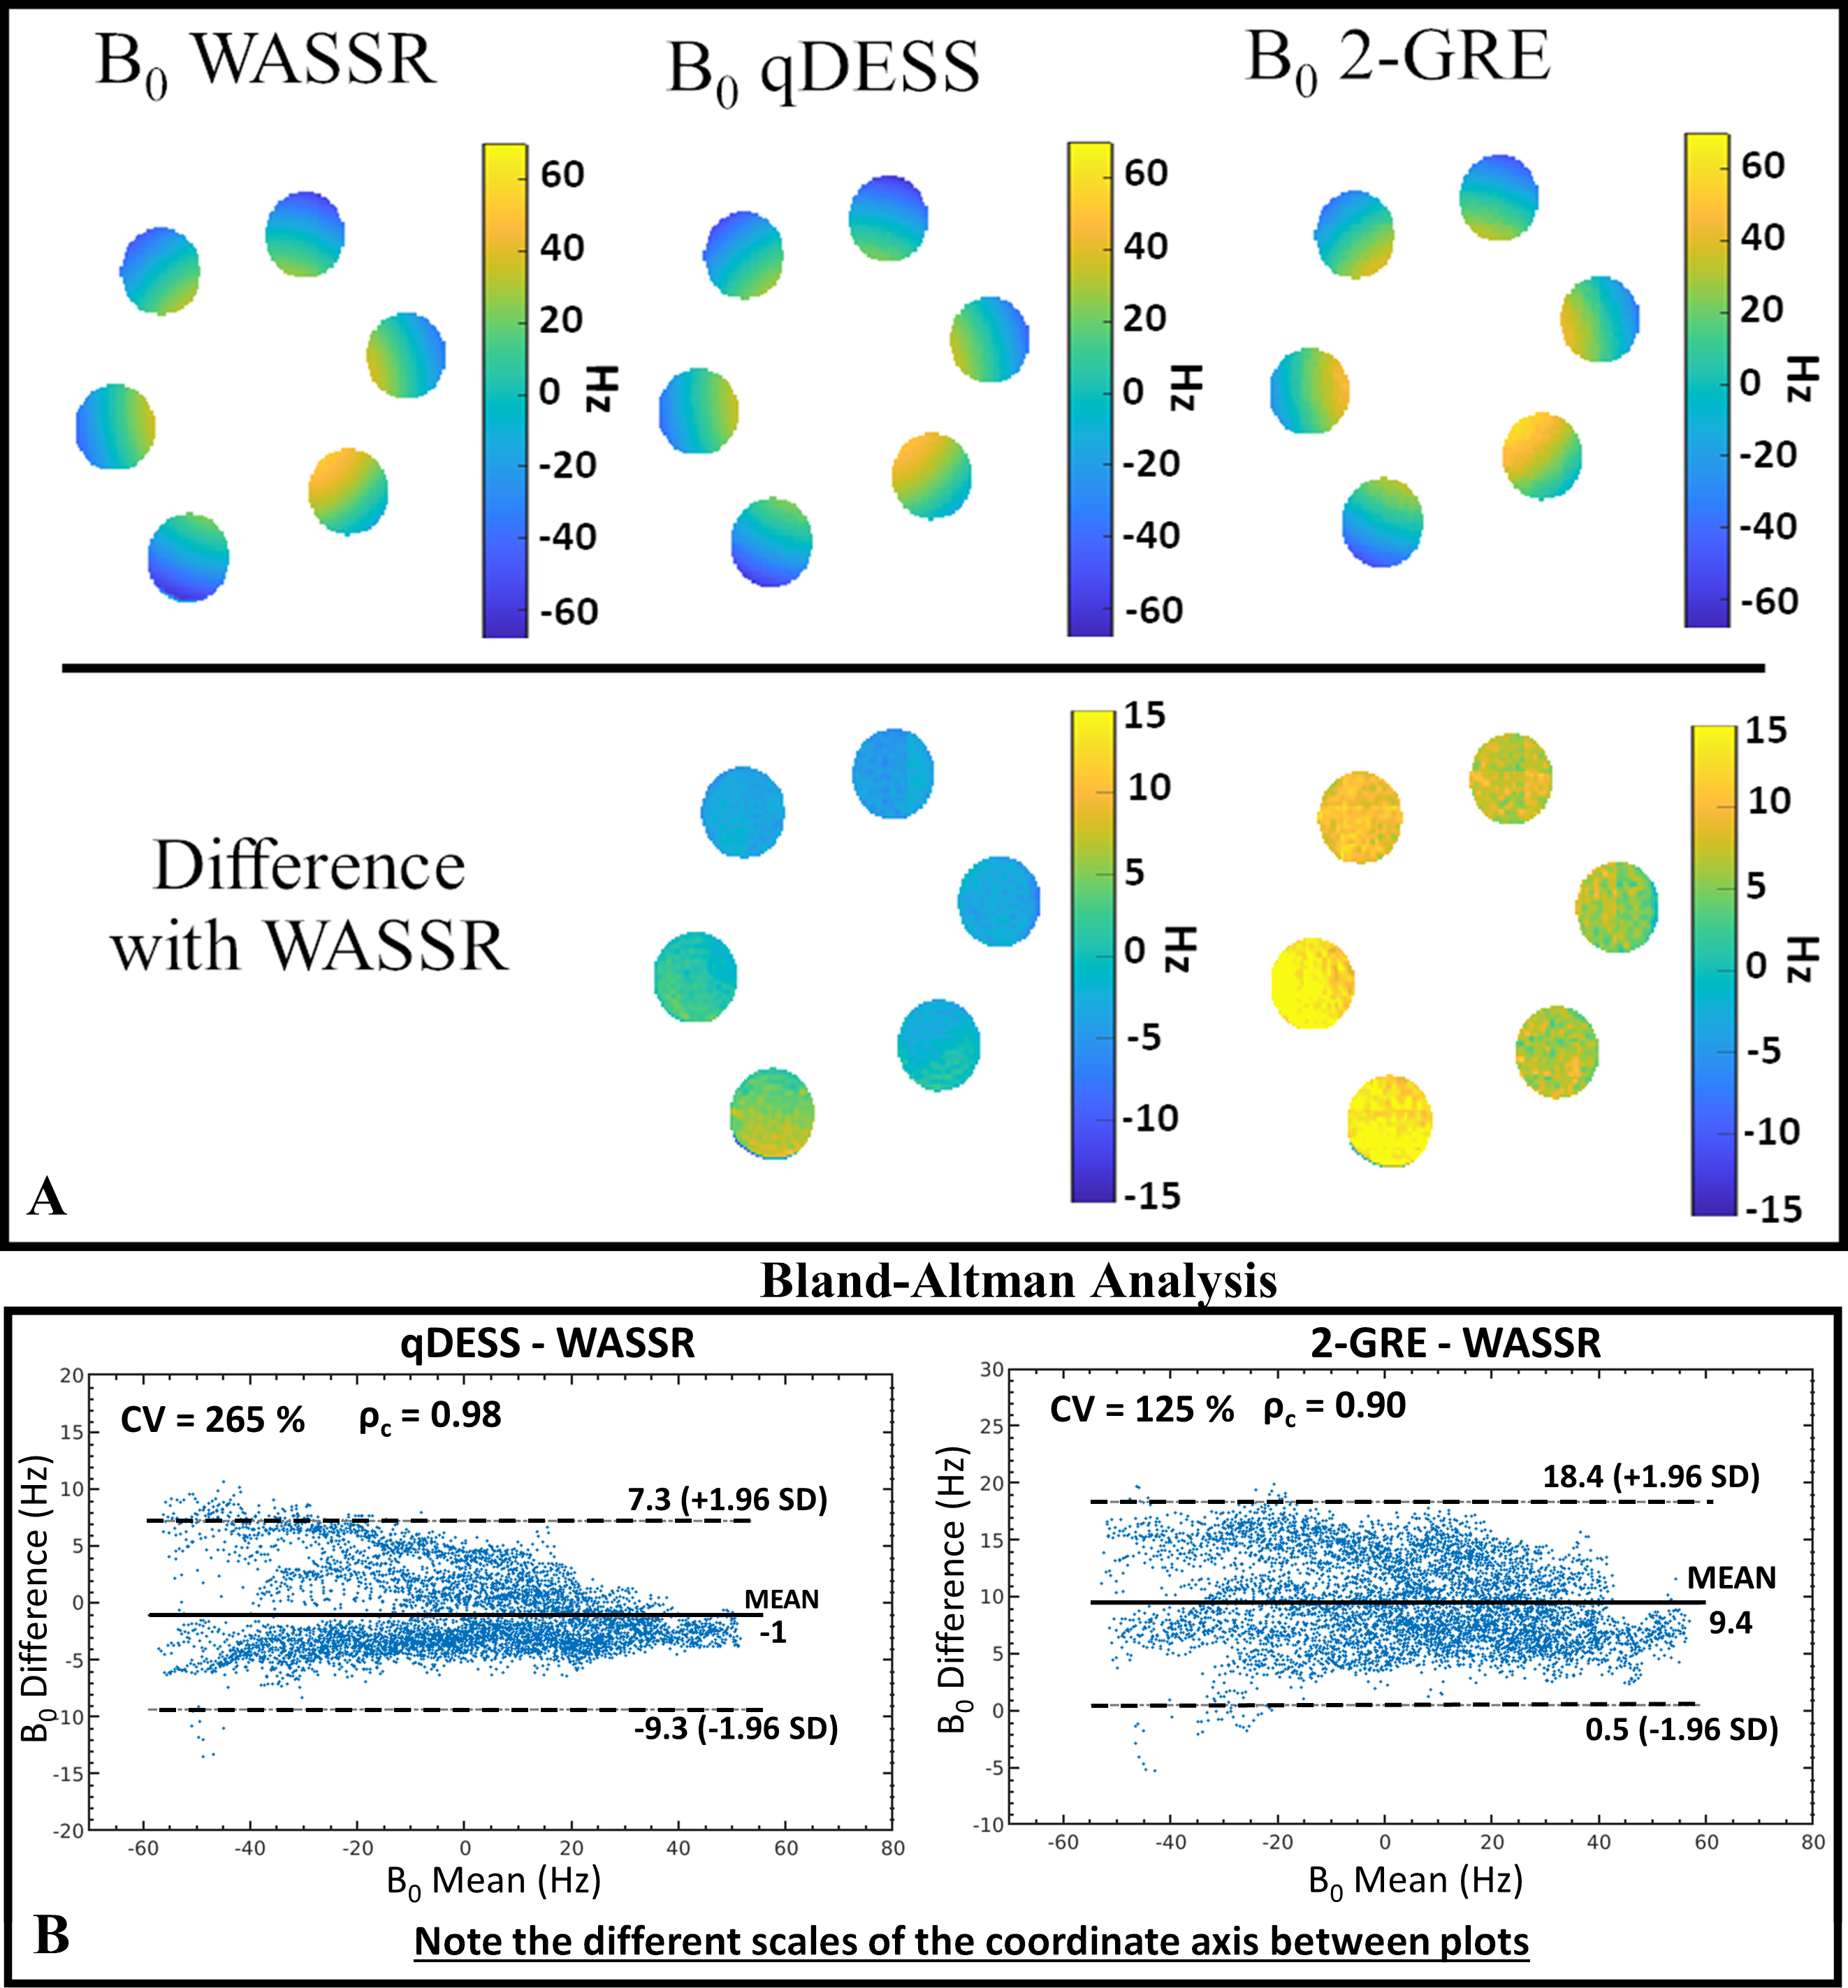
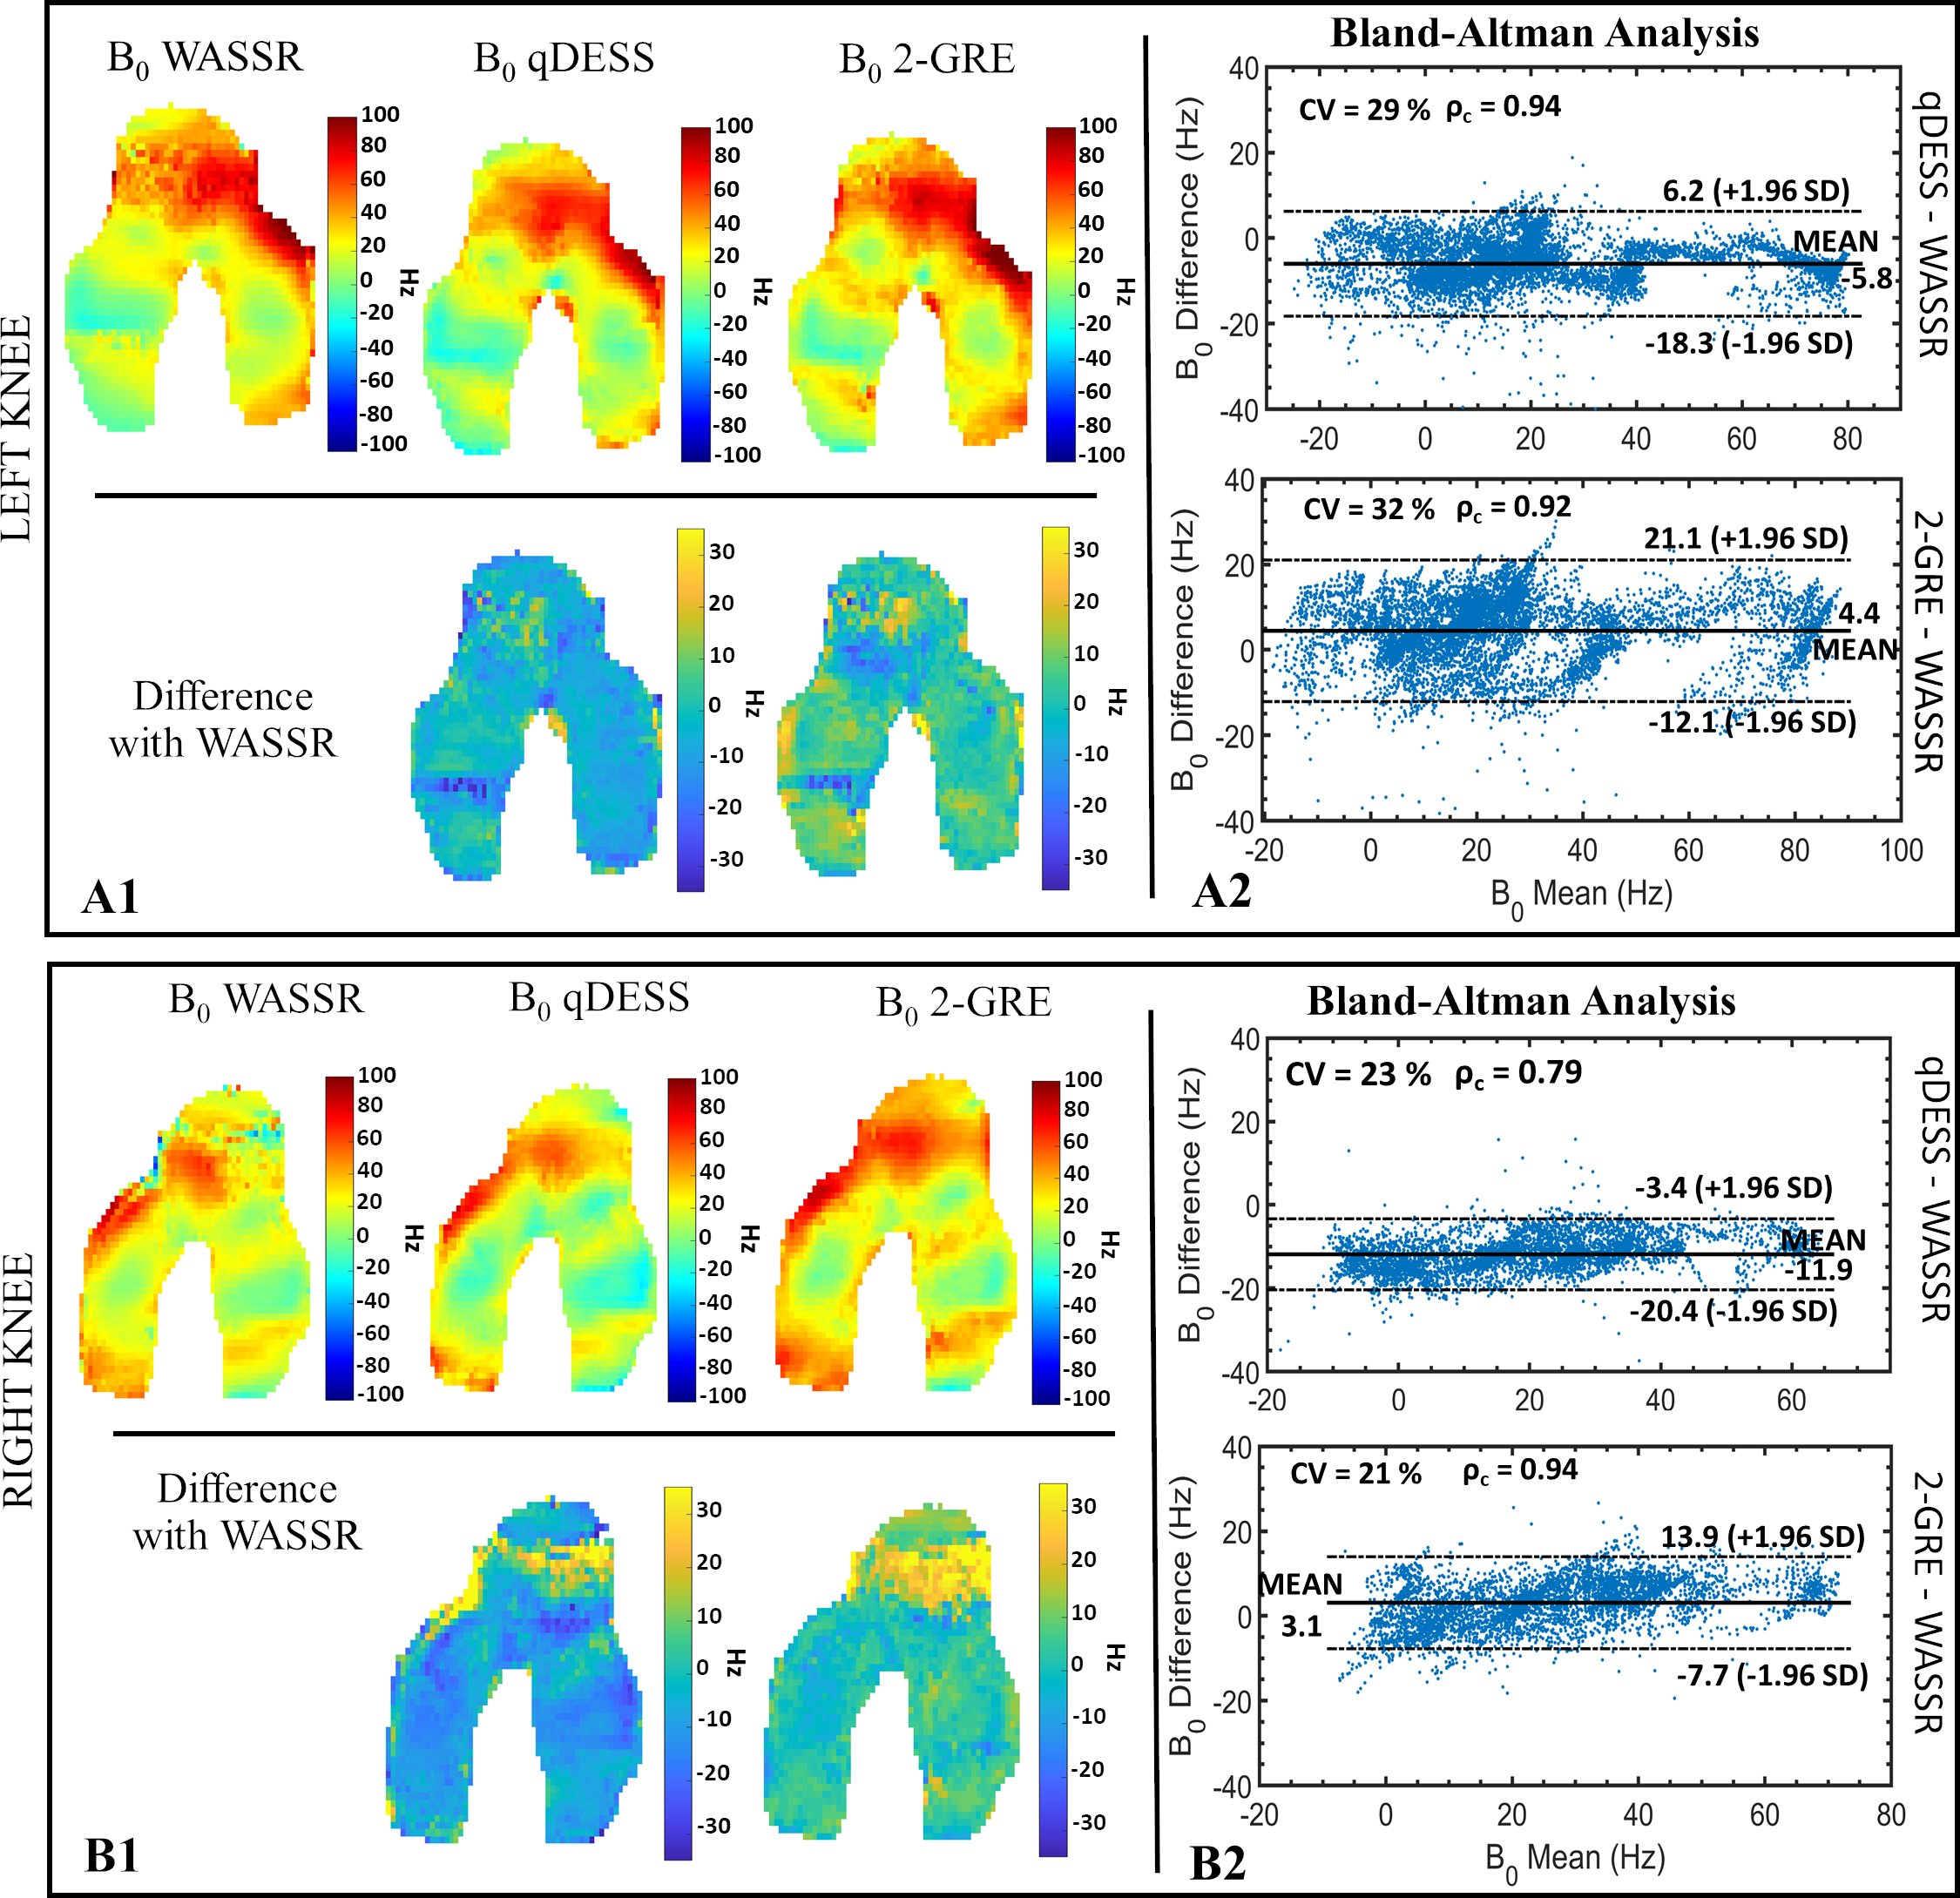
The B0 maps obtained with the qDESS and the 2-GRE methods were compared against those obtained with the WASSR method, considered as reference. The comparison was quantitatively assessed exploiting pixel-wise difference maps and Bland-Altman (BA) analysis. Lin's concordance coefficient (ρc) and the coefficient of variation (%CV) between methods were also evaluated.
Results
Bloch simulations (Fig. 3) showed that only TE1 defined the slope of the linear relationship between TE1 and ΔB0. Whit TE1=5ms, the slope did not change for both TE2=15 and 25ms. The phantom B0 maps obtained with the WASSR, qDESS, and 2-GRE methods and BA plots with the WASSR reference are shown in Fig. 4. Overall, qDESS had better agreement with WASSR (ρc=0.98, Mean difference=-1Hz) than 2-GRE WASSR (ρc=0.90, Mean difference=9.4Hz). For the in-vivo acquisition, both the qDESS and 2-GRE methods produced B0 maps that were in good agreement with those obtained with WASSR as highlighted by the 2D projected B0 maps and the BA plots(Fig. 5). For the left knee, ρc was equal to 0.94 and 0.92 with a mean difference(MD) of -5.5 Hz and 4.4 Hz for qDESS and 2-GRE, respectively. For the right knee, B0 values obtained using qDESS had an MD of -11.9 Hz, whereas, with the 2-GRE method, MD was equal to 3.3 Hz.Discussion
The proposed method for measuring B0 inhomogeneities from a qDESS acquisition provided B0 maps that were in good agreement with those obtained using WASSR both in phantom and in-vivo. The agreement between qDESS and WASSR was comparable to that of a standard 2-GRE method. Errors in qDESS B0 measurements may be due to errors introduced by the unwrapping algorithm. When phase unwrapping was not necessary, there was an almost perfect agreement between qDESS and WASSR. The echo time TE1 defines the wrap free bandwidth as shown with the Bloch simulation.Conclusion
A method for accurately measuring B0 field inhomogeneity with qDESS was proposed and validated in phantom and in-vivo bilateral knee acquisitions against standard B0 mapping methods. The method may allow for the implementation of a B0 correction method for qDESS T2 mapping using an inherently co-registered B0 map without additional scan time. More generally, the method may help shorten knee imaging protocols that require an auxiliary B0 map by exploiting a qDESS acquisition that also provides T2 measurements and high-quality morphological imaging.Acknowledgements
This work was supported by GE Healthcare and NIH grants R01-AR077604, R01-EB002524, R01-AR074492, K24-AR062068, and R00-EB022634.References
[1] Liu F, Chaudhary R, Hurley SA, Munoz Del Rio A, Alexander AL, Samsonov A, Block WF, Kijowski R. Rapid multicomponent T2 analysis of the articular cartilage of the human knee joint at 3.0T. J Magn Reson Imaging 2014;39:1191–1197.
[2]Ling W, Regatte RR, Navon G, Jerschow A. Assessment of glycosaminoglycan concentration in vivo by chemical exchange-dependent saturation transfer (gagCEST). Proc Natl Acad Sci USA 2008;105:2266–2270.
[3] C.G.Peterfy, E.Schneider, M. Nevitt. The osteoarthritis initiative: report on the design rationale for the magnetic resonance imaging protocol for the knee. Osteoarthritis Cartilage 16:1433–1441
[4] Sun PZ, Farrar CT, Sorensen AG. Correction for artifacts induced by B-0 and B-1 field inhomogeneities in pH-sensitive chemical exchange saturation transfer (CEST) Imaging. Magn Reson Med 2007; 58:1207–1215.
[5] Majumdar S, Orphanoudakis SC, Gmitro A, O'Donnell M, Gore JC. Errors in the measurements of T2 using multiple‐echo MRI techniques. II. Effects of static field inhomogeneity. Magn Reson Med 1986; 3:562–574
[6] Kim M, Gillen J, Landman BA, Zhou J, van Zijl PC. Water saturation shift referencing (WASSR) for chemical exchange saturation transfer (CEST) experiments. Magn Reson Med 2009;61:1441–1450.
[7] Webb P, Spielman D, Macovski A. Inhomogeneity correction for invivo spectroscopy by high-resolution water referencing. Magn Reson Med 1992;23:1–11
[8] Leupold, J. Steady‐state free precession signals of arbitrary dephasing order and their sensitivity to T2*. Concepts Magn Reson Part A. 2017; 46A:e21435.
[9] Chaudhari AS, Black MS, Eijgenraam S, Wirth W, Maschek S, Sveinsson B, Eckstein F, Oei EH, Gold GE, Hargreaves BA. Five‐minute knee MRI for simultaneous morphometry and T2 relaxometry of cartilage and meniscus and for semiquantitative radiological assessment using double‐echo in steady‐state at 3T. Journal of Magnetic Resonance Imaging 2018;47(5):1328-1341.
[10] Scharnhorst K. Angles in complex vector spaces. Acta Appl Math 2001; 69: 95–103.
[11] Kogan F, Levine, E, Chaudhari AS, Monu UD, Epperson K, Oei EH, Gold GE and Hargreaves BA (2018), Simultaneous bilateral‐knee MR imaging. Magn. Reson. Med., 80: 529-537. doi:10.1002/mrm.27045
[12] Lu K, Liu TT, Bydder M. Optimal phase difference reconstruction: comparison of two methods. Magn Reson Imaging 2008; 26: 142–145
[13] Desai Arjun, Barbieri Marco, Mazzoli Valentina, Rubin Elka, Black Marianne, Watkins Lauren, Gold Garry, Hargreaves Brian, Chaudhari Akshay, DOSMA: A deep-learning,open-source framework for musculoskeletal MRI analysis, in: ISMRM 27th Annual Meeting and Exibition, Montreal, Canada, 11-16 May 2019.
[14] Jenkinson M. Fast, automated, N-dimensional phase-unwrapping algorithm. Magn. Reson. Med. 2003; 49(1): 193–197
[15] Monu UD, Jordan CD, Samuelson BL, Hargreaves BA, Gold GE, McWalter EJ. Cluster analysis of quantitative MRI T2 and T1ρ relaxation times of cartilage identifies differences between healthy and ACL-injured individuals at 3T. Osteoarthritis and cartilage 2017;25(4):513-520
Figures