0830
Characterization of radiological findings in mouse models of cerebral small vessel diseases using multimodal MRI at 14.1 Tesla1Department of Radiology, University of California, San Francisco, San Francisco, CA, United States, 2Department of Ophthalmology, University of California, San Francisco, San Francisco, CA, United States
Synopsis
Cerebral small vessel diseases (cSVDs) are a group of conditions that account for up to 30% of strokes. Clinical manifestations associated with cSVD include blood–brain barrier (BBB) leakage, microbleeds, and white matter lesions. Here, we use multimodal MRI at 14.1Tesla to characterize radiological findings observed in innovative mouse models of cSVD caused by mutations in Collagen type IV alpha 1 (Col4a1). By leveraging several image processing toolboxes, we established a workflow that could successfully differentiate between disease subtypes based on the spatial distribution and volume of lesions.
Summary of Main Findings
Multi-modal MRI at 14.1 Tesla revealed that Col4a1 mutant mouse models faithfully recapitulate the radiological manifestations of cSVDs. Notably, we show that allelic heterogeneity influences disease severity as well as the nature and distribution of lesions.Introduction
Cerebral small vessel diseases (cSVDs) are a heterogeneous group of conditions that account for up to 30% of all strokes.1 Radiological manifestations of cSVDs include blood–brain barrier (BBB) leakage, microbleeds, and white matter lesions.2 Despite the high prevalence and rising incidence of cSVDs, the potential correlations between cSVDs’ neurological deficits, neuroimaging features, and pathological findings remain unclear.3 Mutations in type IV collagen alpha 1 (Col4a1) constitute a major cause of cSVDs.4 In this study, we used seven different Col4a1 mutant mouse strains that recapitulate the clinical spectrum of cSVDs manifestations to investigate whether clinically-relevant multimodal MR imaging could be used to differentiate between disease subtypes that might benefit from distinct therapeutic interventions.Methods
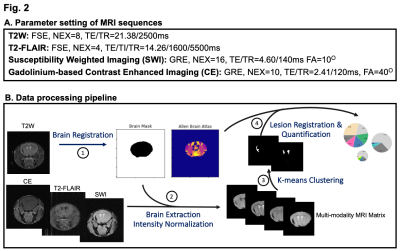
Animals: In this study, we used an allelic series of seven Col4a1 mutations in the mouse (n=40 total, male only, age-matched, 51.2-53.7 weeks-old) (Fig.1A). These mutations consist in six distinct glycine missense mutations in the triple-helix-forming domain: G394V (n=5), G658D (n=5), G912V (n=5), G1038S (n=5), G1180D (n=5), and G1344D (n=4), and one missense mutation in the NC1 domain: S1582P (n=5) (Fig.1B). Six age-matched wild-type (WT) littermates mice were used as controls. A significant reduction in body weight was observed in mice with the G912V and G1180D mutations (**p=0.005 and p=*0.024, resp, Fig.1C).MR Acquisitions: Each imaging session was performed on a 14.1Tesla Agilent® system using a 1H Agilent® volume coil (inner diameter 40mm). All mice were imaged under 1.3-1.8% isoflurane using 4 optimized sequences of matching geometry (Field of view (FOV)=20x20mm2, matrix=256x256, 16 slices, 0.4mm slice thickness, 0.1mm interslice gap), for an overall acquisition time of 55 min/animal: (1)-T2-weighted MRI (fast spin echo (FSE), NEX=8, TE/TR=21.38/2500ms), (2)-T2-FLAIR (FSE, NEX=4, TE/TI/TR=14.26/1600/5500ms), (3)-Susceptibility Weighted Imaging (SWI) (gradient-echo, NEX=16, TE/TR=4.60/140ms, FA=10º), and (4)-Gadolinium-based Contrast Enhanced Imaging (CE) (GRE, NEX=10, TE/TR=2.41/120ms, FA=40º) (Fig.2A). For CE MRI, a pre-injection scan was acquired, and then a dosage of 20𝜇L/100g Gadavist® was injected in the tail vein before the acquisition of a post-injection scan 2 minutes later. The enhancement ratio of CE is determined in a pixel-wise way as $$$\frac{Intensity_{post}-Intensity_{pre}}{Intensity_{pre}}$$$.
Data Analysis: An open-sourced atlas-based imaging data analysis pipeline (AIDAmri)5 was customized to create a Python-based workflow registering mouse brain images to the Allen Brain Reference Atlas (Fig.2B).6 An unsupervised machine learning algorithm (K-means) was also applied to segment and quantify lesions detected by multimodal MRI. Independent t-tests were performed (*p<0.05, **p<0.01).
Results
Using T2W imaging, hypointense lesions were detected in all Col4a1 mutant mouse strains except those with G394V and G912V mutations. In comparison, SWI detected a higher number of hypointense lesions (including smaller lesions) with sharper boundary in these same cohorts (Fig.3A), with the SWI-sensitive lesion volumes of G1038S and G1344D significantly larger than that of control mice (p=0.006 and 0.046 respectively, Fig.3B). Notable signal enhancement was also detected in G1344D and G394V mutant mice following Gadolinium injection (Fig.4B). After suppression of water signal, T2-FLAIR confirmed that the hyperintensity seen from T2W was cerebral spinal fluid (Fig.4A), suggesting its infiltration into the boundary of grey matter/white matter in several cases of G1038S and G394V. Finally, after analyzing the spatial distribution of lesions, we found that the G1038S, G1344D, G658D, and G1180D cohorts have SWI-sensitive lesions in deep gray matter areas, such as the thalamus and hypothalamus (Fig.3A pie charts). However, only G1038S mice showed lesions in cortical brain regions, suggesting mechanistic heterogeneity among Col4a1 mutations.Conclusions
Using a multimodal imaging approach, we showed that Col4a1 mutant mice recapitulate the radiological features commonly seen in individuals with cSVDs and that allelic heterogeneity influence the size and distribution of lesions. Immunohistochemistry studies are underway to determine the pathological basis of the lesions detected by multi-modality MRI. Additional imaging approaches to investigate perfusion, myelination and metabolism are also being evaluated to further characterize the pathogenesis and subtypes of cSVDs in Col4a1 mutant mice.Acknowledgements
This work was supported by research grants: NIH R61NS115132 and NIH RF1NS110044.References
1. L. Pantoni and P. B. Gorelick, Cerebral Small Vessel Disease. Cambridge University Press, 2014.
2. L. Pantoni, “Cerebral small vessel disease: from pathogenesis and clinical characteristics to therapeutic challenges,” Lancet Neurol., vol. 9, no. 7, pp. 689–701, Jul. 2010.
3. J. M. Wardlaw et al., “Neuroimaging standards for research into small vessel disease and its contribution to ageing and neurodegeneration,” Lancet Neurol., vol. 12, no. 8, pp. 822–838, Aug. 2013.
4. S. Lanfranconi and H. S. Markus, “COL4A1 Mutations as a Monogenic Cause of Cerebral Small Vessel Disease A Systematic Review,” 2010.
5. Pallast N, Diedenhofen M, Blaschke S, Wieters F, Wiedermann D, Hoehn M, Fink GR and Aswendt M. Processing Pipeline for Atlas-Based Imaging Data Analysis of Structural and Functional Mouse Brain MRI (AIDAmri). Front. Neuroinform. 13:42, 2019.
6. Dong, H. The Allen Reference Atlas: A Digital Color Brain Atlas of the C57Bl/6J Male Mouse. Hoboken, NJ: John Wiley & Sons Inc. 2008.
Figures


