0828
Vessel distance mapping for deep gray matter structures1Biomedical Magnetic Resonance, Otto-von-Guericke-University Magdeburg, Magdeburg, Germany, 2Department of Neurology, Otto-von-Guericke-University, Magdeburg, Magdeburg, Germany, 3German Center for Neurodegenerative Disease, Magdeburg, Germany, 4Center for Behavioral Brain Sciences, Magdeburg, Germany, 5Leibniz Institute for Neurobiology, Magdeburg, Germany
Synopsis
Vessel distance mapping (VDM) is proposed as a novel tool to enable quantitative and qualitative assessment of vascular patterns in deep gray matter structures. At 7T, ToF angiography and QSM were used to depict the arterial and venous vasculature in six subjects. Based on vessel segmentations, vessel distance maps were generated by computing the Euclidean distance of each non-vessel voxel to its closest vessel. Compared to state-of-the-art methods, VDM interpolates the sparse vessel data to enable new ways to analyze vascular patterns with respect to the surrounding structure.
Introduction
With high resolution MRI, small vessels can be depicted non-invasively and in vivo, enabling new approaches to study vascular changes in aging and pathologies. While vessel atlases and densities have shown promising results to quantify the vasculature with respect to its surrounding anatomy1,2, this comes with inherent challenges. Vessel densities are computed per Region-of-Interest (ROI), hence, they compress the vascular information into a single number without considering the vascular pattern. Vessel atlases register datasets non-linearly to a commonly space. While the major cerebral vessels are consistent between subjects, the inter-subject variability of vascular patterns increases with decreasing vessel size. Thus, co-registration of small vessels is challenging. Here we present vessel distance mapping (VDM) to address these challenges. After vessel segmentation, a Euclidian distance transform is applied to compute the distance of each non-vessel voxel to its closest vessel. VDM was applied to high resolution Time-of-Flight (ToF) angiography and quantitative susceptibility mapping (QSM) to assess the arterial and venous vasculature in deep gray matter structures, respectively.Methods
ToF angiography and QSM were acquired for six subjects (after written consent, study approved by the local ethics committee) at 7T (Siemens Healthineers, Erlangen, Germany) equipped with a 32-channel head coil (Nova Medical, Wilmington, USA). The 0.3x0.3x1.0mm image data were upsampled to 0.3mm isotropic resolution. N4 bias field correction3 was applied to the ToF data. The MSDI algorithm was used for QSM reconstructions4. To allow segmentation of deep gray matter structures, the data was non-linearly registered to MNI space using ANTs5. Afterwards, the inverse transformation was applied to transform the Harvard-Oxford subcortical atlas6 into individual subject space. The following ROIs were assessed bi-laterally: thalamus, hippocampus, putamen, pallidum, and caudate nucleus. Further, a study template was built iteratively by non-linearly co-registering all datasets using ANTs5. Vessels were segmented using OMELETTE, a publicly available vessel segmentation7. In brief, Jerman’s vesselness-filter8 enhances vessels and the subsequent hysteresis thresholding generates binary segmentations. From this segmentation the skeleton was computed. To assess only small vessels (vessel diameter smaller than 2 voxels), the vesselness-filter’s response was used to prune the skeleton. Euclidian distance transform9 was applied to the pruned skeleton to generate arterial and venous vessel distance maps (see Fig.1). From these vessel distance maps average distances per ROI were computed. For comparison, ROI-based vessel densities were computed by dividing the number of detected vessel-voxel by the number of all voxels within the ROI. To elucidate the potential of VDM further, histograms of the distance distribution and average group patterns were computed.Results
Vessel densities and average distances for each ROI are summarized across all subjects in Fig. 2. In this study, more veins than arteries were detected, potentially because of the different sensitivity of the contrast mechanisms to small vessels. Hence, venous data returned overall lower average distances and higher densities compared to arterial data. Further, for most subjects, no arteries within the pallidum and caudate nucleus were detected, which results in density estimates of zero. In contrast, average distances still provided an intuition about the vessels in close proximity to the ROI. Consequently, the correlation of vessel densities and average distances was higher for venous than for arterial data (see Fig. 3). To show that VDM provides information beyond a single metric per ROI, histograms of the vessel distance distributions of all subjects are overlaid in Fig. 4. Overall, venous distance distributions appear more similar across subjects than arterial VDM distribution. Besides the quantitative comparison (in subject space), the data can be visualized in the study template space to compare vessel distance patterns and compute average group patterns (see Figure 5). Additionally, vessel segmentations of all subjects have been transformed to the template space and averaged to illustrate the overlap of the vascular patterns across subjects. For the segmentations, projections were used to enable sensible visualization of the sparse vessel patterns. Since VDM inherently interpolates the sparse vessel information, a single 2D slice was sufficient to visualize the vascular patterns within the ROI.Discussion
In this proof-of-principle study, VDM is introduced as a novel method to assess vasculature patterns qualitatively and quantitatively. Although, the small number of subjects prevents the generalization of the patterns and distances found, the advantages of this technique compared to state-of-the-art methods have been demonstrated. Since VDM and vessel densities are based on vessel segmentation, they correlate with each other to some extent and share the bias of being limited to only detected vessels (resolution dependency). Nevertheless, vessel densities compress all information into a single number, while VDM interpolates the sparse vessel information to every voxel. Even if no vessel is detected within the ROI, VDM considers vessels in the close proximity, an advantage for quantitative assessment and visualization. Further, distance distributions for individual vessel branches allow an in-depth analysis of vascular patterns with respect to surrounding anatomy (i.e. histograms, statistical moments) in the future.Conclusion
With VDM vascular patterns can be assessed qualitatively and quantitatively with respect to their surrounding structure.Acknowledgements
This work was funded by the DFG-MA 9235/1-1.References
1. Huck J, Wanner Y, Fan AP et al. High resolution atlas of the venous brain vasculature from 7 T quantitative susceptibility maps. Brain Struct Funct. 2019. doi: 10.1007/s00429-019-01919-4 .
2. Bernier M, Cunnane SC, Whittingstall K. The morphology of the human cerebrovascular system. Hum Brain Mapp. 2018. doi: 10.1002/hbm.24337 .
3. Tustison NJ, Avants BB, Cook PA, Zheng Y, Egan A, Yushkevich PA, Gee JC. N4ITK: improved N3 bias correction. IEEE Trans Med Imaging. 2010;29(6):1310–1320 doi: 10.1109/TMI.2010.2046908 .
4. Acosta-Cabronero J, Milovic C, Mattern H, Tejos C, Speck O, Callaghan MF. A robust multi-scale approach to quantitative susceptibility mapping. Neuroimage. 2018. doi: 10.1016/j.neuroimage.2018.07.065 .
5. Avants B, Epstein C, Grossman M, Gee J. Symmetric diffeomorphic image registration with cross-correlation: Evaluating automated labeling of elderly and neurodegenerative brain. Medical Image Analysis. 2008;12(1):26–41 doi: 10.1016/j.media.2007.06.004 .
6. Desikan RS, Ségonne F, Fischl B, et al. An automated labeling system for subdividing the human cerebral cortex on MRI scans into gyral based regions of interest. Neuroimage. 2006 Jul 1;31(3):968-80.
7. Jerman T, Pernus F, Likar B, Spiclin Z. Enhancement of Vascular Structures in 3D and 2D Angiographic Images. IEEE Transactions on Medical Imaging. 2016;35(9):2107–2118. doi: 10.1109/TMI.2016.2550102.
8. Openly available sMall vEsseL sEgmenTaTion pipeline (OMELETTE): https://gitlab.com/hmattern/omelette
9. Maurer CR, Qi R, Raghavan V. A linear time algorithm for computing exact Euclidean distance transforms of binary images in arbitrary dimensions. IEEE Trans. Pattern Anal. Mach. Intell. . 2003;25(2):265–270 doi: 10.1109/TPAMI.2003.1177156 .
Figures
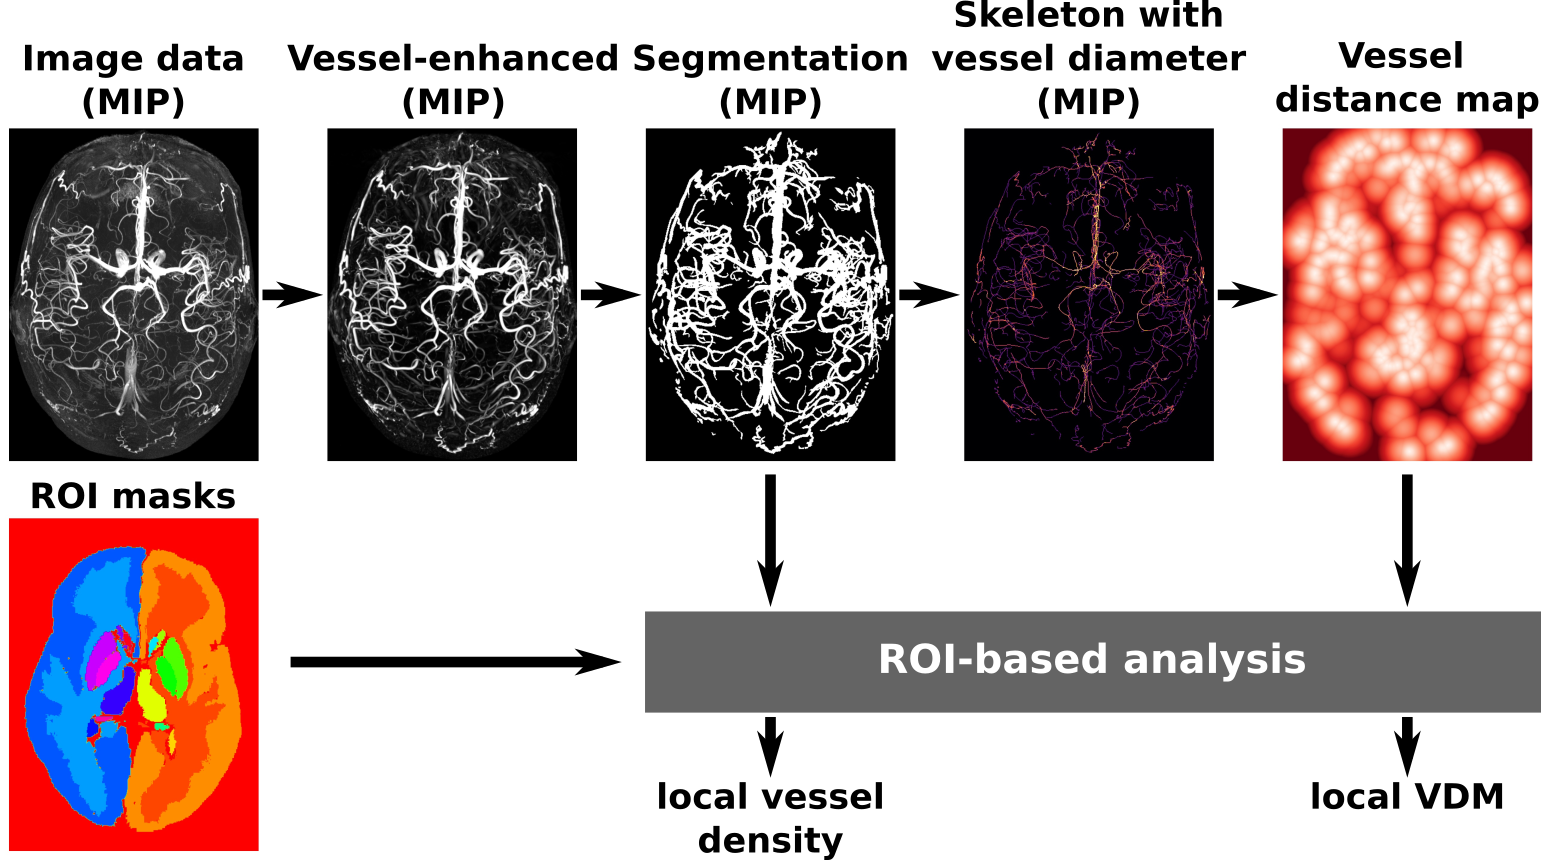
Figure 1: Data processing workflow: Image data and ROI masks are taken as inputs. Vessels are first enhanced and then segmented. After generating the skeleton, a vessel distance map can be computed by applying the Euclidian distance transform. Local vessel density and VDM estimates are computed from the segmentation and distance maps respectively.
MIP – Maximum Intensity Projection; ROI – Region of Interest; VDM – Vessel Distance Mapping
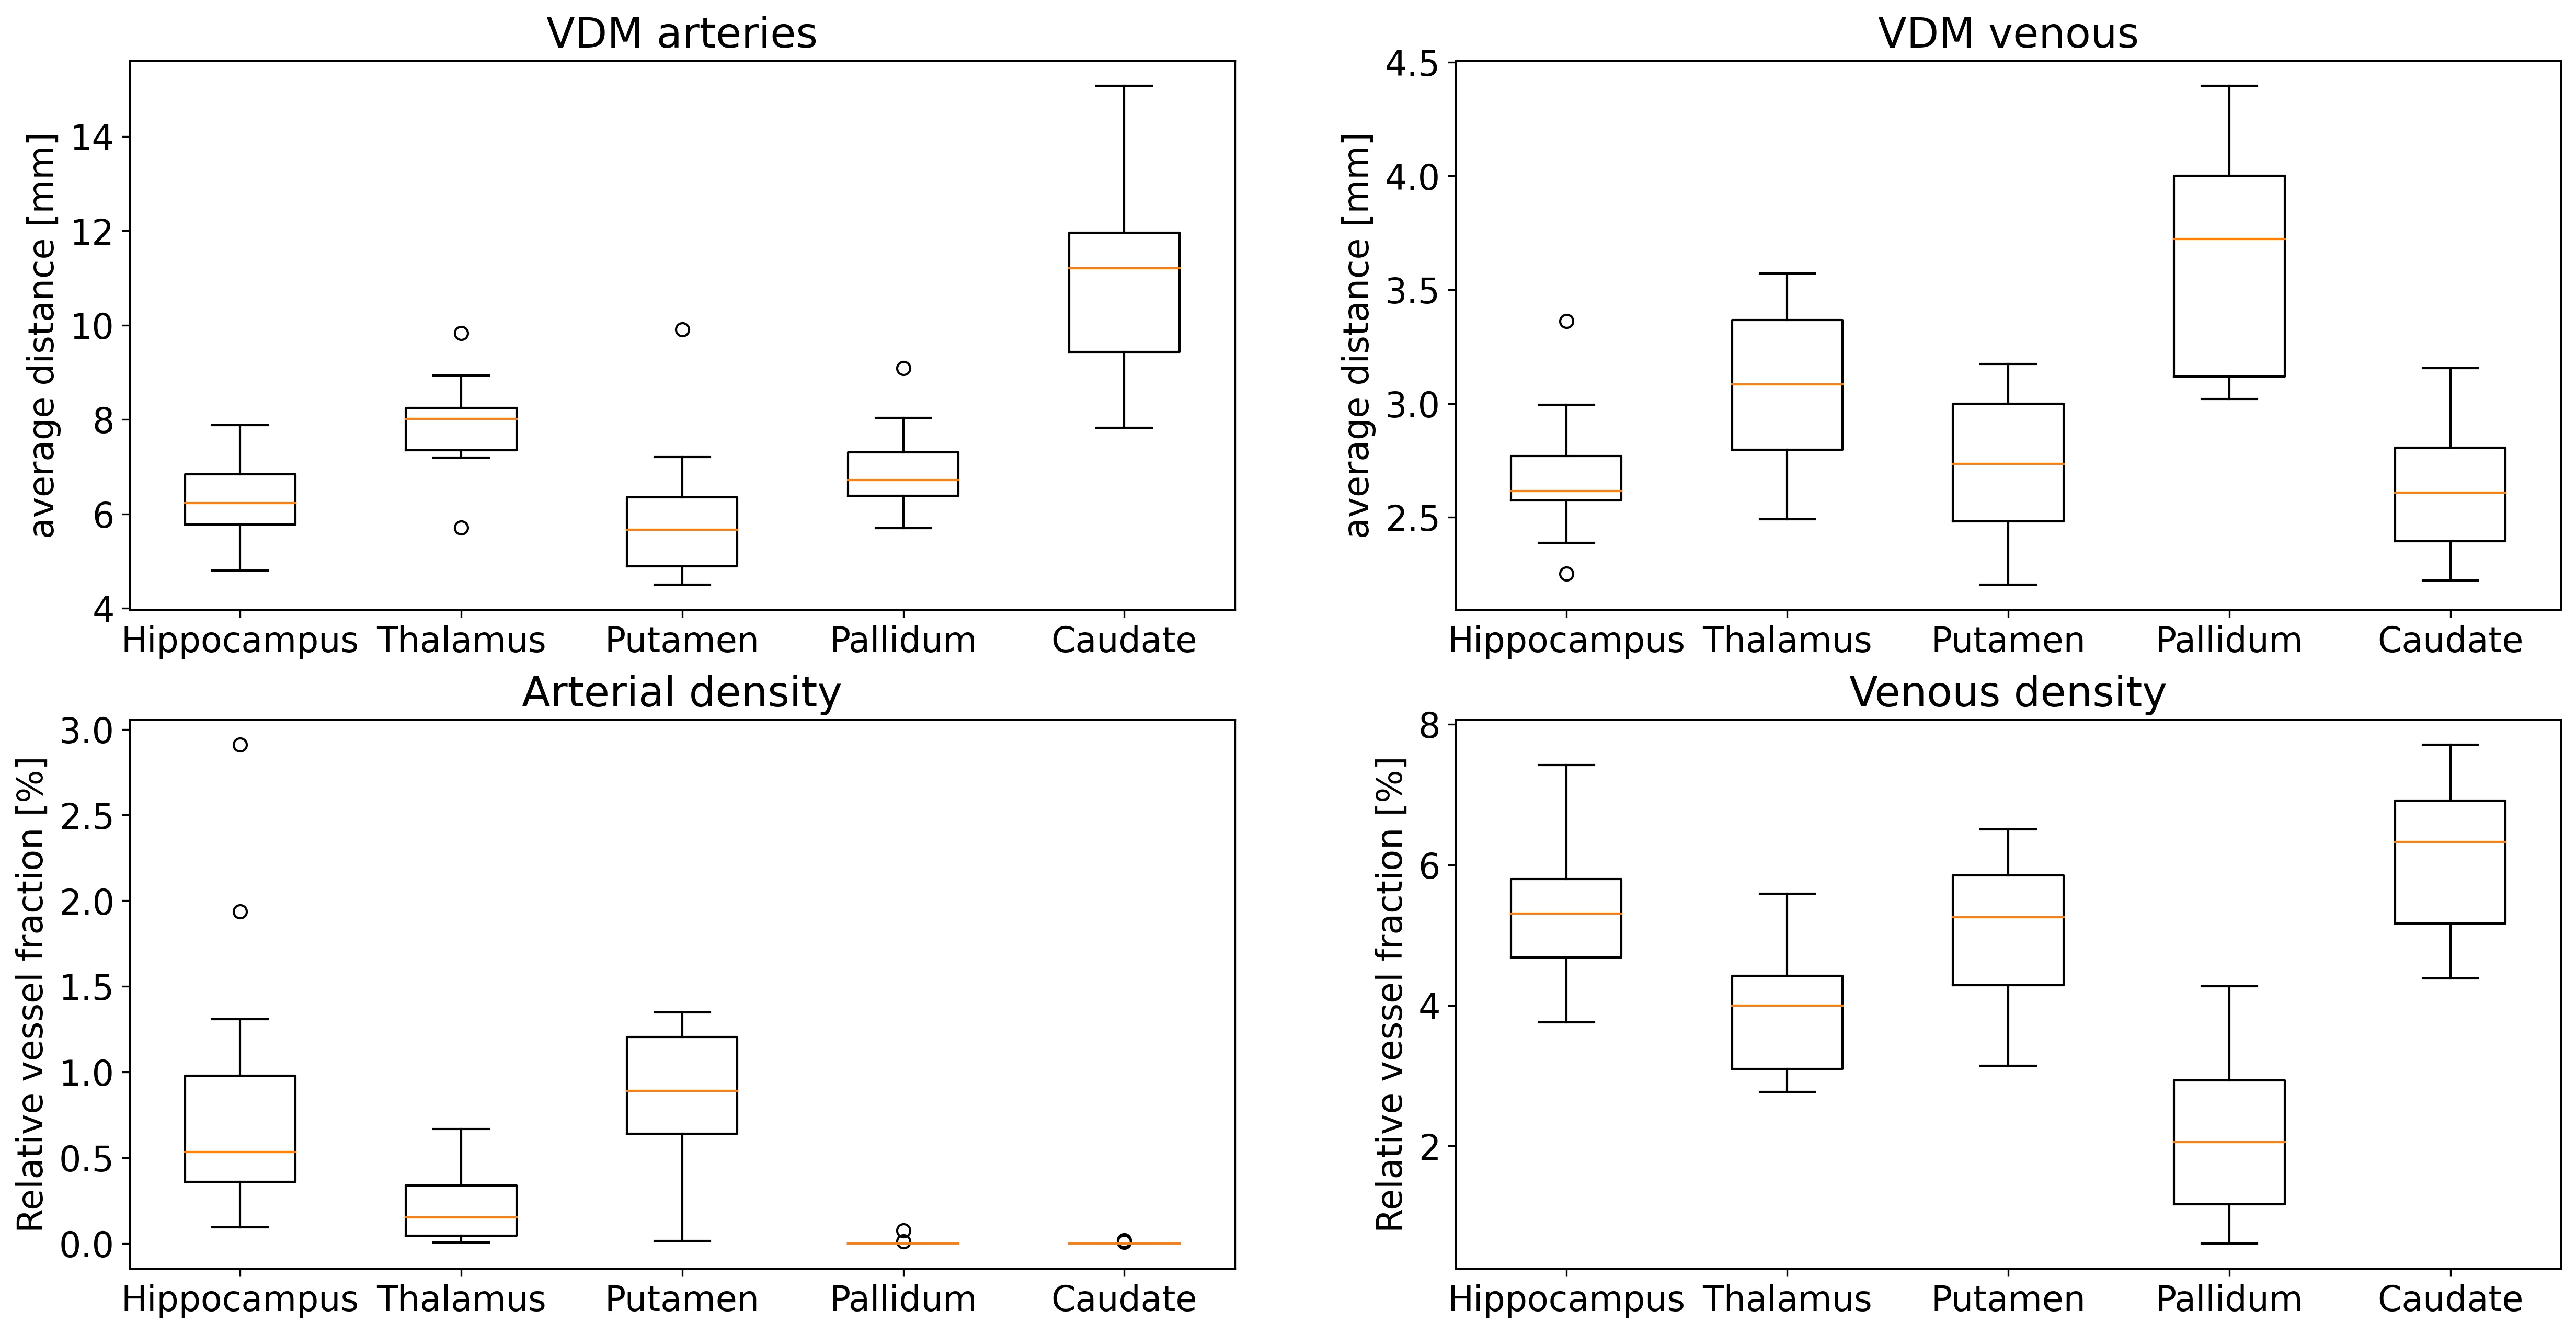
Figure 2: For each ROI, vessel densities and average distances are computed for arterial and venous data respectively. In general, more veins than arteries were detected, resulting in lower average distances and higher densities. For most subjects, no arteries were detected within the pallidum and caudate nucleus but close by. As a result arterial densities tend towards zero, while average distance still provides an intuition about the vessels in proximity to the ROI.
ROI – Region of Interest;
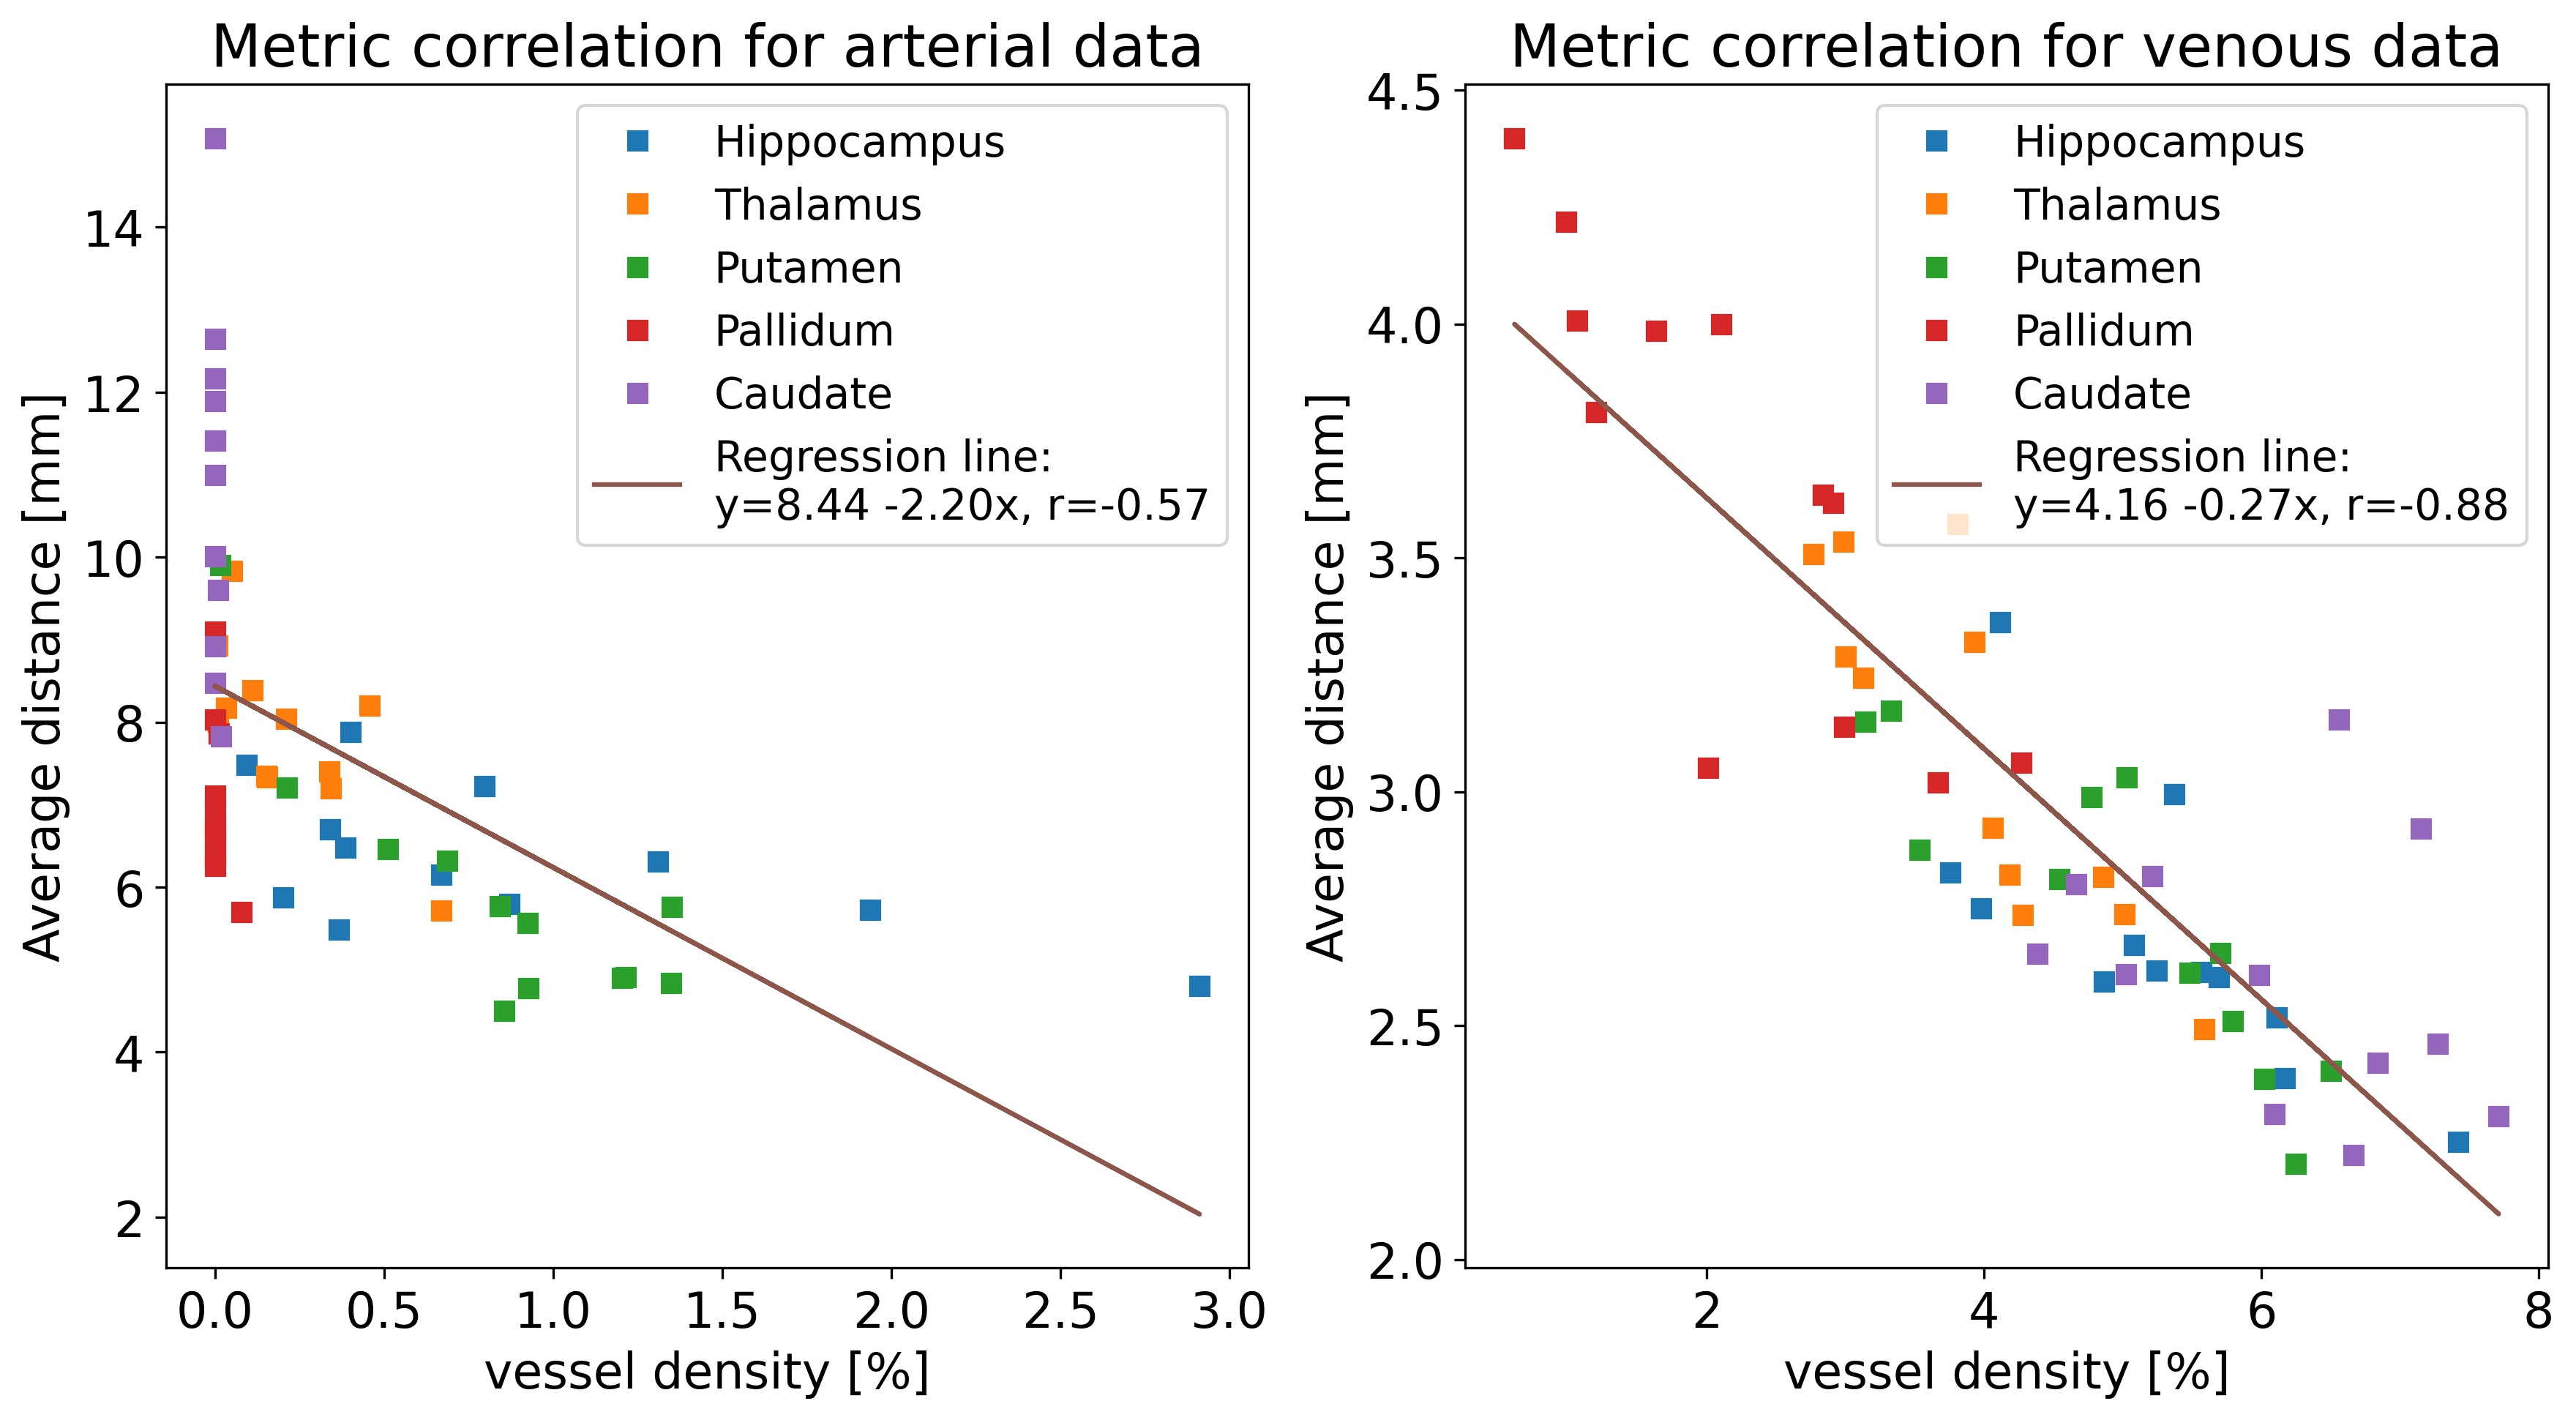
Figure 3: Correlation of vessel density and average vessel distance for venous and arterial data respectively. Data points for each ROI are color-coded. The correlation for venous data is higher than for arterial data because for most subjects no arteries were detected in the pallidum and caudate nucleus. The resulting zero vessel densities lower the correlation of both metrics.
ROI – Region of Interest;
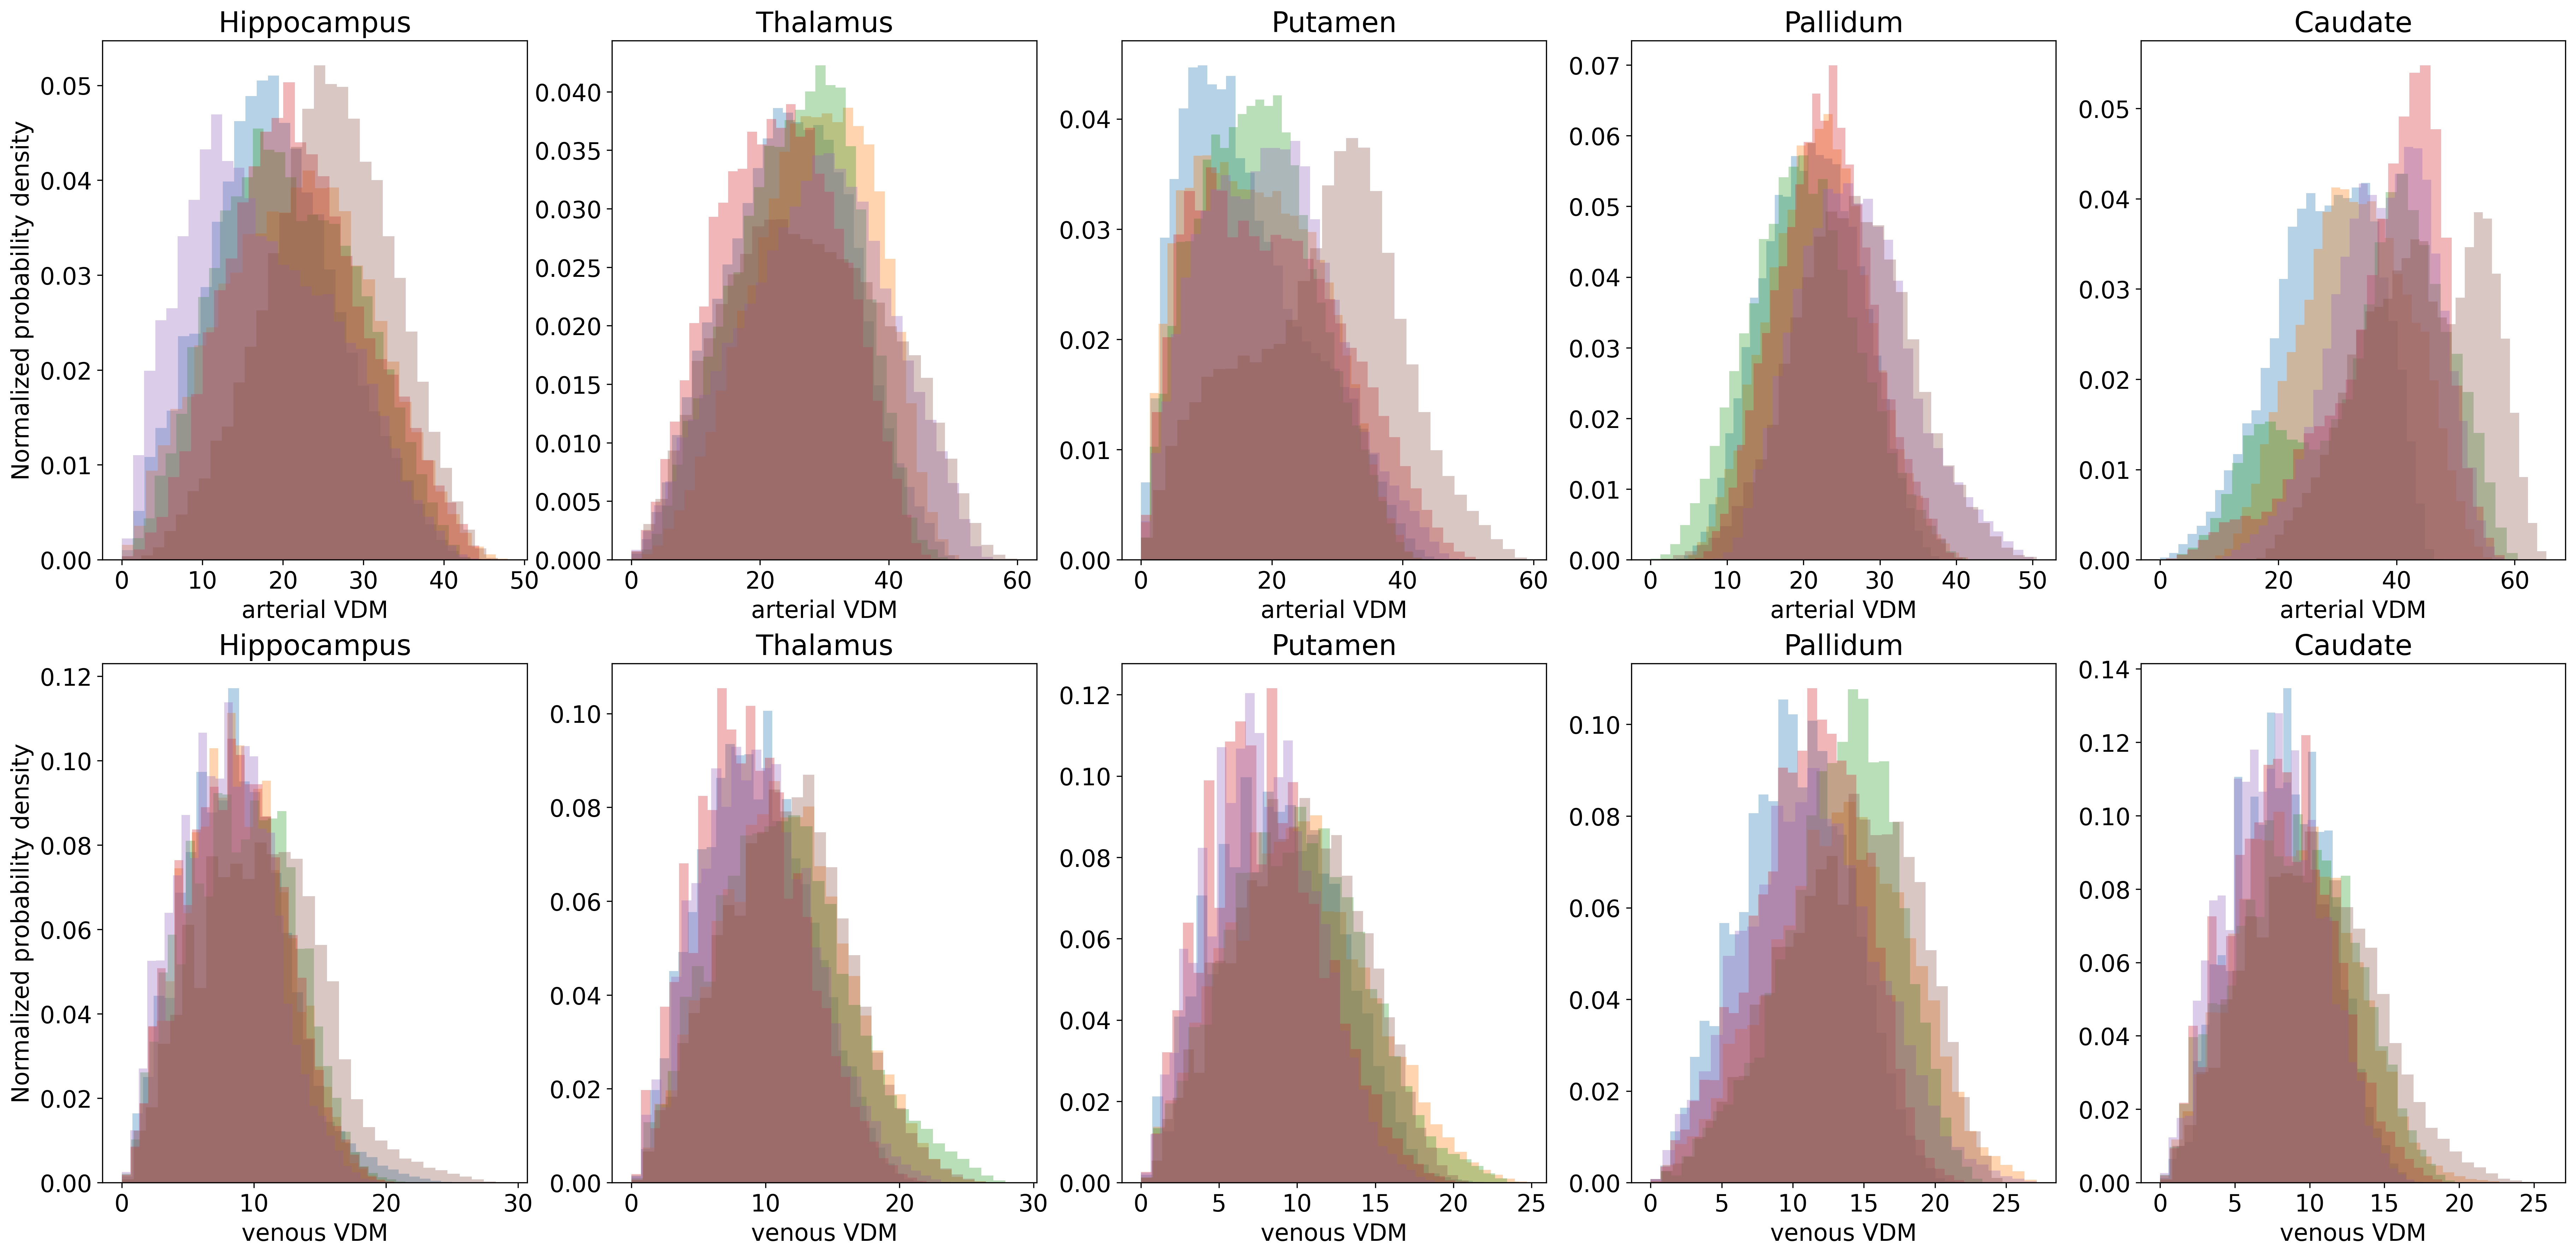
Figure 4: For each ROI, the vessel distance distribution of all subjects are overlaid. This proof-of-principle shows how distance distributions could be used as a novel method to analyze vessels with respect to their surrounding anatomical structure in the future. Note that this distribution analysis goes beyond the single-number vessel density approach.
ROI – Region of Interest;
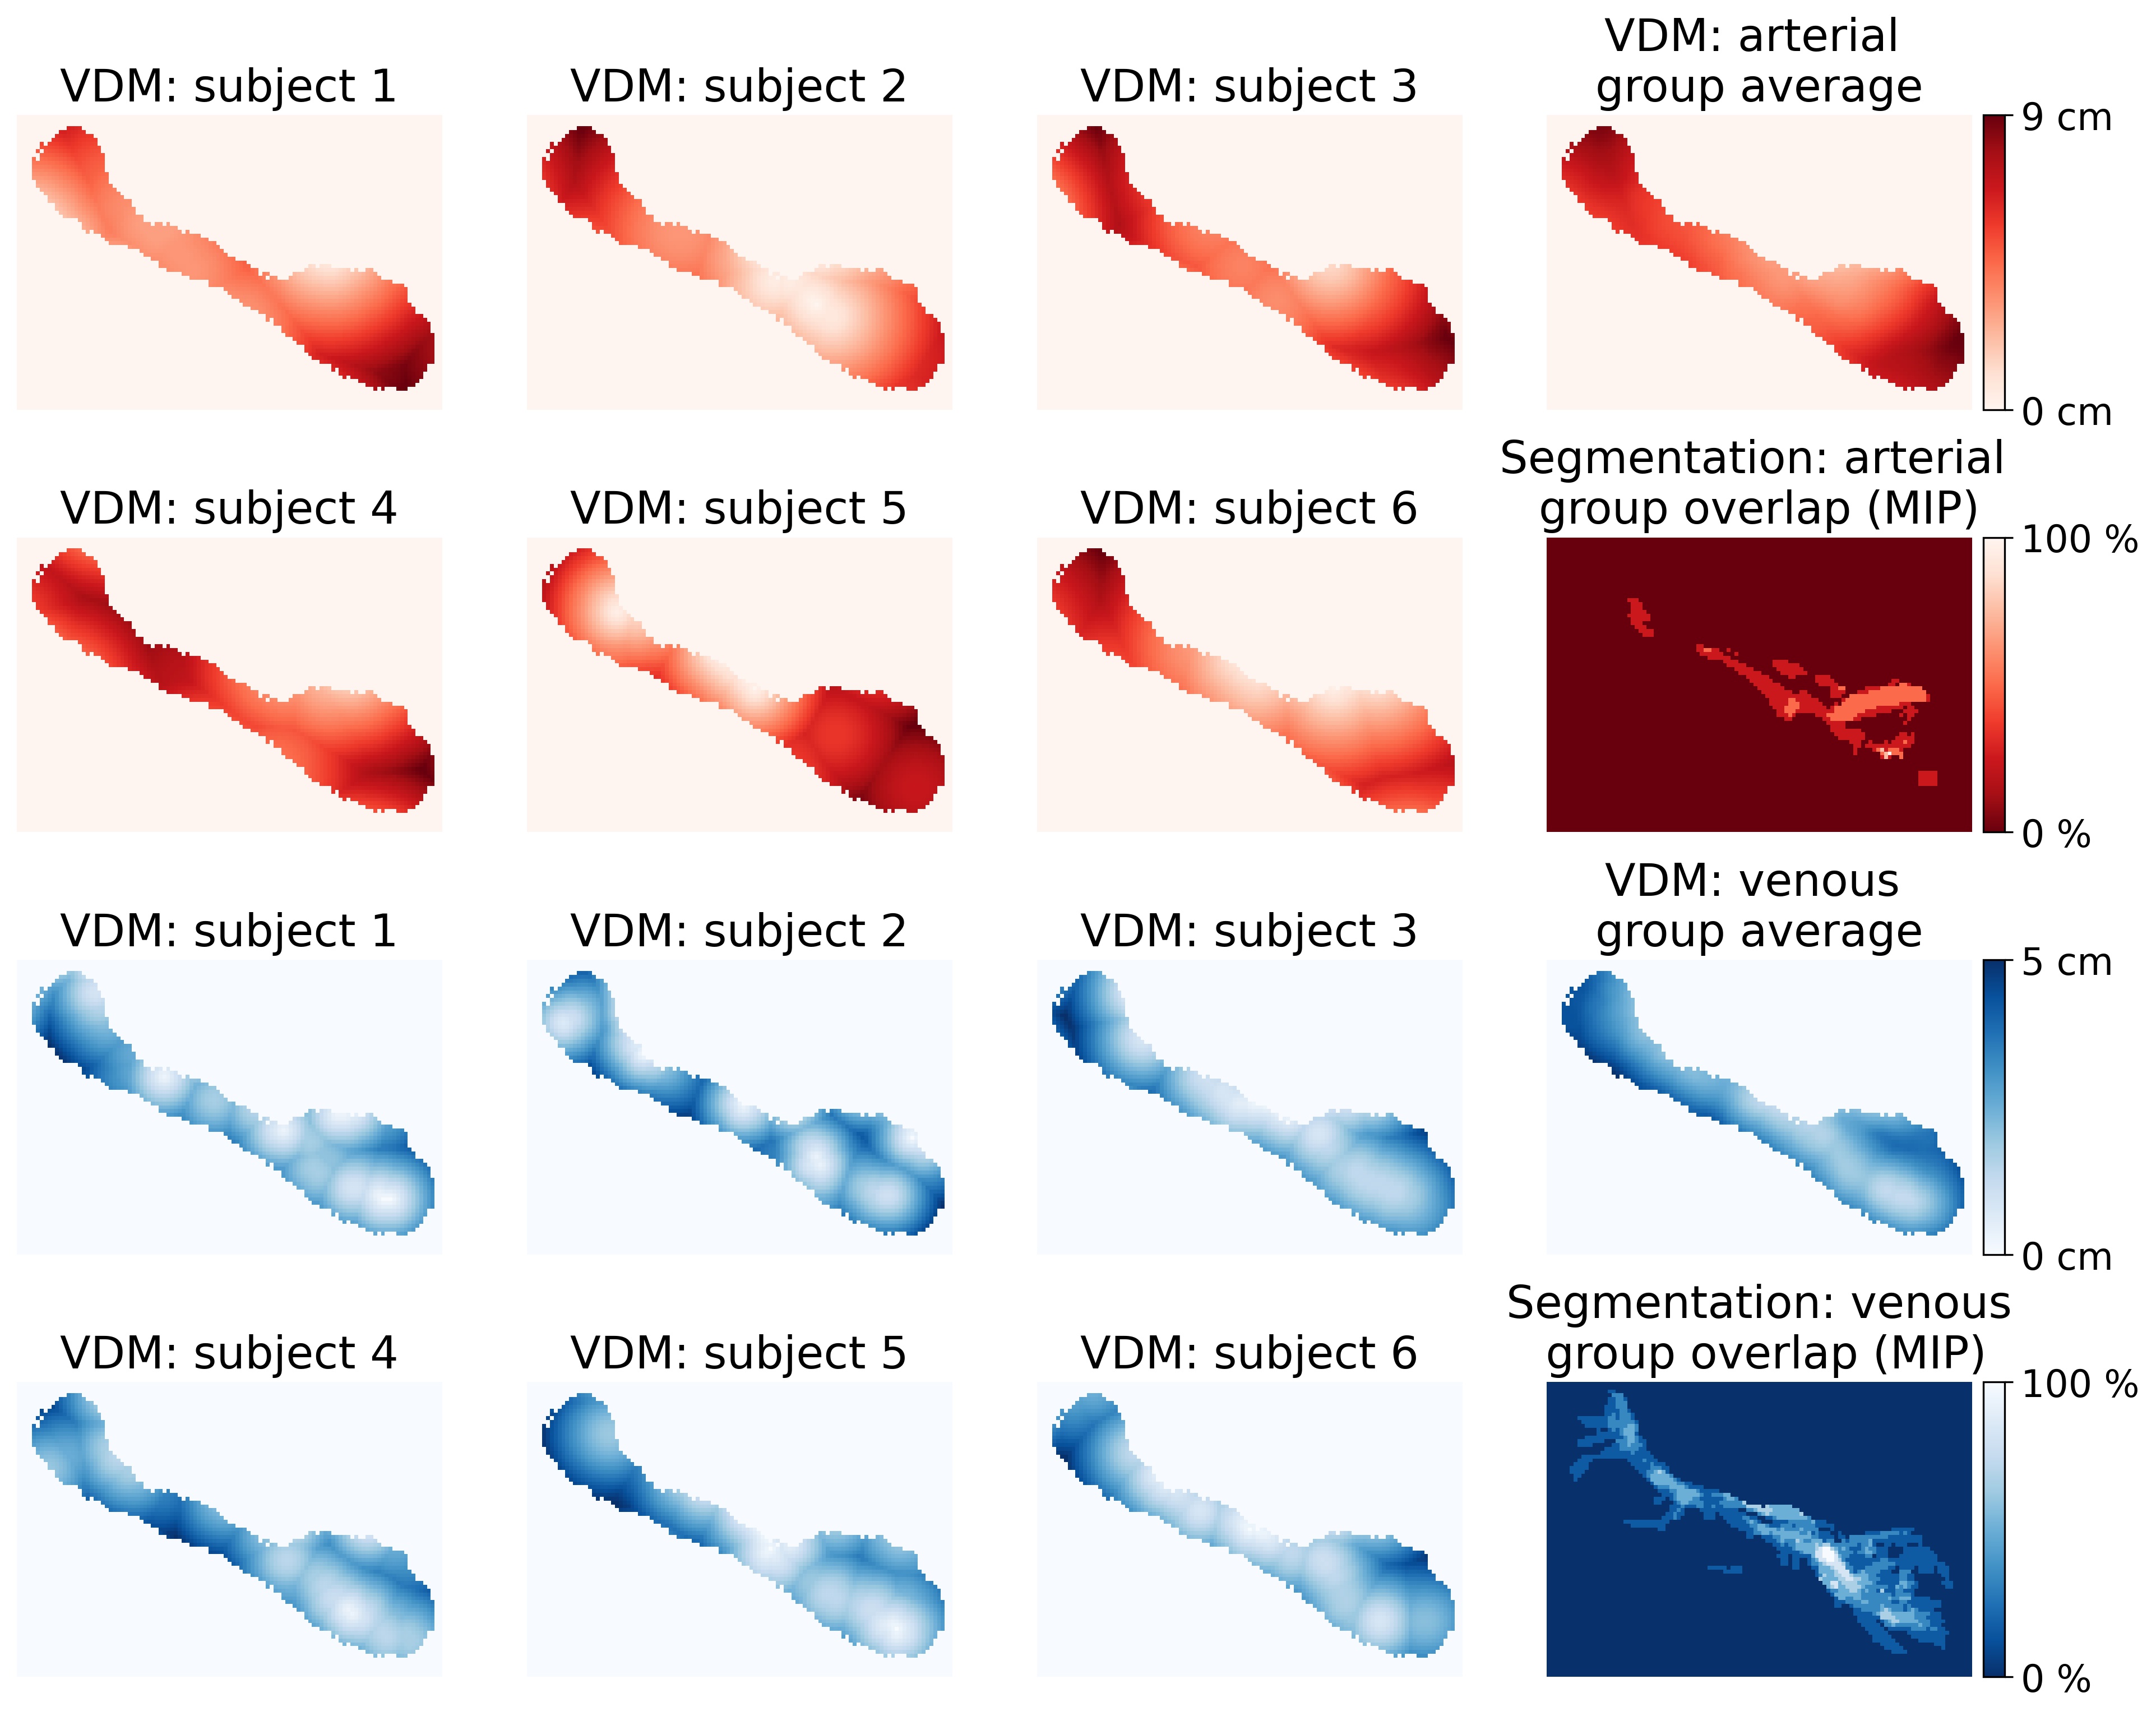
Figure 5: Arterial and venous distance maps of the left hippocampus (central slice shown). By co-registering all subjects to the study template space a group VDM average could be computed. For comparison, all segmentations have been averaged in the template space (shown as MIP) to show the overlap of the vascular patterns.
MIP – Maximum Intensity Projection; VDM – Vessel Distance Mapping