0827
Cerebrovascular relative pressure assessment using 4D Flow MRI – accuracy of image-based estimation approaches1Massachusetts Institute of Technology, Cambridge, MA, United States, 2University of Michigan, Ann Arbor, MI, United States, 3Northwestern University, Chicago, IL, United States, 4University of Auckland, Auckland, New Zealand, 5King's College London, London, United Kingdom, 6University of Greifswald, Greifswald, Germany
Synopsis
4D Flow MRI images cerebrovascular blood flow in-vivo, however, estimation of relative pressure is difficult due to the unique flow and anatomies found in the brain. We evaluated the performance of three different techniques (reduced Bernoulli (RB); unsteady Bernoulli (UB); virtual Work-Energy Relative Pressure (vWERP)) for cerebrovascular assessment. Using patient-specific in-silico models, we show that accurate estimations are dependent on sufficient spatial resolution (dx < 0.75 mm3) and used approach (vWERP achieving accurate estimates; RB/UB showing systematic underestimation bias). With similar dependencies indicated in-vivo, these results underline both potentials and challenges of mapping cerebrovascular relative pressure by 4D Flow MRI.
Introduction
Changes in regional blood pressure are indicated in a number of cerebrovascular disease1,2, and 4D Flow MRI allows for full-field capture of blood flow throughout the cerebrovasculature3. However, derivation of relative pressure from 4D Flow MRI is challenging as unique flow and anatomies preclude accurate translation of estimation techniques used in other cardiovascular domains. Though attempts have been made to assess cerebrovascular pressure changes4,5, a systematic evaluation of image-based techniques has yet to be performed. Therefore, the aim of this study was to investigate the accuracy of three different methods to assess cerebrovascular relative pressure from 4D Flow MRI data: the reduced Bernoulli (RB)6, the extended unsteady Bernoulli (UB)7, and the full-field virtual Work-Energy Relative Pressure (vWERP) method8.Methods
The three estimation approaches all originate from the Navier-Stokes equations, however, different assumptions on the assessed flow field are imposed when extracting relative pressure: RB assumes negligible transient and viscous effects and extracts estimates from peak velocity measurements6; UB includes transient effects but still reduces estimations to an integration line between estimated inlet and outlet7; vWERP does not impose any assumptions on the assessed flow, but rather transfers these onto an auxiliary virtual field introduced through a virtual work-energy evaluation8. As such, the three approaches can be expressed as$$
\Delta p_{RB}=\frac{1}{2}\rho(v_o^2-v_i^2 ); \quad \Delta p_{UB}=\frac{1}{2}\rho(v_o^2-v_i^2 )+\rho\int_i^o \frac{\partial \mathbf{v}}{\partial t} ds; \quad \Delta p_{\nu WERP}=-\frac{1}{Q_e} (\frac{\partial}{\partial t} K_e+A_e+V_e )
$$
where $$$\Delta p$$$ is the relative pressure estimate, $$$v_{i,o}$$$ is the velocity at inlet and outlet, $$$\mathbf{s}$$$ is an integration line connecting the inlet and outlet, $$$\rho$$$ is the fluid density, and $$$K_e$$$, $$$A_e$$$, $$$V_e$$$, and $$$Q_e$$$ are different virtual energy and flow components extracted during computation of vWERP8.
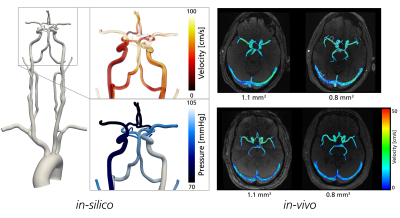
To study estimation accuracy in a controlled environment, synthetic 4D flow MRI images were simulated from a calibrated patient-specific computational fluid dynamics (CFD) model of the arterial cererbrovasculature (see Figure 1(left)). The model was created by reconstructing the anatomy from TOF-MRI and specifying patient-specific boundary conditions using a combination of phase-contrast-MRI and arterial spin labelling (ASL) to recover realistic flow and pressure fields9,10. Images were generated at increasing spatiotemporal resolution, covering dx = 0.25-1.0 mm3, and dt = 20-80 ms, respectively. In all models, relative pressures over the internal carotid artery (ICA), as well as over a transition into the middle cerebral artery (ICA-MCA) were estimated using RB, UB, and vWERP, respectively, and compared against reference CFD pressure data.
Furthermore, to evaluate spatial dependencies in-vivo, 4D Flow MRI (Siemens Magnotom Skyra, 3T, 20-channel head/neck coil, k-t GRAPPA accelerated dual venc (120/60 cm/s) sequence11) was collected from 8 healthy volunteers (see Figure 1(right)) at two different spatial resolutions: dx = 1.1 and 0.8 mm3. Cerebrovascular relative pressures were estimated over an ICA-MCA section using RB, UB, and vWERP, respectively.
Results
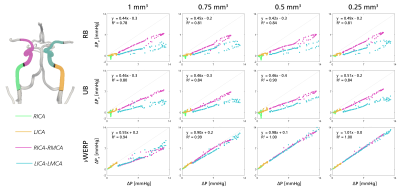
Figure 2 shows linear regression plots for in-silico relative pressures estimated from RB, UB, and vWERP, respectively, compared against reference relative pressure extracted from the CFD data. As shown, estimation accuracy was highly dependent on spatial resolution and estimation approach: at dx = 1.0 mm3, underestimation bias was apparent for all methods (regression coefficient k = 0.44, 0.46, and 0.55 for RB, UB, and vWERP, respectively). As resolution increased, vWERP accuracy increased (k = 0.98 at dx = 0.5 mm3), however, underestimation bias remained for RB and UB (k = 0.42 and 0.46 at dx = 0.5 mm3). Notably, the same dependency on resolution and approach was not observed with varying temporal sampling.No apparent correlation was observed between the in-vivo estimates at dx = 1.1 and 0.8 mm3 for RB or UB (k = 0.05 and 0.07, Fig. 3), whereas vWERP indicates stronger correlation as well as lower estimates extracted at lower resolutions (k = 0.52, Fig. 3).
Discussion
Based on calibrated in-silico data, vWERP provides the most accurate estimates of cerebrovascular relative pressure, overcoming the underestimation bias observed in RB and UB. Evidently, assumptions used in RB and UB do not translate well into the evaluated cerebrovascular flows. Further, correlative trends between estimates and true relative pressures varies over different vascular sections (Fig. 2), making their use for diagnostic purposes non-trivial. While vWERP avoids any flow field assumptions, it is still impacted by spatial resolution: at dx = 1 mm3, vWERP exhibited underestimation bias, indicating that spatial flow and velocity gradients are not sufficiently captured through the tortuous vasculature. The correlation between 1.1 and 0.8 mm3 data in-vivo also corroborates the clinical plausibility of these findings. High-Tesla acquisition12 or super-resolution imaging13 could represent practical solutions for quantitative cerebrovascular 4D Flow MRI in the near-future. Emphasis should still be made on spatial resolution when probing cerebrovascular hemodynamics. Work remains on in-vivo validation and clinical evaluation of our results, however, our study underlines both opportunities and challenges associated with quantitative cerebrovascular 4D Flow MRI.Conclusion
Accurate estimates of cerebrovascular relative pressure can be achieved by 4D Flow MRI. However, output is strongly dependent on image resolution (dx < 0.75 mm3 indicated through the circle of Willis) and estimation approach (vWERP outperforming alternative Bernoulli-methods). With similar indications observed in-vivo, clinical implications are highlighted, with our data clarifying both possibilities and challenges associated with image-based cerebrovascular relative pressure mapping.Acknowledgements
No acknowledgement found.References
1. Leng X, Wong KS, Liebeskind DS. Evaluating intracranial atherosclerosis rather than intracranial stenosis. Stroke. 2014:45:645-651
2. Penn DL, Komotar RJ, Connolly ES. Hemodynamic mechanisms underlying cerebral aneurysm pathogenesis. J Clinical Neuroscience. 2011:18:1435-1438
3. Stankovic Z, Allen BD, Garcia J, Jarvis KB, Markl M. 4D flow imaging with MRI. Cardiovascular diagnosis and therapy. 2014:173
4. Rivera-Rivera LA, Johnson KM, Wieben O. Pressure mapping and hemodynamic assessment of intracranial dural sinuses and dural arteriovenous fistulas with 4D flow MRI. Am J Neuroradiology. 2018:39:485-487
5. Vali A, Aristova M, Vakil P, et al. Semi-automated analysis of 4D flow MRI to assess the hemodynamic impact of intracranial atherosclerotic disease. Magn Res Med. 2019:82:749-762
6. Stamm RB, Martin RP. Quantification of pressure gradients across stenotic valves by Doppler ultrasound. JACC. 1983:707-718
7. Firstenberg MS, Vandervoort PM, Greenberg NL, et. al. Noninvasive estimation of transmitral pressure drop across the normal mitral valve in humans: importance of convective and inertial forces during left ventricular filling. JACC. 2000:36:1942-1949
8. Marlevi D, Ruijsink B, Balmus M, Dillon-Murphy D, Fovargue D et al. Non-invasive pressure estimations by virtual fields – cardiovascular pressure drops from 4D flow MRI. ISMRM 2018, Paris, France.
9. Schollenberger J, Hernandez-Garcia L, Figueroa CA. Calibration of patient-specific computational models of cerebral blood flow in cerebrovascular disease using arterial spin labeling. ISMRM, 2020
10. Schollenberger J, Osborne NH, Hernandez-Garcia L, Figueroa CA. A combined computational fluid dynamics and MRI arterial spin labeling modeling strategy to quantify patient-specific cererbal hemodynamics in cerebrovascular occlusive disease. in-preparation
11. Schnell S, Ansari A, Wu C, et al. Accelarated dual-venc 4D flow MRI for neurovascular applications. JMRI. 2017:46:102-114
12. Gottwald L, Töger J, Block KM, et al. High spatiotemporal resolution 4D flow MRI of intracranial aneurysms at 7T in 10 minutes. Am J Neuroradiology. 2020:41:1201-1208
13. Ferdian E, Suinesiaputra A, Dubowitz DJ et al. 4DFlowNet: Super-resolution 4D Flow MRI using deep learning and computational fluid dynamics. Frontiers in Physics. 2020:8:138
Figures


