0822
Characterization of motion-induced phase errors in prostate DWI1Technical University of Munich, Munich, Germany, 2Department of Diagnostic and Interventional Radiology, Technical University of Munich, Munich, Germany, 3Philips Healthcare, Hamburg, Germany, 4Philips Healthcare, Best, Netherlands
Synopsis
In order to improve resolution without increasing geometric distortions, there is an ongoing interest in multi-shot DWI in the prostate due to the high clinical significance of prostate DWI for tumor staging and therapy monitoring. However, intershot phase variations require phase error estimation and correction to reconstruct the multi-shot DWI data. Since free-breathing scans are normally used in prostate DWI, respiratory motion can be a significant source of phase errors in the prostate. The present work aims to characterize and investigate the link between respiratory motion and phase errors in the prostate.
Purpose
Diffusion weighted imaging (DWI) remains a valuable tool for lesion detection in the prostate and there is an ongoing interest in ADC mapping for tumor staging and therapy monitoring1. The current clinical standard is to use a diffusion-weighted spin echo sequence with a single shot echo planar imaging (ss-EPI) readout. There is also an ongoing interest in using a multi-shot EPI readout due to its higher phase encoding bandwidth and shorter echo time. Multi-shot EPI reduces the sensitivity to geometric distortions at higher spatial resolutions. To reconstruct multi-shot DWI data, motion-induced phase inconsistencies between shots need to be estimated and corrected2. Most existing multi-shot DWI sequences rely on a trailing navigator at the end of the readout in order to make a low-resolution estimate of the phase errors3. Understanding the characteristics of the phase errors is beneficial in optimizing the navigator for a robust phase error estimation and hence robust multi-shot image reconstruction. Since it is standard procedure to perform a free breathing scan when doing DWI in the prostate, one potential source of intershot phase variation is motion induced by patient respiration5. The present work characterizes the phase errors in the prostate and examines the link between DWI phase errors and respiratory motion.Methods
MR MeasurementsA single slice dynamic DWI scan was performed at a b-value of 200 s/mm2, with voxel size = $$$2.5\,x\,3\,x\,10$$$mm3, FOV = $$$160\,x\,160$$$mm2, TE = 52ms and TR = 300ms. 800 dynamics were acquired for a total scan time of 4 minutes 2 seconds. The dynamic DWI scans were performed for 3 orthogonal diffusion encoding directions separately, corresponding to the S/I, A/P and R/L directions in the patient coordinate system, and were repeated for axial and coronal slices. The breathing signal from the respiratory belt was recorded in synchronization with each dynamic scan. Four healthy volunteers were scanned on a 3T Philips Ingenia Elition scanner using the 16-channel torso coil and the built-in-table 12-channel posterior coil.
Data processing pipeline
The time points at which each dynamic was acquired were synchronized with the breathing signal of the volunteer. The breathing signal was then rescaled by making all peaks of the inhale period equal to 1 and all valleys of the exhale period equal to -1. An ROI was drawn over the prostate, and since each scan was single slice, the same ROI was used for each dynamic.
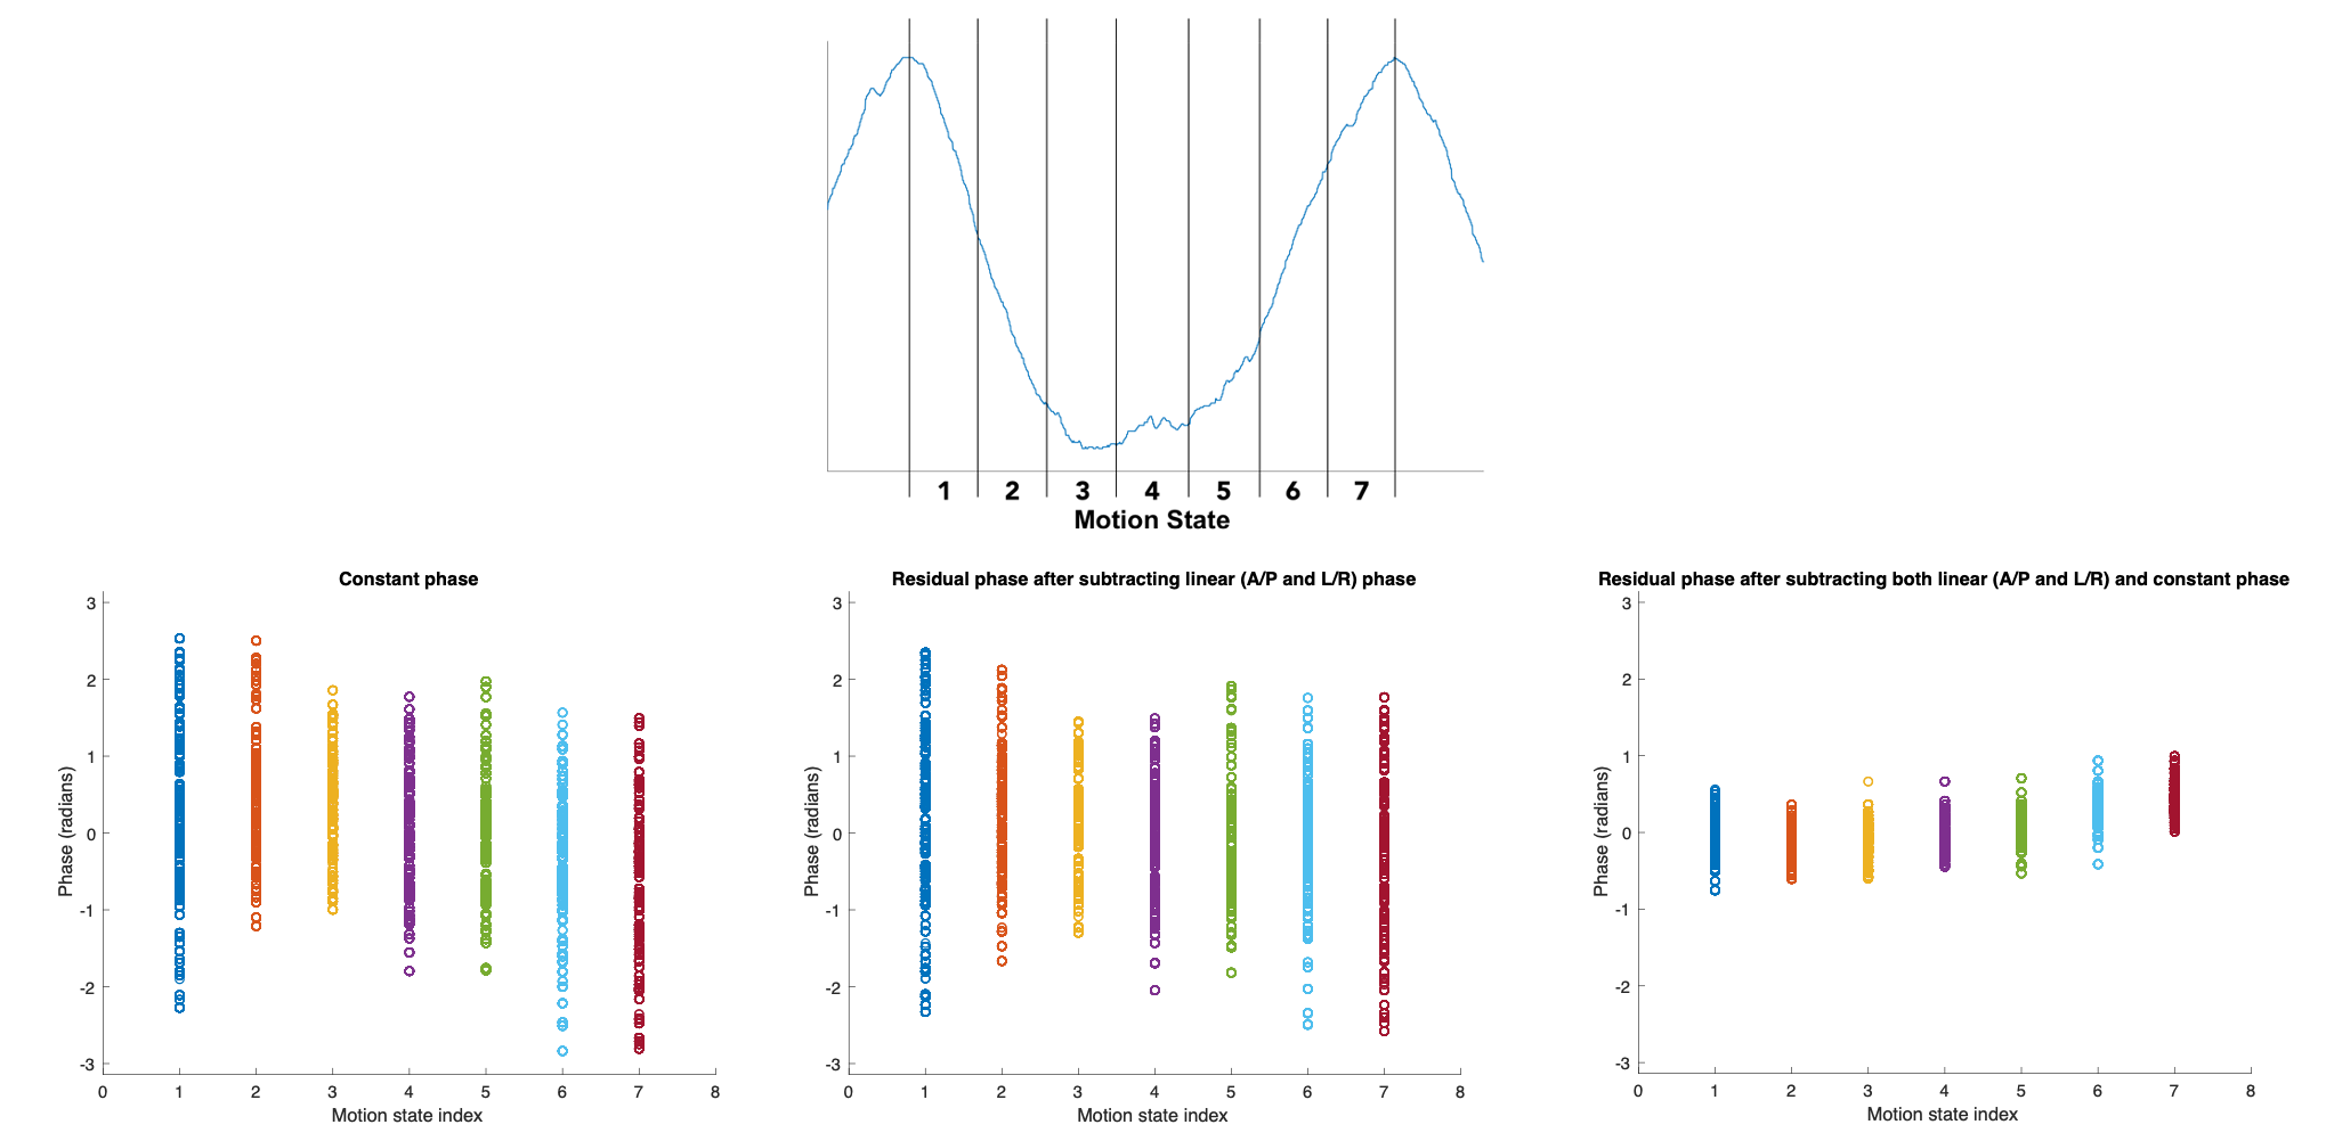
We approximated the phases over the prostate with spatially linear functions and investigated if the approximated offsets and the slopes correlated with the respiratory signals. The offset (constant) phase was estimated by taking the phase of the complex average of the signal over the ROI. The slope (linear phase) was estimated in each in plane direction by performing a linear fit on the phase within the prostate ROI for each column and row. For each instance of the dynamic scan, the overall linear phase was found by taking the mean of the slopes from each linear fit for all columns or rows. The residual phase was found by subtracting the linear and constant phase terms. The time series of the constant, linear, and residual phases were then split into 7 motion states, which were defined by dividing each breathing cycle into 7 temporally equally distributed bins, starting at maximal inhaled position. Power spectra were then found by performing a Fourier analysis on the phase variations for each dynamic over time.
Results
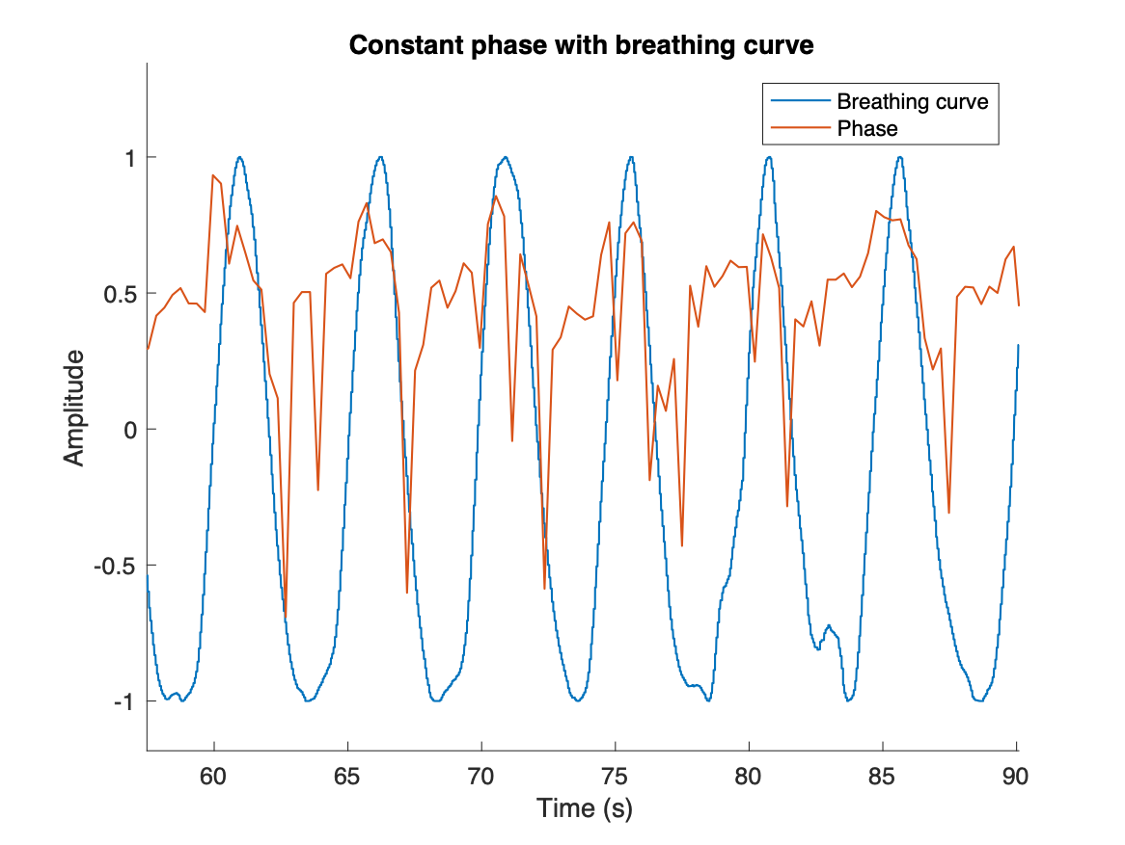
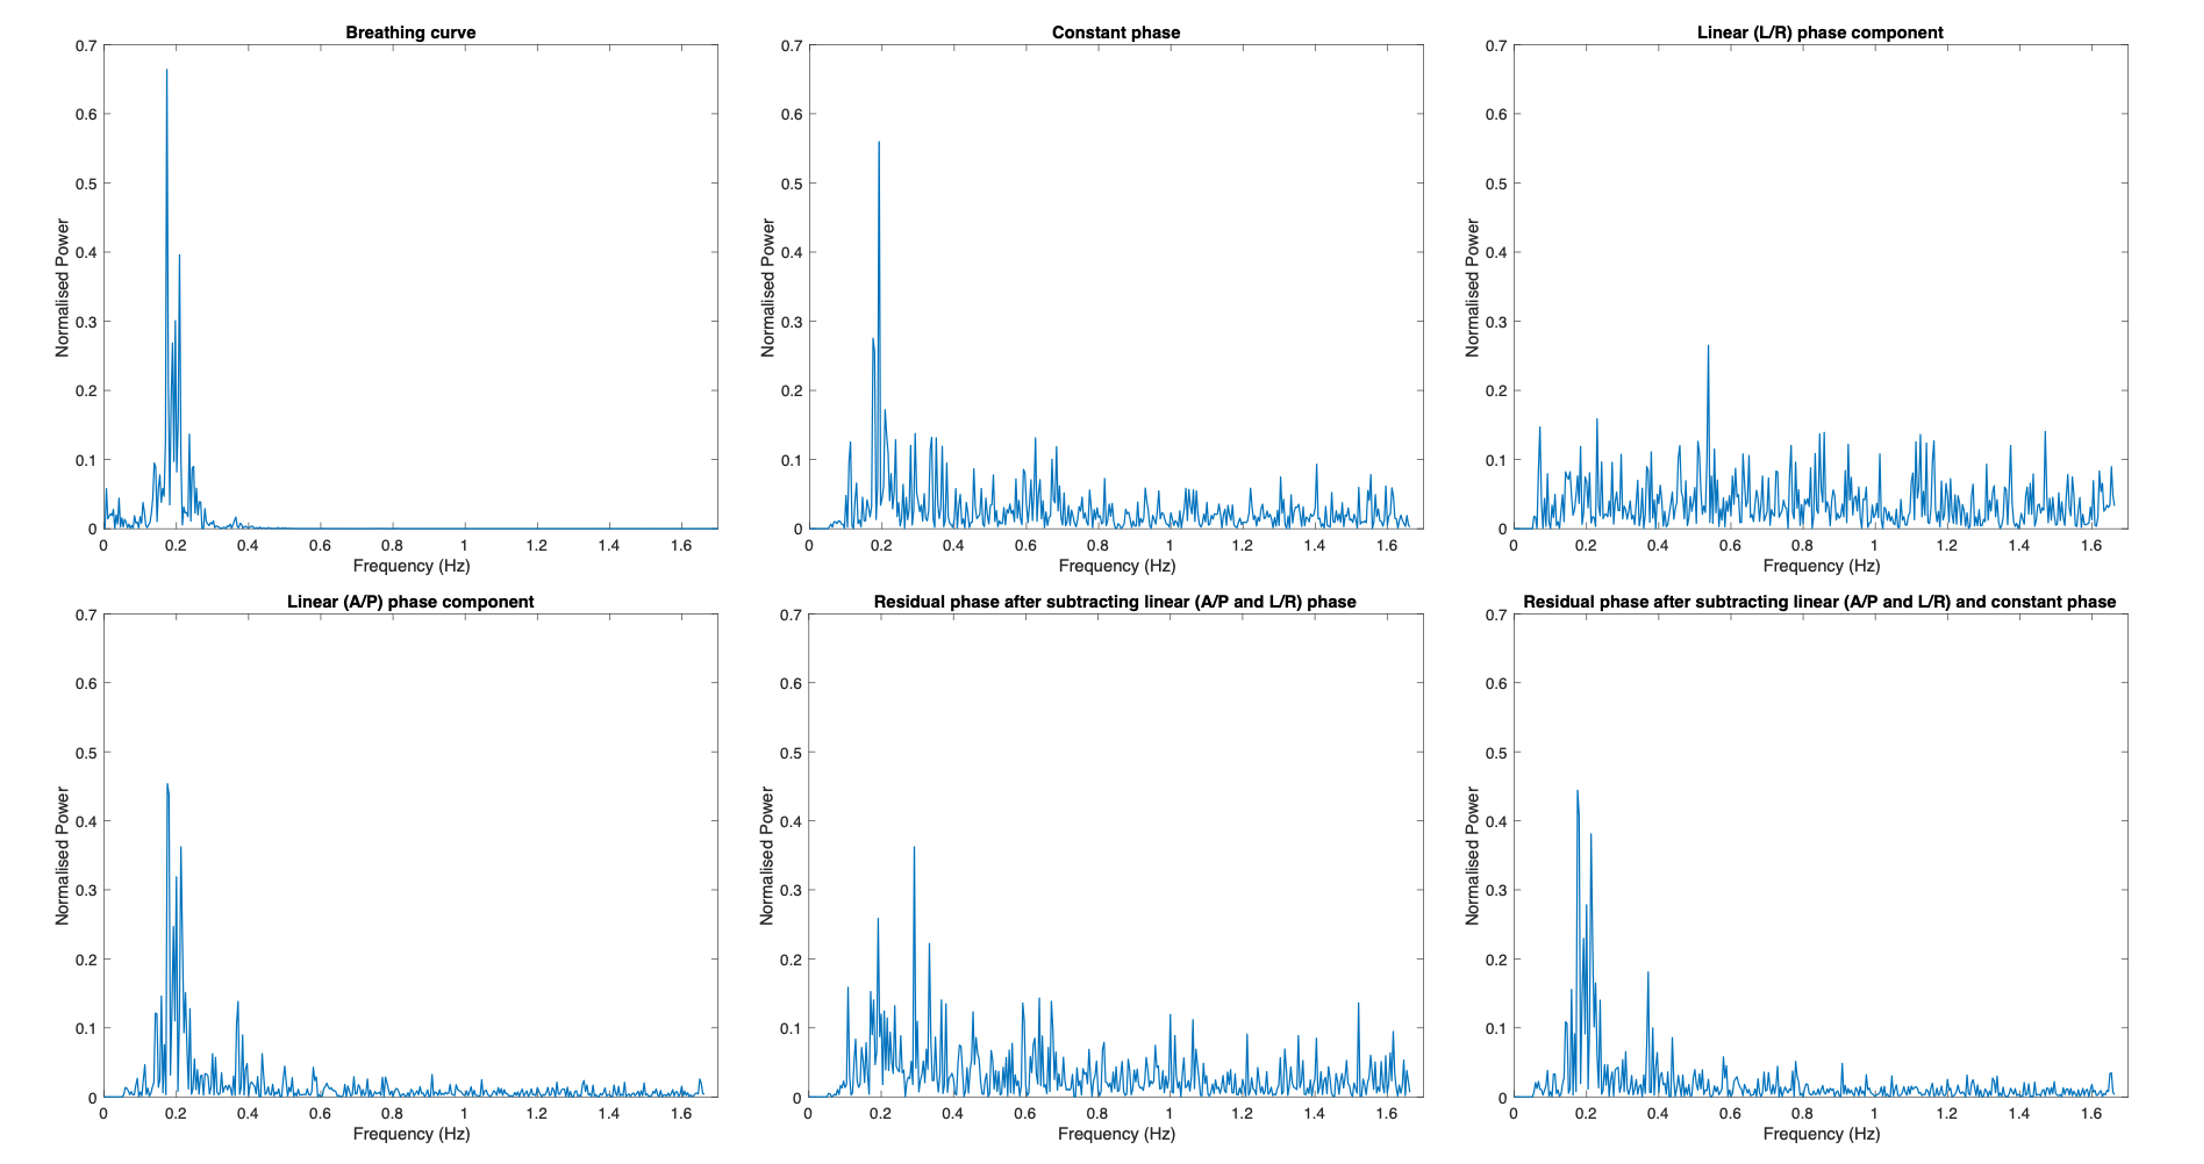
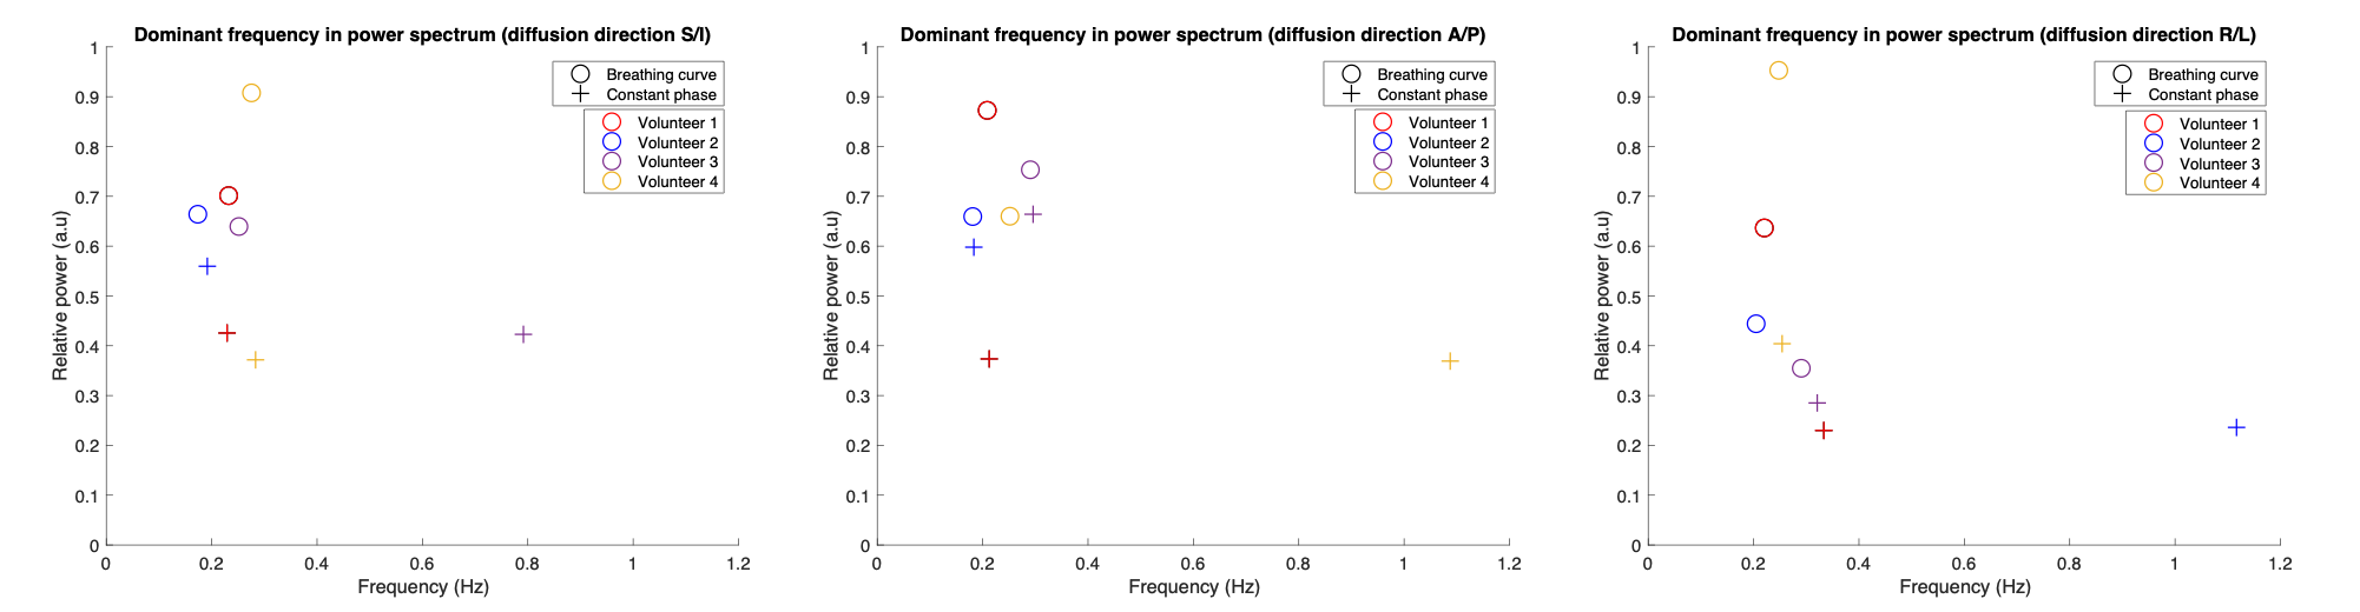
Figure 1 shows a real-time cine imaging acquisition. It can be seen that as the subject breathes, the prostate also moves by a small amount especially in the feet/head direction. Figure 2 shows the rescaled constant phase plotted alongside the rescaled breathing curve. The phase varies approximately periodically in synchronization with the breathing curve. Figure 3 shows power spectra of the different phase types. The constant, linear and residual phases have peaks at similar frequencies to the breathing curve. Figure 4 shows the motion states for different phase types. The constant phase shows some difference in terms of spread and average position of each motion state. After subtraction of the linear and constant phases from the image phase, the residual phase is small, varying in the range [-0.5, 0.5] rad in some motion states. Figure 5 shows the dominant frequency component and relative power for the breathing curve and the constant phase for each volunteer for each diffusion direction. Most of the dominant frequency components in the constant phase are close to that of the breathing curve.Discussion & Conclusion
The phase variation of the prostate over time appears to be periodic and synchronized with the breathing motion of the subject, suggesting that respiratory motion is a large source of phase error within the prostate. Small residual phases after the subtraction of the image phases with estimated linear and constant phase terms indicates that the phase errors over the prostate can be simplified to spatially linear functions. Although the linear phase also varies periodically, the magnitude of this variation is small in comparison to the constant phase, suggesting the possibility of only constant phase approximation of the motion-induced phase error.Acknowledgements
The present work was supported by Philips Healthcare.References
1. Hassanzadeh E, Glazer DI, Dunne RM, Fennessy FM, Harisinghani MG, Tempany CM. Prostate imaging reporting and data system version 2 (PI-RADS v2): a pictorial review. Abdom Radiol (NY) 2017;42(1):278-289.
2. Anderson AW, Gore JC. Analysis and correction of motion artifacts in diffusion weighted imaging. Magn Reson Med 1994;32(3):379-387.
3. Wu W, Miller KL. Image formation in diffusion MRI: A review of recent technical developments. J Magn Reson Imaging 2017;46(3):646-662.
4. Van AT, Hernando D, Sutton BP. Motion-induced phase error estimation and correction in 3D diffusion tensor imaging. IEEE Trans Med Imaging 2011;30(11):1933-1940.
5. Ghilezan MJ, Jaffray DA, Siewerdsen JH, Van Herk M, Shetty A, Sharpe MB, Zafar Jafri S, Vicini FA, Matter RC, Brabbins DS, Martinez AA. Prostate gland motion assessed with cine-magnetic resonance imaging (cine-MRI). Int J Radiat Oncol Biol Phys 2005;62(2):406-417.
Figures