0821
Accelerated Diffusion-Relaxation Correlation Spectrum Imaging (DR-CSI) for Ex Vivo and In Vivo Prostate Microstructure Mapping1Department of Radiological Sciences, UCLA, Los Angeles, CA, United States, 2Department of Urology, UCLA, Los Angeles, CA, United States, 3Department of Pathology, UCLA, Los Angeles, CA, United States
Synopsis
Diffusion-relaxation correlation spectrum imaging (DR-CSI) can map prostate microstructure in both ex vivo and in vivo imaging. However, the translation of prostate DR-CSI to in vivo applications faces technical challenges regarding trade-offs between scan time and accuracy. The goal of this study was to develop a data-driven systematic framework to evaluate and select subsampled DR-CSI echo time and b-values encoding schemes that reduce scan time while maintaining accuracy of estimated prostate microstructure parameters.
Introduction
Microstructural MRI holds promise to improve prostate cancer (PCa) diagnosis and characterization1-3. Recently, diffusion-relaxation correlation spectrum imaging (DR-CSI) has demonstrated the ability to map prostate microstructure in both ex vivo and in vivo imaging4-5. DR-CSI acquires different combinations of echo time (TE) and b-values to calculate voxel-wise T2-diffusion (T2-D) spectra and signal component fractions (fA, fB, fC)6, which correlate with whole-mount digital histopathology (WMHP) measurements of epithelium, stroma, and lumen4.The translation of prostate DR-CSI to in vivo applications faces technical challenges regarding trade-offs between scan time and accuracy. To ensure accurate quantification of prostate microstructure parameters, e.g. fA for predicting epithelial changes and PCa, multiple TE-b encodings (e.g. >10), and averaging to maintain signal-to-noise ratios (SNR) at long TE or high b-values, are required1,3. This increases scan time and sensitivity to motion-induced errors.
The goal of this study is to develop a data-driven systematic framework to evaluate and select subsampled DR-CSI TE-b encoding schemes that reduce scan time while maintaining accuracy of estimated prostate microstructure parameters.
Theory and Methods
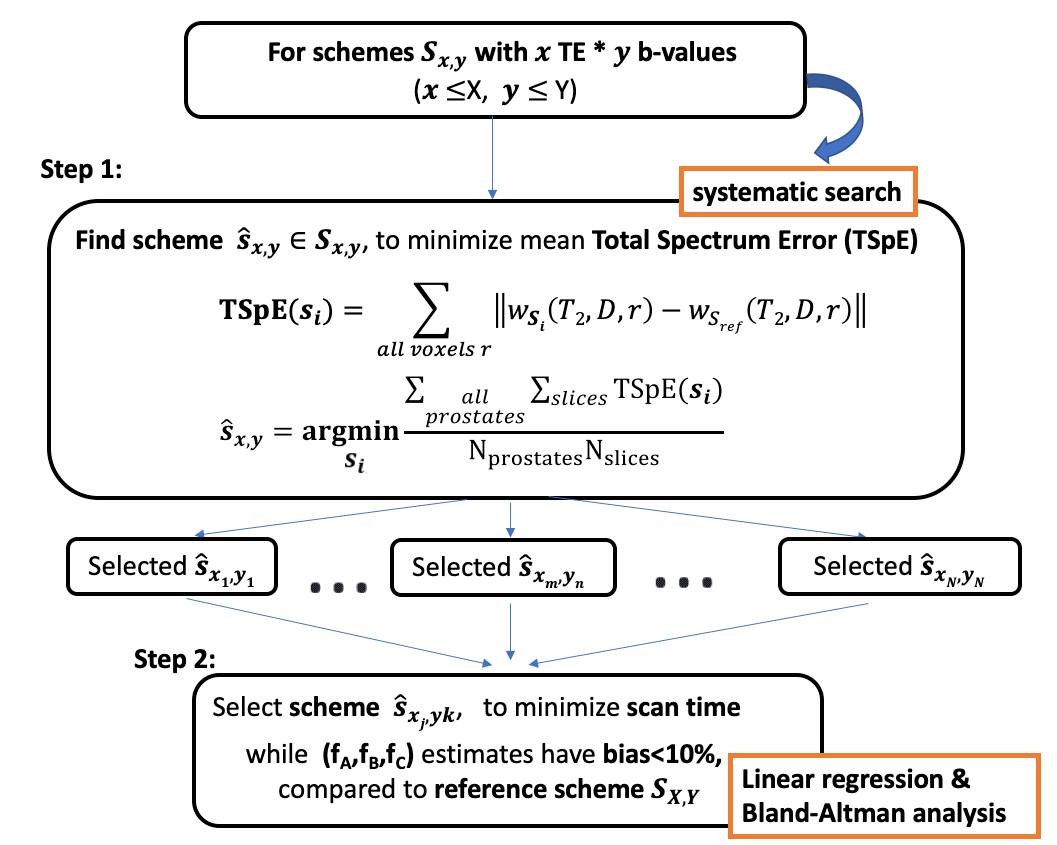
Data-Driven Framework: Reference DR-CSI datasets were collected using a total of X TEs and Y b-values (Nref=X*Y) in N prostates to reconstruct reference T2-D spectra and (fA, fB, fC ,...) maps. We performed a systematic search to identify subsampled TE-b encoding schemes that reduced scan time and maintained accuracy in estimated T2-D spectra and (fA, fB, fC, ...) in PCa regions of interest (ROI), compared to the references (Fig-1).Step 1. For each fixed total encoding number Nx,y (x TE and y b-values), determine the sub-sampled TE-b scheme with minimal mean total spectrum error (TSpE) compared to the reference T2-D spectra from all subjects and slices (apex to base) (Fig-1). To limit the computational complexity, constraints on the TE-b sampling pattern were imposed: 1) use a “rectangular” sampling pattern, as it is the most commonly used pattern to encode 2D exponential decays6-8 and 2) minimal TE and b-value is included for maintaining SNR.
Step 2. Select the scheme within lowest scan time that provides estimates in (fA, fB, fC ,…) with <10% bias in all PCa ROIs from N prostates, compared to the reference. A linear regression slope between [0.90-1.10] and 95% limits of agreement (LoA) within [-0.10, 0.10] from Bland-Altman analysis were considered.
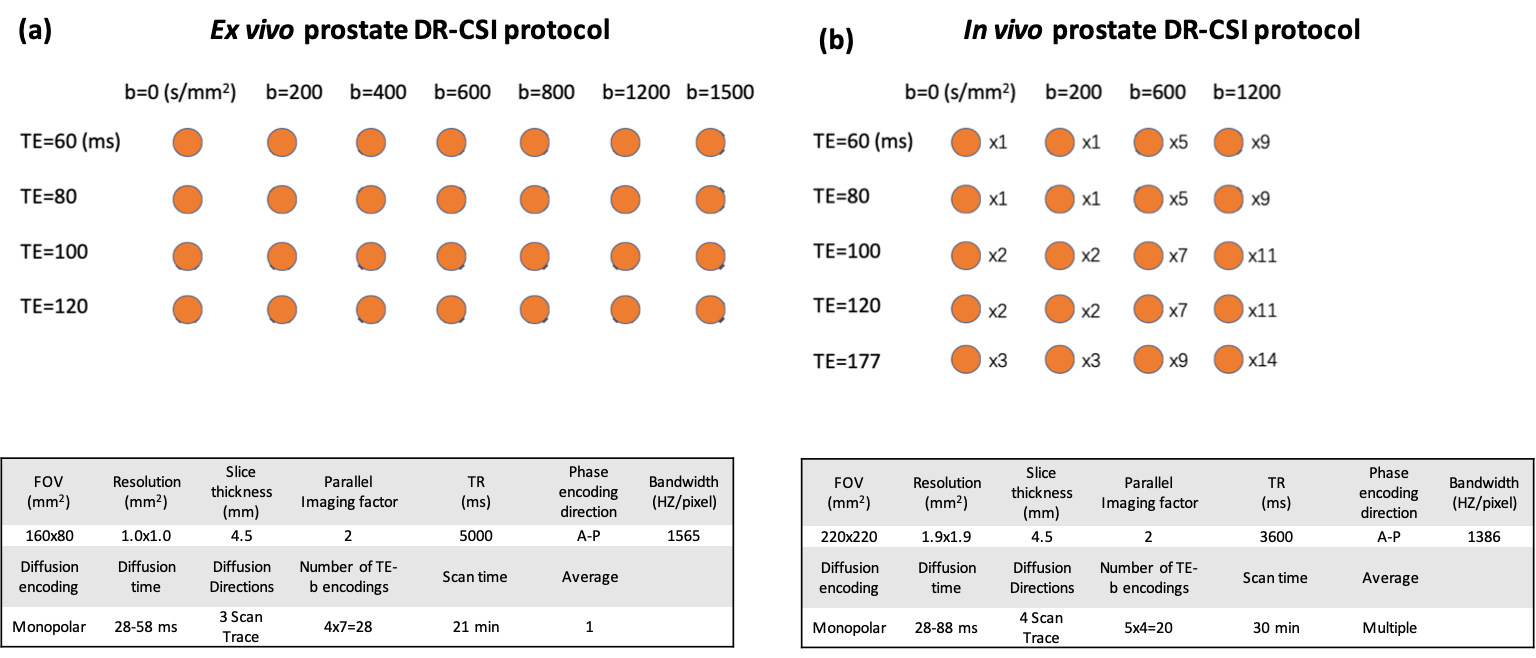
Ex Vivo Imaging: We conducted ex vivo DR-CSI at 3T (Prisma, Siemens) in 9 fresh prostates with a knee coil4: X=4 TEs and Y=7 b-values with Nref=28 TE-b encodings, 1 average per encoding (21min) (Fig-2a). We systematically evaluated subsampling schemes using 4x4=16 (12min), 3x4=12 (9min), 4x3=12 (9min), or 3x3=9 (6min) out of 28 encodings.
In Vivo Imaging: To demonstrate in vivo feasibility, we acquired prostate DR-CSI at 3T (Prisma, Siemens) using body array coils in 1 healthy male subject (age 27) using a total of X=5 TEs and Y=4 b-values with Nref=20 TE-b encodings with multiple averages (30min) (Fig-2b). We systematically evaluated subsampling schemes using 4x4=16 (24min), 3x4=12 (11min), or 4x3=12 (11 min) out of 20 encodings.
Results
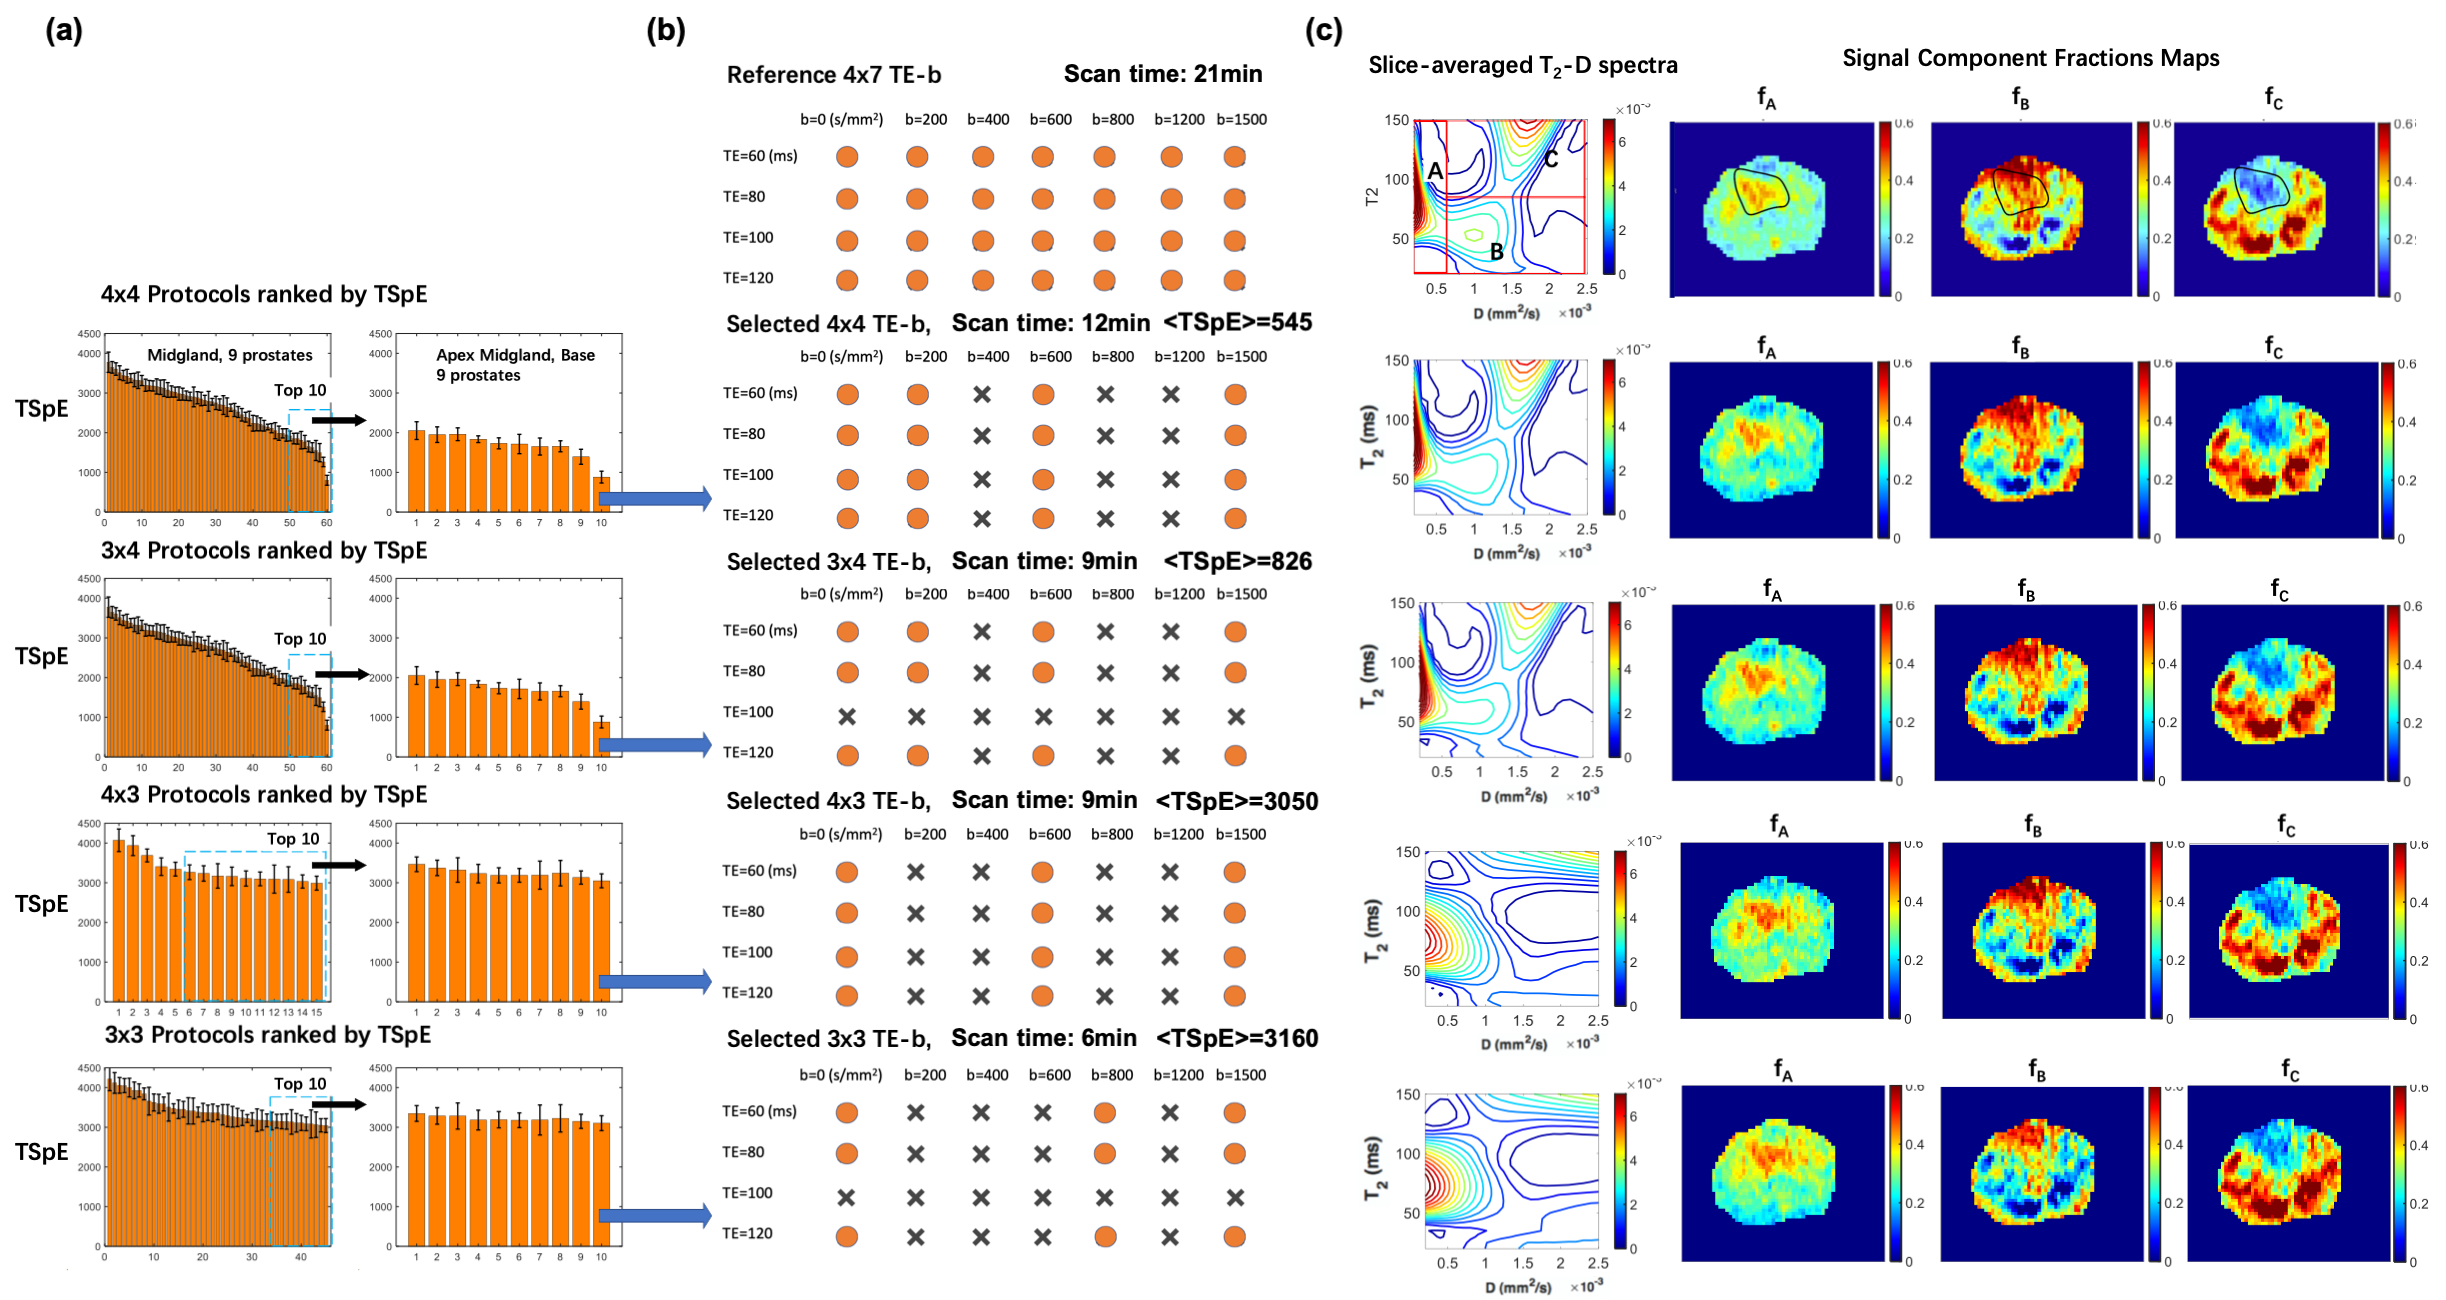
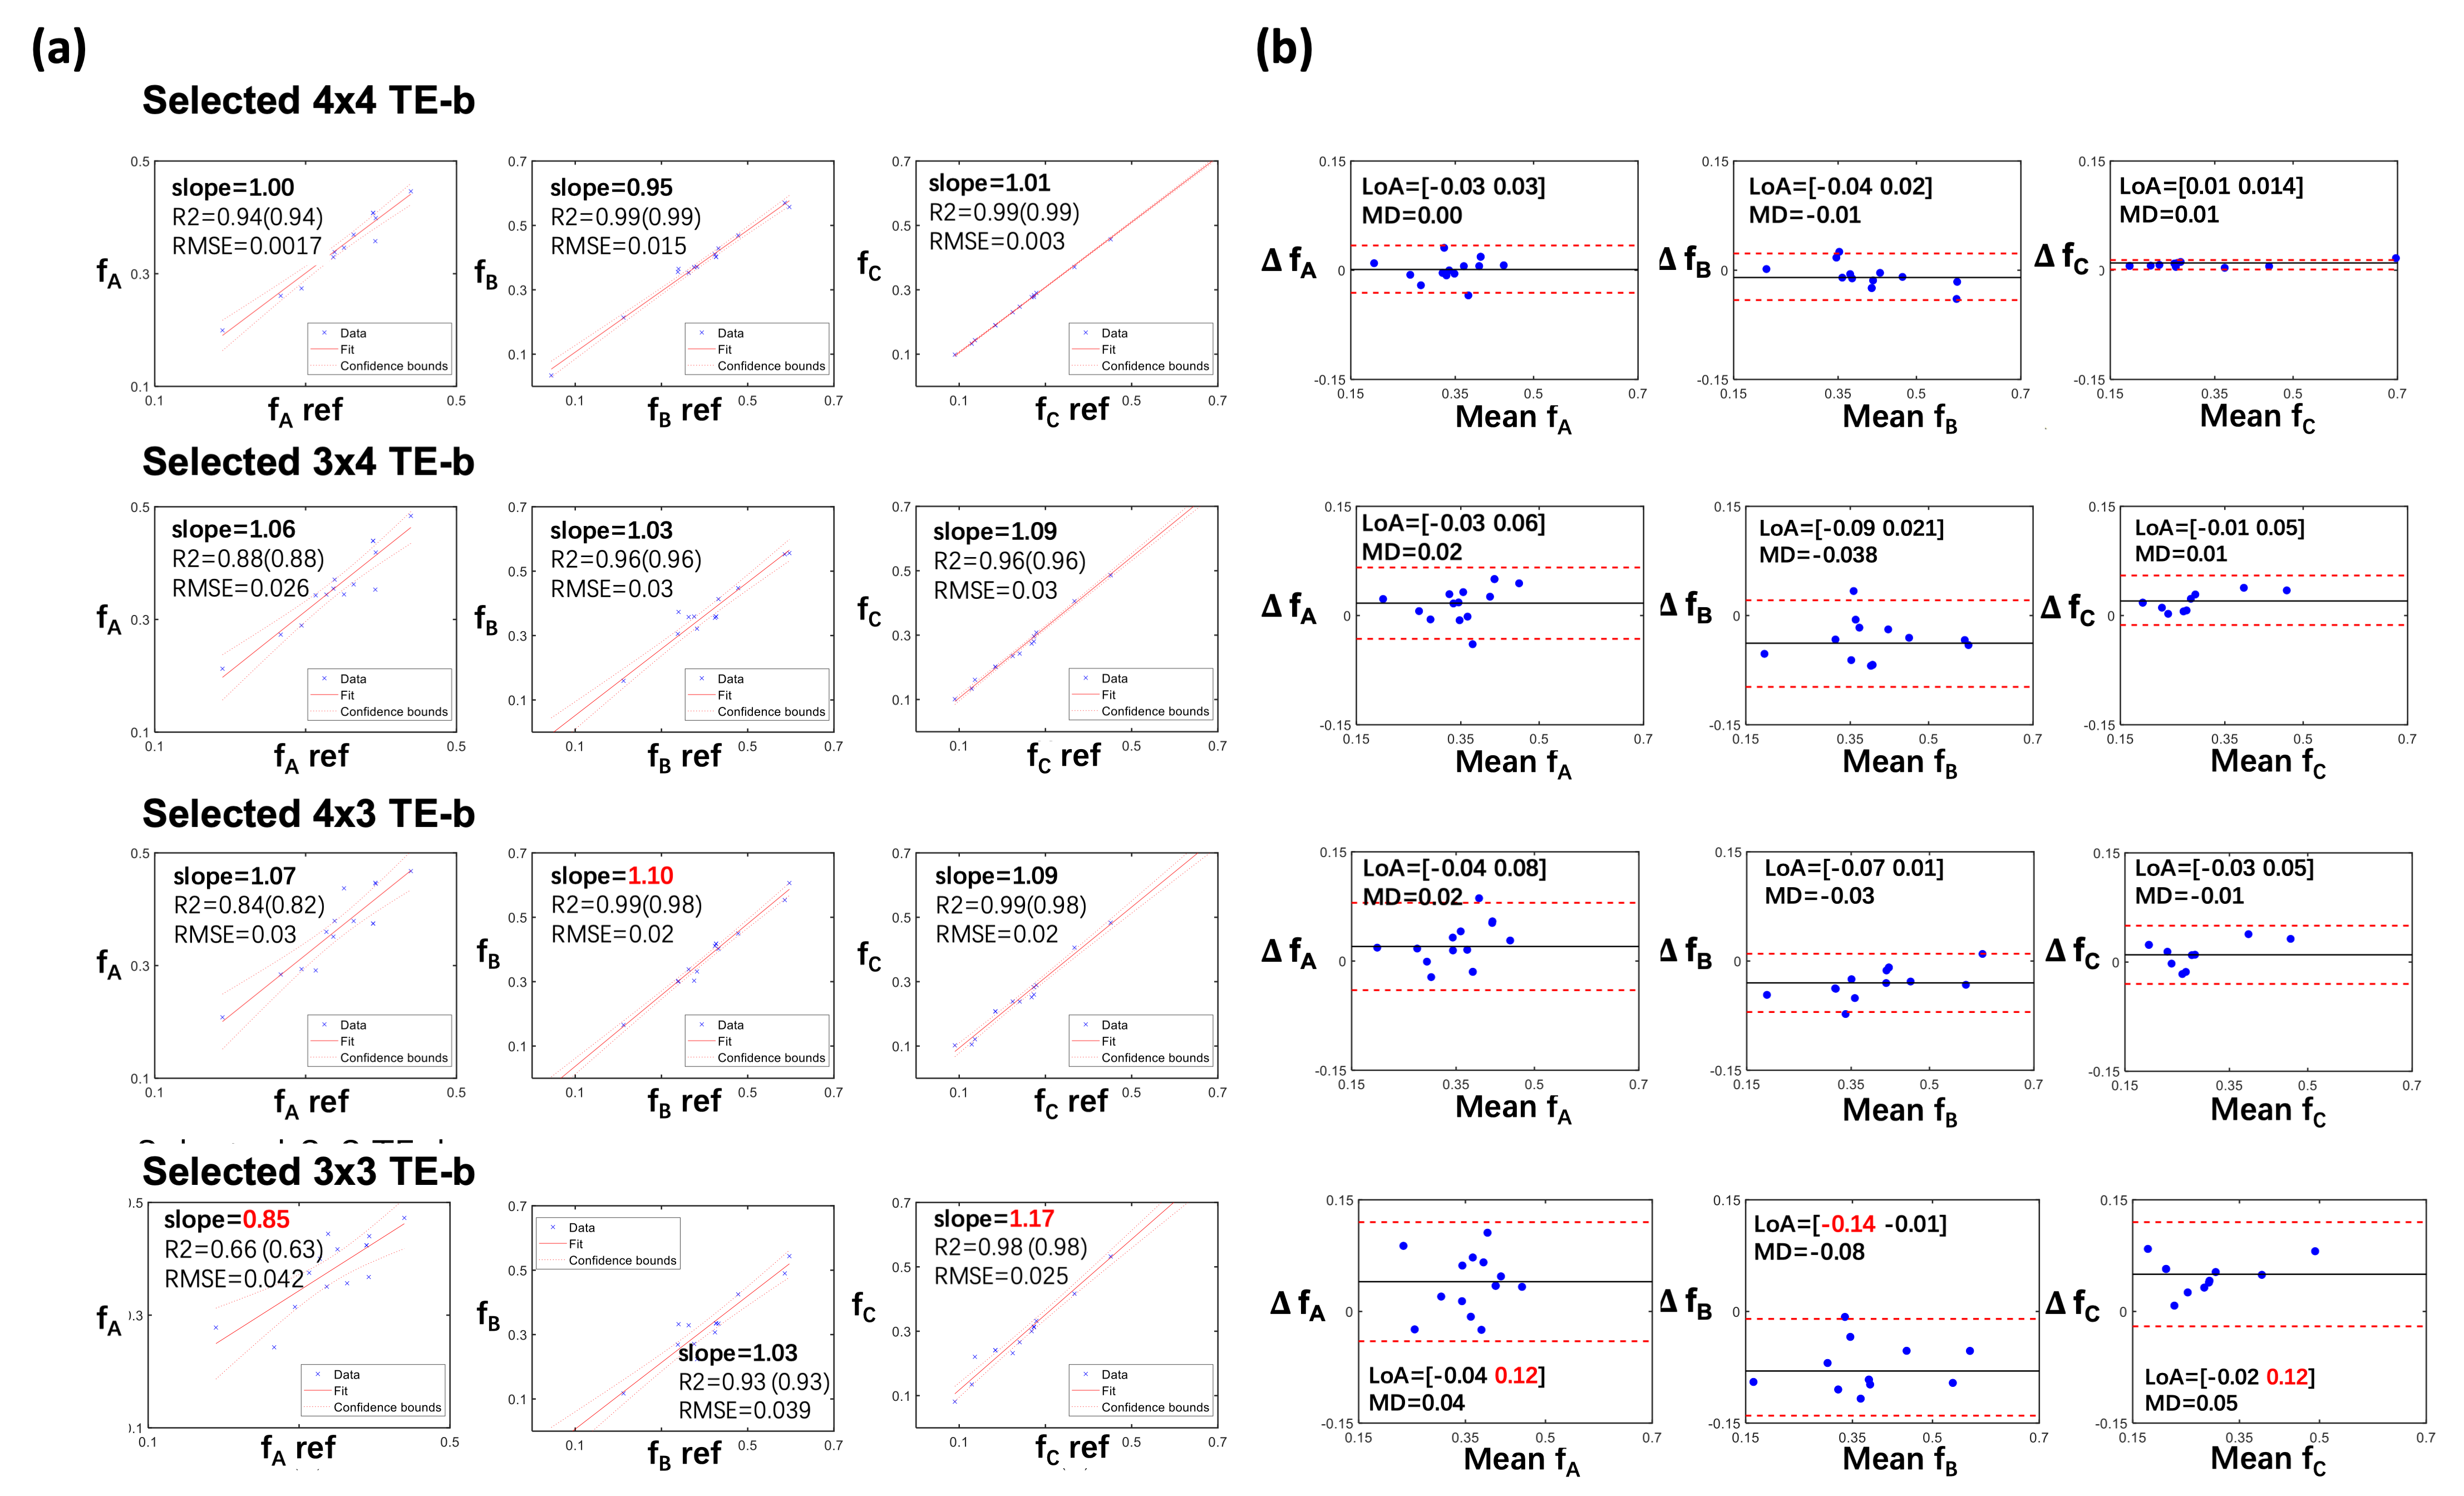
For ex vivo prostate DR-CSI, the selected TE-b schemes are shown in Fig-3a. Representative examples of T2-D spectra and signal component fraction maps (fA, fB, fC) from the reference 4x7=28 and the selected TE-b schemes are shown in Fig-3b. Fig-4 showed bias of (fA, fB, fC) estimates with each scheme.For in vivo prostate DR-CSI, the selected TE-b schemes with reconstructed T2-D spectra are shown in Fig-5a. Four distinct T2-D peaks were found and the corresponding signal component fractions (fA, fB, fC, fD) were computed (Fig-5b). Fig-5c shows the (fA, fB, fC, fD) estimates of the entire prostate peripheral zone (PZ) and transition zone (TZ) using each selected TE-b scheme.
Discussion
The ex vivo results show that using rectangular subsampling patterns, the number of TE-b encodings can be reduced by 57% from 4x7=28 (21 min) to 3x4=12 (9 min) while providing DR-CSI (fA, fB, fC) estimates with bias<10% in regions of PCa. Other schemes (e.g. 4x3 TE-b) produced bias >10% for fA, due to the reduced diffusion encodings; this may compromise the diagnosis of PCa as fA was shown to correlate with epithelial area fraction from WMHP4.The in vivo results exhibited a fourth T2-D spectral peak (T2=40ms and diffusivity=3000x10-6mm2/s) not seen on ex vivo DR-CSI. This peak has similar T2 and diffusivity as blood9, and might indicate perfusion effects. The 3x4 scheme provided 60% scan time reduction (30min to 12min) while providing PZ and TZ (fA, fB, fC, fD) similar to references.
Although we limited the scope of our search to rectangular subsampling patterns, the determined 3x4 TE-b scheme already reduced scan time substantially, showing the potential of our framework in accelerating prostate DR-CSI. Our systematic subsampling design framework can potentially be adapted to other prostate microstructural MRI techniques acquiring multiple combinations of TE and b-values (e.g. Hybrid-multidimensional MRI7 ). Future work will focus on applying our data-driven systematic DR-CSI encoding selection framework to accelerate in-vivo prostate microstructure mapping by acquiring data from more subjects and PCa patients.
Conclusion
Using a data-driven systematic framework for subsampling, we demonstrated ~60% reduction in scan time for prostate DR-CSI while maintaining accurate microstructure parameter estimation. This framework can potentially enable accelerated prostate DR-CSI to improve diagnosis of PCa.Acknowledgements
This work was supported in part by: Integrated Diagnostics Program, Departments of Radiological Sciences and Pathology, David Geffen School of Medicine at UCLA; Jonsson Comprehensive Cancer Center at UCLA; National Cancer Institute of the NIH under award number R01CA248506; Siemens Medical Solutions USA.References
1. Panagiotaki E, Chan RW, Dikaios N et al. Microstructural characterization of normal and malignant human prostate tissue with vascular, extracellular, and restricted diffusion for cytometry in tumours magnetic resonance imaging. Invest Radiol 2015;50(4):218–227.
2. Chatterjee A, Watson G et al. Changes in epithelium, stroma and lumen space correlate more strongly with Gleason pattern and are stronger predictors of prostate ADC changes than cellularity metrics. Radiology 2015;
3. Sabouri S, Chang SD, Savdie R, et al. Luminal Water Imaging: A New MR Imaging T2 Mapping Technique for Prostate Cancer Diagnosis. Radiology. 2017;284(2):451–459. doi:10.1148/radiol.2017161687
4. Zhang Z, Priester A, Magyar C, et al. Prostate Microstructure in Prostate Cancer Using 3T MRI with Diffusion-Relaxation Correlation Spectrum Imaging, Radiology; 2020;296(2):348-355.
5. Zhang Z and Wu HH, et al. Towards in vivo prostate microstructure mapping using Diffusion-Relaxation Correlation Spectrum Imaging. Proceedings of ISMRM, 2020.
6. Kim, D. , Doyle, E. K., Wisnowski, J. L., Kim, J. H. and Haldar, J. P. (2017), Diffusion‐relaxation correlation spectroscopic imaging: A multidimensional approach for probing microstructure. Magn. Reson. Med., 78: 2236-2249.
7. Chatterjee A, Bourne R, Wang S, Ajit Devaraj, Alexander J. Gallan, Tatjana Antic, Gregory S. Karczmar, and Oto A. Diagnosis of Prostate Cancer with Noninvasive Estimation of Prostate Tissue Composition by Using Hybrid Multidimensional MR Imaging: A Feasibility Study. Radiology 2018 287:3, 864-873
8. Lemberskiy G, Fieremans E, Veraart J, Deng FM, Rosenkrantz AB, Novikov DS. Characterization of prostate microstructure using water diffusion and NMR relaxation. Front Phys. 2018;6:91
9. Chen, J.J. and Pike, G.B. (2009), Human whole blood T2 relaxometry at 3 Tesla. Magn. Reson. Med., 61: 249-254.
Figures