0819
Explainable AI for CNN-based Prostate Tumor Segmentation in Multi-parametric MRI Correlated to Whole Mount Histopathology1Dept.of Radiology, Medical Physics, Medical Center University of Freiburg, Faculty of Medicine, University of Freiburg, Freiburg, Germany, 2German Cancer Consortium (DKTK), Partner Site Freiburg, Freiburg, Germany, 3The MathWorks, Inc., Novi, MI, United States, 4Dept.of Radiology, Medical Center University of Freiburg, Faculty of Medicine, University of Freiburg, Freiburg, Germany
Synopsis
An explainable deep learning model was implemented to interpret the predictions of a convolution neural network (CNN) for prostate tumor segmentation. The CNN automatically segments the prostate gland and prostate tumors in multi-parametric MRI data using co-registered whole mount histopathology images as ground truth. For the interpretation of the CNN, saliency maps are generated by generalizing the Gradient Weighted Class Activation Maps method for prostate tumor segmentation. Evaluations on the saliency method indicate that the CNN was able to correctly localize the tumor and the prostate by targeting the pixels in the image deemed important for the CNN's prediction.
Introduction
The manual delineation of prostate carcinomas (PCa) in multiparametric MRI (mpMRI) images is time consuming and susceptible to high inter- and intra-observer variability. Automated algorithms based on convolutional neural networks (CNNs) have shown promising results for the PCa segmentation 1–5. Even though CNNs perform well in such tasks, in PCa the training of the CNN remains challenging due to the absence of verified ground truth image data, as biopsy data are only available at a limited number of locations in the gland. Another problem of CNNs is the non-transparency associated with the way in which a CNN comes to a decision, which does not foster trust and acceptance amongst the end users. Hence, there is a need for explainable models that quantify why certain PCa predictions were made (interpretability) 6.To validate the CNN against an established ground truth, in this study we use whole mount histopathology slices from prostatectomy patients that are co-registered with mpMRI images. Gradient weighted class activation map (Grad-CAM)7 is widely used for the interpretation of classifications decisions but has rarely been applied for segmentation tasks 8.As segmentation is essentially a classification of each pixel to a category of labels, we provide better visual explanations of CNN model predictions by generalizing the 3D-Grad-CAM and SEG-Grad-CAM methods proposed in9-10 to generate heat maps relevant for the segmentation of the target image category.
Materials and Methods
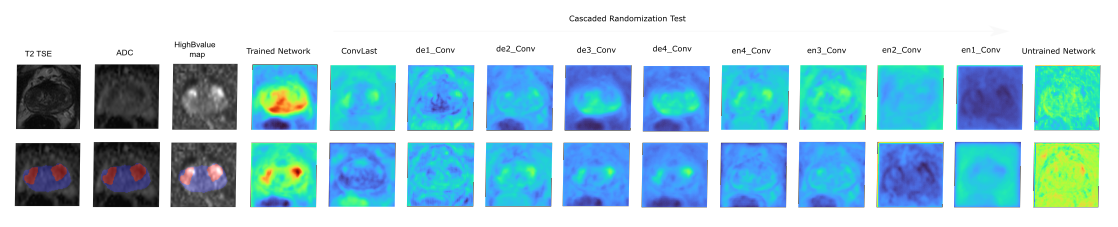
MpMRI data from PCa patients was used that were acquired between 2008 and2019 on clinical 1.5T and 3T systems. Patient data was separated into two groups: (a) a large irradiation and prostatectomy group (n = 122), and (b) a prostatectomy group (n = 15) from which whole organ histopathology slices were available. For CNN training the mpMRI data of the group irradiation and prostatectomy was used which contained pre-contrast T2 TSE and apparent diffusion coefficient (ADC) maps together with computed high b-value maps (b = 1400 s/mm²). In the images the entire prostate gland (PG) and the gross tumor volume (GTV) within the prostate were contoured by a radiation oncologist with over 5 years of experience, in accordance to the PI-RADs v2 standards 11.Image data were cropped to a smaller FOV around the prostate gland and then registered and interpolated to an in-plane resolution of 0.78×0.78x3 mm³. A patch-based 3D CNN of the UNET architecture 12 was trained for the automatic segmentation of GTV and PG. The network was implemented in MATLAB® (2020a, Math Works, Inc., Natick/MA). The optimal parameter set obtained by a Bayesian optimization scheme to maximize the segmentation performance was used to train the network within 150 epochs on an NVIDIA RTX2080 GPU. The center location of each patch was chosen randomly with respect to the original image. The probability of the center pixel to be of the class background, GTV or PG was set to 33% to account for class imbalance and a chance of 70% for a random 2D-rotation in the axial plane was added for data augmentation. During the CNN testing phase, the mpMRI data from the prostatectomy group 13 was used as a test cohort to evaluate the quality of the networks prediction. The resulting segmentation was then compared via the Dice Sorensen Coefficient (DSC) with the ground truth. For the 3D Grad-CAM the class specific score (PG and GTV) was aggregated, and then the gradient of the aggregated class score was calculated with respect to the feature maps at every voxel location in the last convolution layer to generate weights. These weights were combined with the feature map to obtain the visual explanation for the corresponding class label. For further analysis, the sensitivity of visualization method was evaluated using the model randomization test (sanity check) proposed in 14.
Results
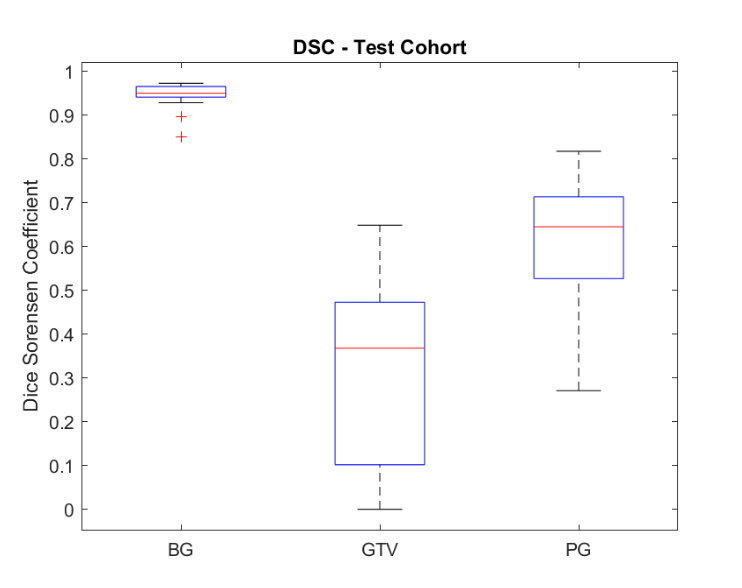
The figure 1 shows the median DSC is 0.95 (range: 0.97-0.85) between the predictions of the CNN and the ground truth for the class BG, and 0.37 (range: 0.64 - 0) for GTV and 0.64 (range: 0.81 – 0.27) for PG on the test cohort respectively. Figure 2 the predictions obtained for 3 patients from the test cohort. The DSC for GTV is 0.48, 0.64 and 0.1 and for PG it is 0.49, 0.67 and 0.51 for patient 1 to 3. The saliency maps are presented in (Fig.2 (f)), and they are overlaid on the corresponding input image sequences (d-e). This overlay highlights the voxel regions with high activations (intensity values > 0.5) which the CNN deemed important for the predicted segmentation. Evaluation results of the model randomization test indicate that the method is dependent on the learned parameters of the model shown in figure 4. The method passes the sanity check.Discussion and Conclusion
In this study, mpMRI images of the correspondent whole mount histopathology slices were used to evaluate the segmentation quality of a CNN for PCa. The DSC between the CNN was in close agreement with the registered whole mount histopathology slices. Saliency maps based on the Grad-CAM method to visually interpret the CNN’s prediction for PCa segmentation was developed. The saliency method achieves better visual performance and fairness for interpreting the decision-making process of CNN in PCa segmentation.Acknowledgements
Grant support by the Klaus Tschira Stiftung gGmbH, Heidelberg, Germany is gratefully acknowledged.References
- Rundo L, Han C, Zhang J, et al. CNN-Based Prostate Zonal Segmentation on T2-Weighted MR Images: A Cross-Dataset Study. Smart Innov Syst Technol. 2020;151:269-280. doi:10.1007/978-981-13-8950-4_25
- Motamed S, Gujrathi I, Deniffel D, Oentoro A, Haider MA, Khalvati F. A Transfer Learning Approach for Automated Segmentation of Prostate Whole Gland and Transition Zone in Diffusion Weighted MRI. 2019. http://arxiv.org/abs/1909.09541.
- Hu S, Worrall D, Knegt S, Veeling B, Huisman H, Welling M. Supervised Uncertainty Quantification for Segmentation with Multiple Annotations. In: Lecture Notes in Computer Science (Including Subseries Lecture Notes in Artificial Intelligence and Lecture Notes in Bioinformatics). Vol 11765 LNCS. Springer; 2019:137-145. doi:10.1007/978-3-030-32245-8_16
- Karimi D, Samei G, Kesch C, Nir G, Salcudean SE. Prostate segmentation in MRI using a convolutional neural network architecture and training strategy based on statistical shape models. Int J Comput Assist Radiol Surg. 2018;13(8):1211-1219. doi:10.1007/s11548-018-1785-8
- Litjens G, Toth R, van de Ven W, et al. Evaluation of prostate segmentation algorithms for MRI: The PROMISE12 challenge. Med Image Anal. 2014;18(2):359-373. doi:10.1016/j.media.2013.12.002
- Arrieta AB, Díaz-Rodríguez N, Del Ser J, et al. Explainable Artificial Intelligence (XAI): Concepts, taxonomies, opportunities and challenges toward responsible AI. Inf Fusion. 2020;58:82-115.
- R. R. Selvaraju, M. Cogswell, A. Das, R. Vedantam, D. Parikh, and D. Batra, “Grad-CAM: Visual Explanations from Deep Networks via Gradient-Based Localization,” in Proceedings of the IEEE International Conference on Computer Vision, 2017, vol. 2017-October, pp. 618–626
- Singh A, Sengupta S, Lakshminarayanan V. Explainable deep learning models in medical image analysis. arXiv. 2020:1-18.
- Yang C, Rangarajan A, Ranka S. Visual Explanations From Deep 3D Convolutional Neural Networks for Alzheimer’s Disease Classification. AMIA . Annu Symp proceedings AMIA Symp. 2018;2018:1571-1580. /pmc/articles/PMC6371279/?report=abstract. Accessed December 13, 2020.
- Vinogradova K, Dibrov A, Myers G. Towards Interpretable Semantic Segmentation via Gradient-Weighted Class Activation Mapping.
- Barentsz JO, Weinreb JC, Verma S, et al. Synopsis of the PI-RADS v2 Guidelines for Multiparametric Prostate Magnetic Resonance Imaging and Recommendations for Use. Eur Urol. 2016;69(1):41-49. doi:10.1016/j.eururo.2015.08.038
- Ronneberger O, Fischer P, Brox T. U-net: Convolutional networks for biomedical image segmentation. In: International Conference on Medical Image Computing and Computer-Assisted Intervention. Springer; 2015:234-241.
- Bettermann AS, Zamboglou C, Kiefer S, et al. [(68)Ga-]PSMA-11 PET/CT and multiparametric MRI for gross tumor volume delineation in a slice by slice analysis with whole mount histopathology as a reference standard - Implications for focal radiotherapy planning in primary prostate cancer. Radiother Oncol J Eur Soc Ther Radiol Oncol. 2019;141:214-219. doi:10.1016/j.radonc.2019.07.005
- Adebayo J, Gilmer J, Muelly M, Goodfellow I, Hardt M, Kim B. Sanity checks for saliency maps. arXiv. 2018;(NeurIPS).
Figures
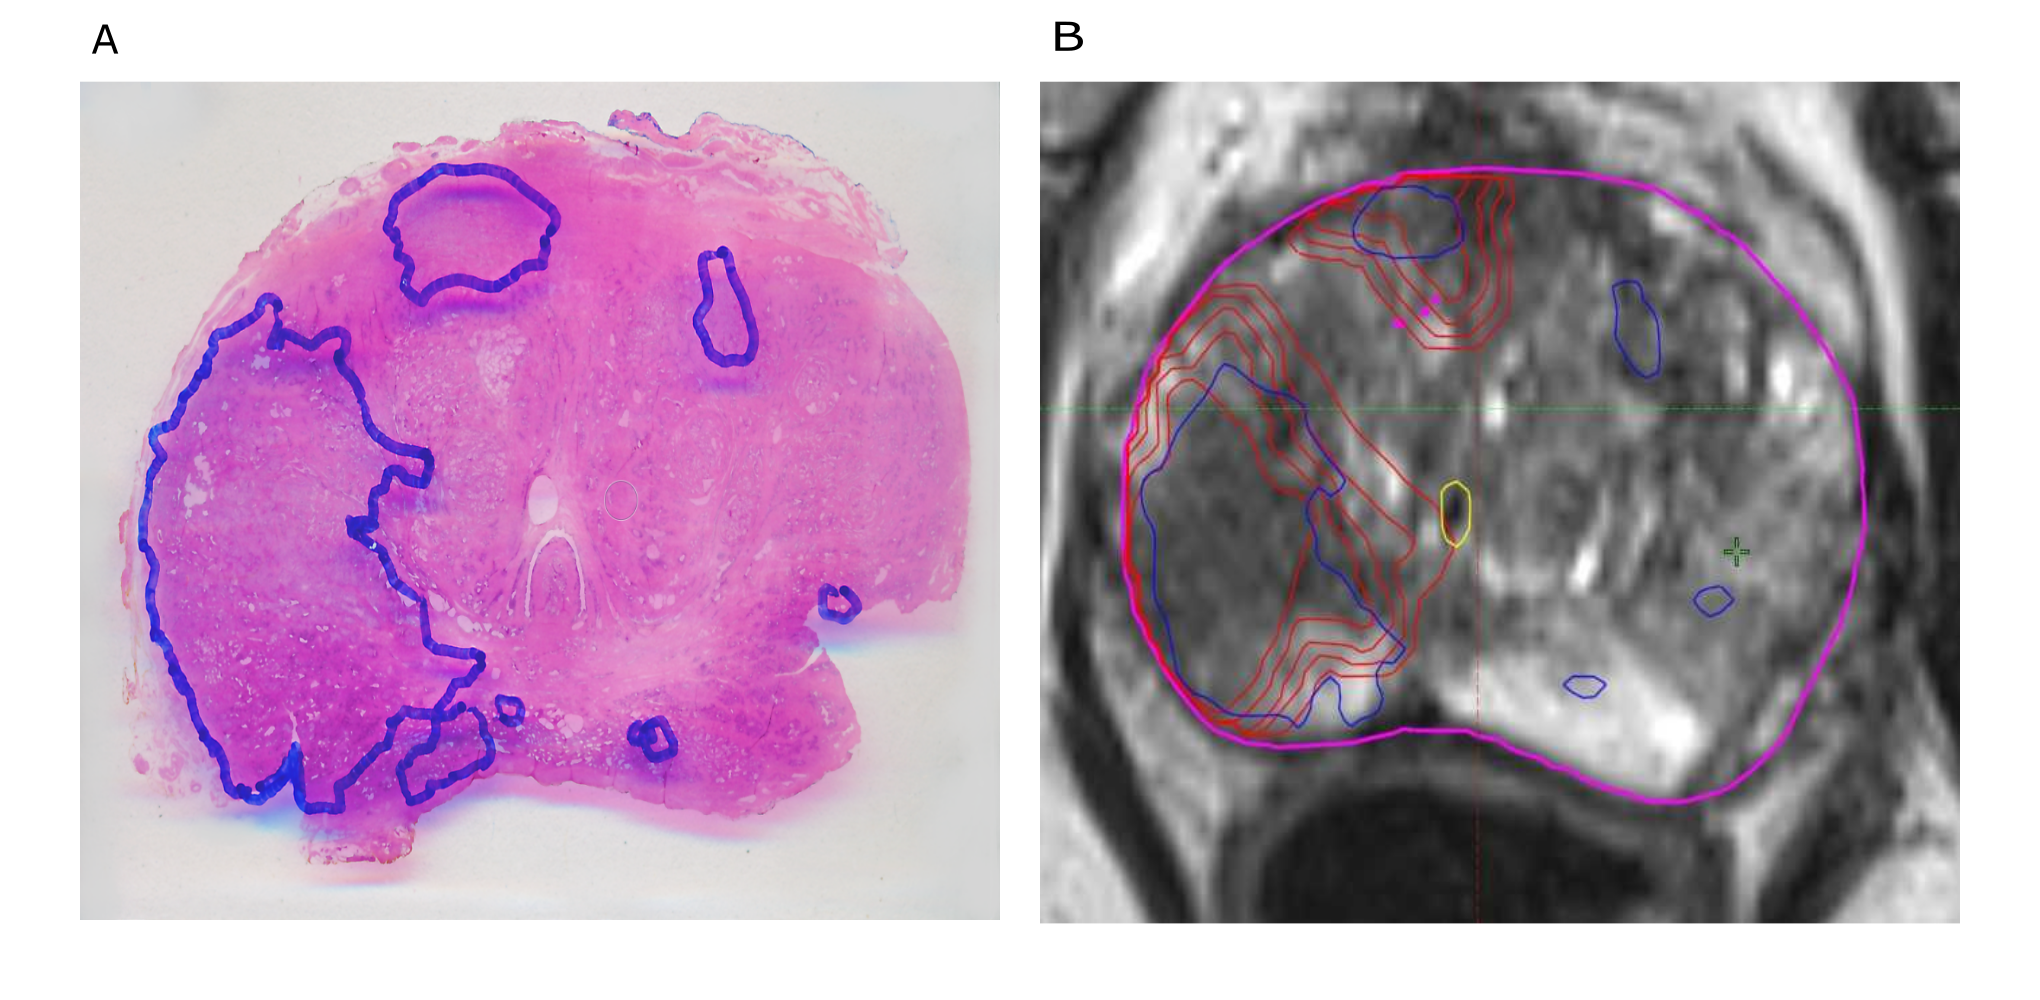
A sample histology reference projected on the MRI sequence : (A) Hematoxylin and eosin whole-mount prostate slide with marked PCa lesion. (B) registered histopathology slice blue=PCa, red = GTV-MRI with 1mm isotropic expansion.
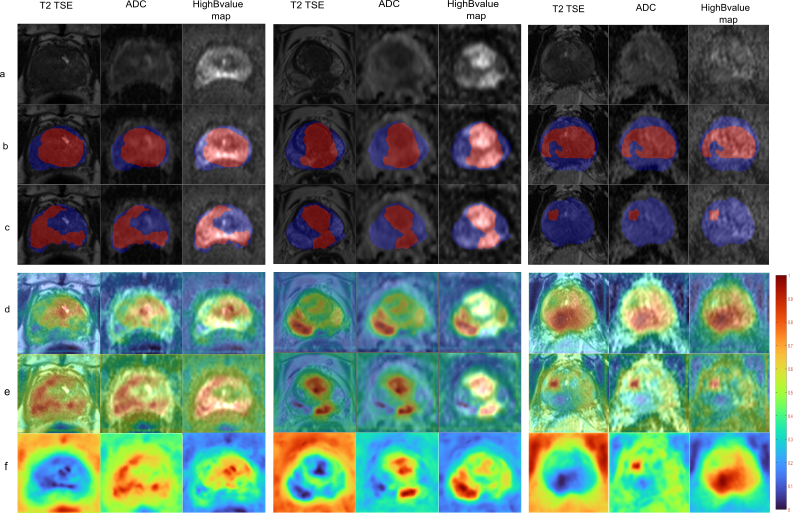
Segmentation of PG and GTV for test patient 1 - 3 (a) Input mpMRI sequences, (b) ground truth, (c) prediction. Overlays in (b) and (c) depict PG in blue and GTV in red.(d-e) overlay of the saliency map for the class PG and GTV on the corresponding input sequences and (f) the generated saliency map PG and GTV. The locations of higher intensity values in the saliency map indicate the importance of the corresponding voxels in the prediction of CNN.