0818
Incorporating UDM into Deep Learning for better PI-RADS v2 Assessment from Multi-parametric MRI1Shanghai Key Laboratory of Magnetic Resonance, East China Normal University, Shanghai, China, 2Department of Radiology, the First Affiliated Hospital with Nanjing Medical University, Jiangsu, China
Synopsis
Prostate cancer is one of the most important causes of cancer-incurred deaths among males. The prostate imaging reporting and data system (PI-RADS) v2 standardizes the acquisition of multi-parametric magnetic resonance images (mp-MRI) and identification of clinically significant prostate cancer. We purposed a convolutional neural network which integrated an unsure data model (UDM) to predict the PI-RADS v2 score from mp-MRI. The model achieved an F1 score of 0.640, which is higher than that of the ResNet-50. On an independent test cohort of 146 cases, our model achieved an accuracy of 64.4%.
Introduction
The prostate imaging reporting and data system (PI-RADS) is critical to the diagnosis of clinically significant prostate cancer (PCa) by multi-parametric magnetic resonance imaging (mp-MRI), but suffers from poor inter-reader and intra-reader agreement1. Convolutional neural network (CNN) has been used successfully in computer-aided diagnosis, including the diagnosis of PCa2. However, studies on automatic PI-RADS assessment by CNN were limited3, perhaps due to the inter-reader variance of the PI-RADS labelling. In this study, we extended the unsure data model (UDM)4 proposed by Wu and incorporated it into ResNet50 for the PI-RADS assessment.In this study, we extended the unsure data model (UDM)4 proposed by Wu and incorporated it into ResNet-50 for the PI-RADS assessment.
Methods
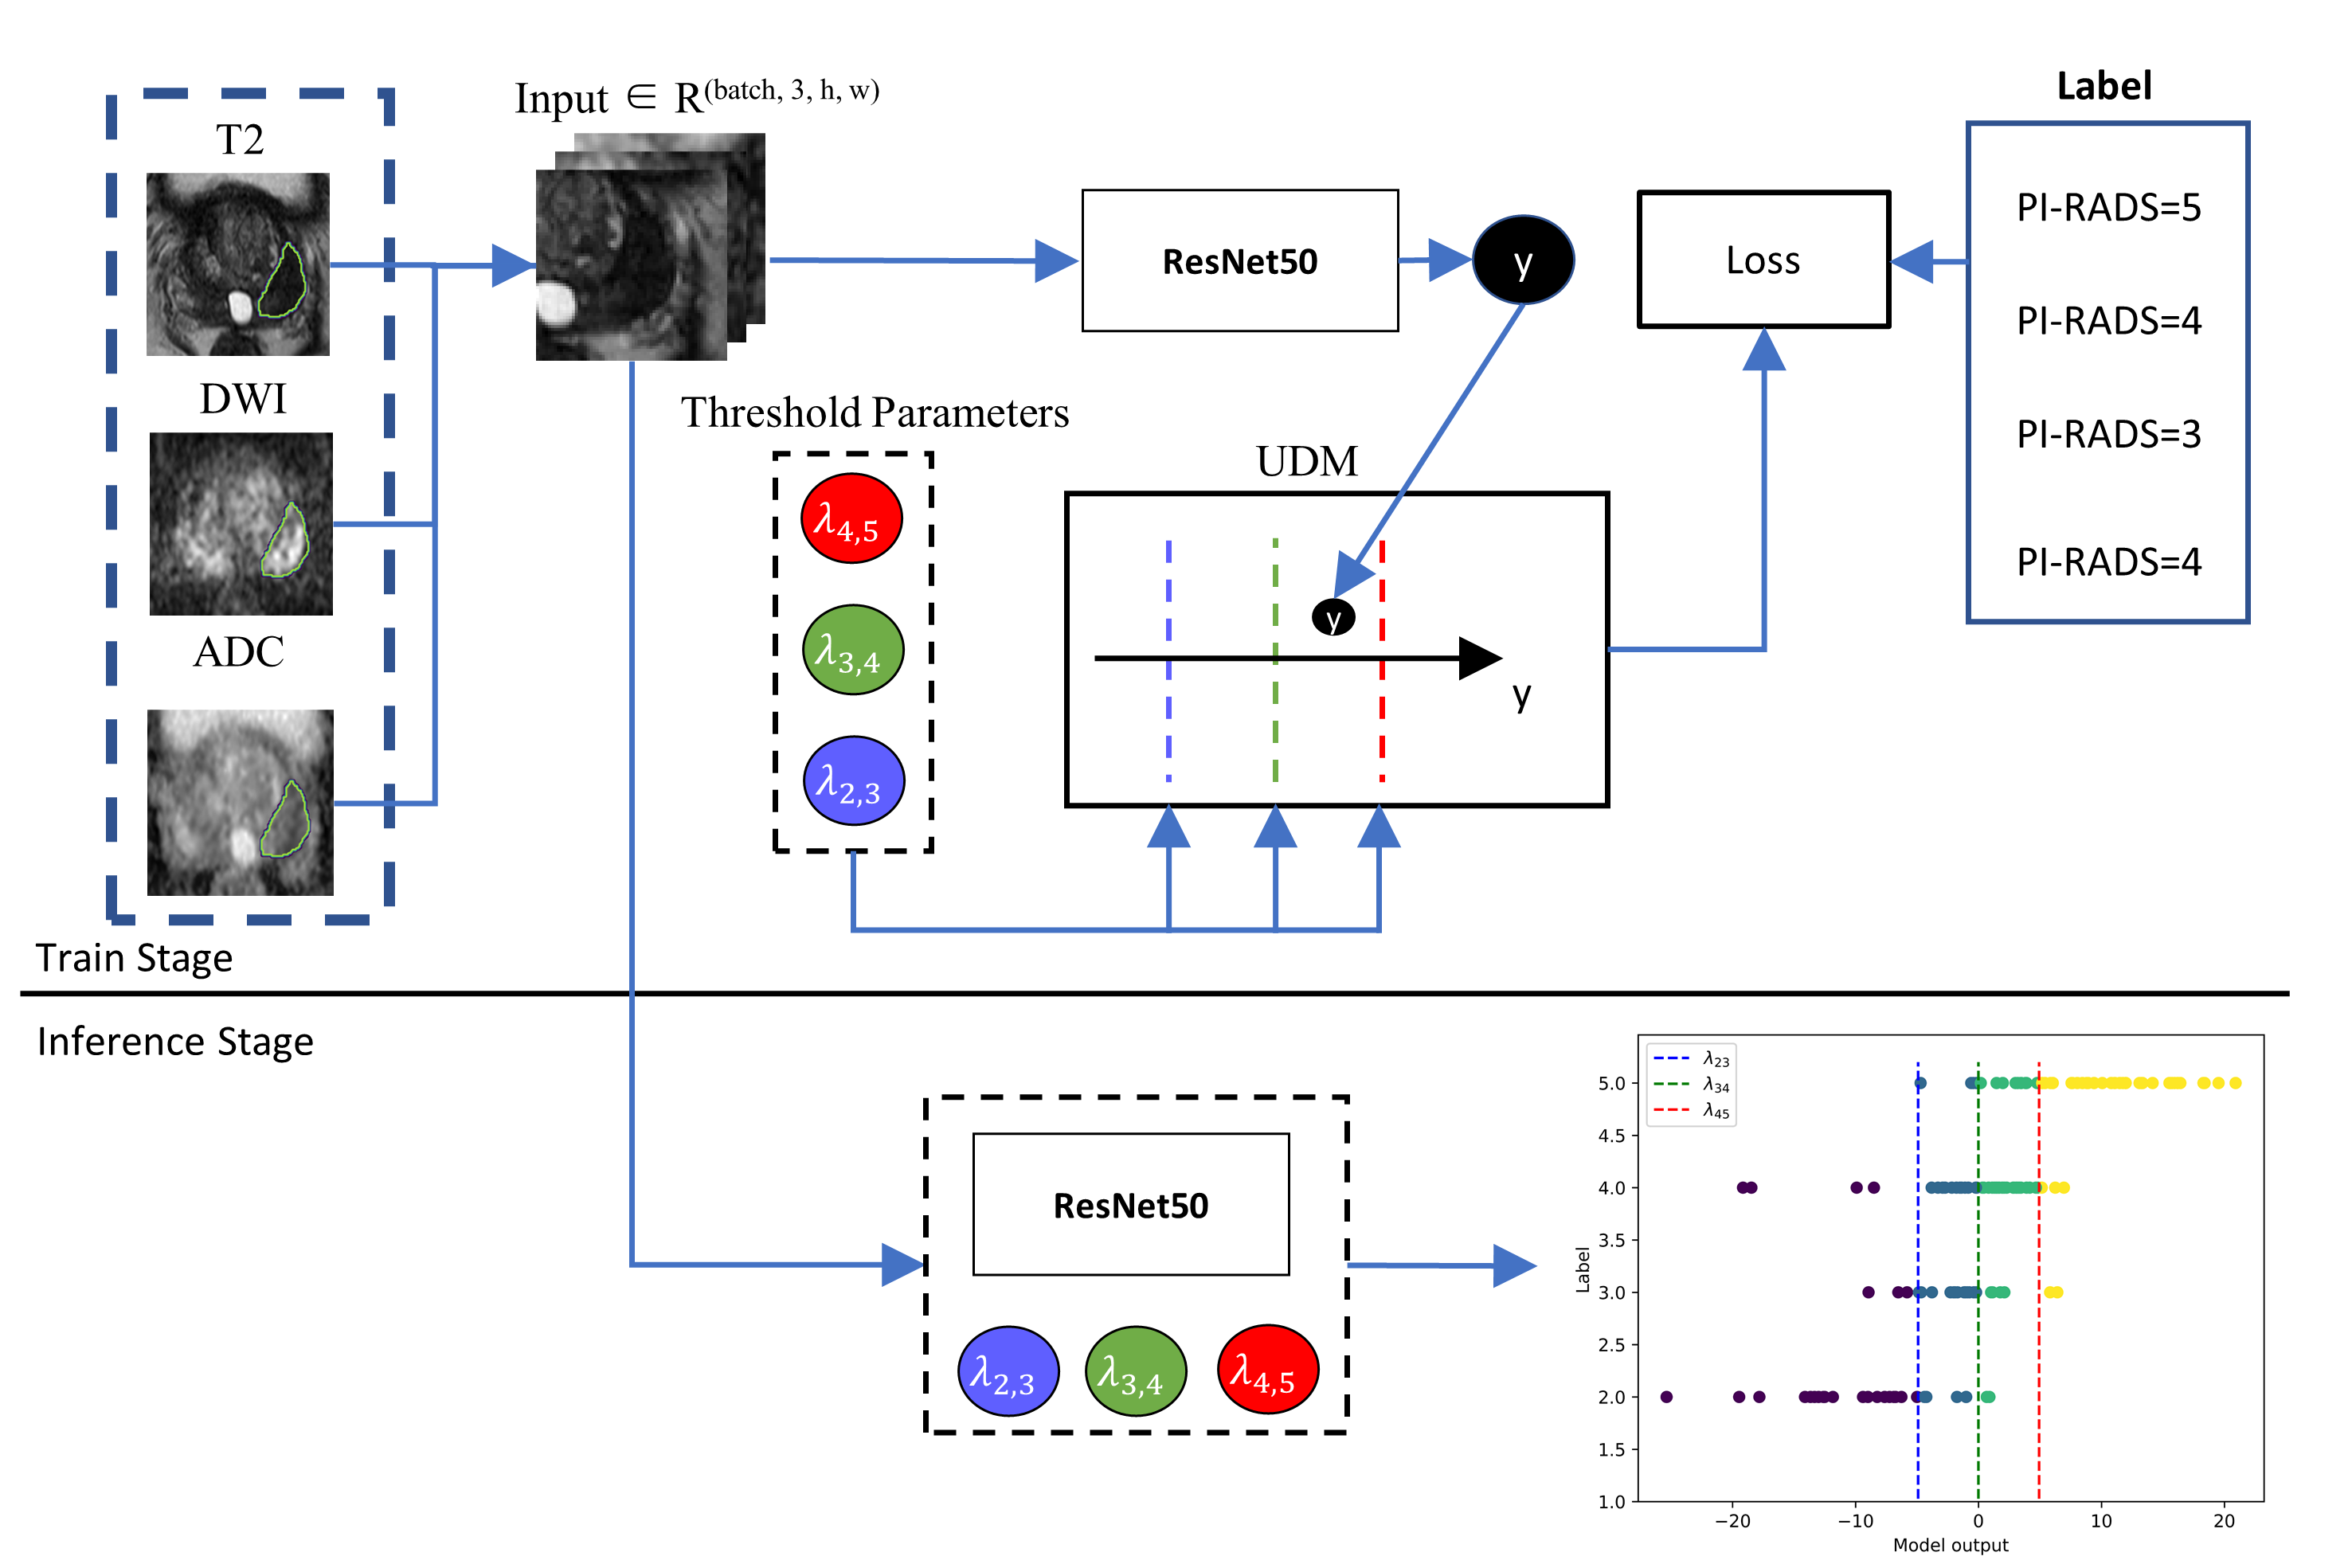
705 cases (126 PI-RADS 2, 114 PI-RADS 3, 223 PI-RADS 4, 242 PI-RADS 5) were collected on two 3T scanners (Skyra, Siemens Healthcare; MR770, United Imaging Healthcare). We used the scan protocols suggested by PI-RADS v2.1 to get the T2-weighted images (T2WI), diffusion weighted images (DWI) with b-value=1500mm2/s, and apparent diffusion coefficient (ADC) maps. PI-RADS score was reported by one radiologist with 4-year experience in the interpretation of prostate MRIs. The dataset was randomly split into training (n = 448), validation (111) and test (146) cohort.The main data pipeline was shown in Figure 1. All images were resampled to an in-plane resolution of 0.50.5mm2. The DWI and ADC images were aligned onto T2W with Elastix. Patches of the size of 6464 were cropped from the slices containing the largest cross section of lesion for all sequences, before they were normalized by min-max method and concatenated in the channel dimension.
A ResNet-50 pretrained on ImageNet15 was utilized for training with only the densely connected layers adjusted. Stochastic gradient descent optimizer was used with an initial learning rate of 0.001 and a batch size of 32. We also used online data augmentation including random rotation, shifting, and horizontal flipping to prevent overfitting.
Since PI-RADS categories are ordinal in nature, typical encoding schemes, such as one-hot encoding, are not the best options. So we extended UDM, which was proposed for multi-classification, and introduced it into ResNet-50 to construct a so-called ResNet-UDM for PI-RADS classification.
We added a postprocessing step on the output of ResNet-50 to produce the PI-RADS category:
$$y_{pred} = \begin{cases}5 & f(x)>\lambda_{45}\\4 & \lambda_{34}<f(x)\leq\lambda_{45}\\3 & \lambda_{23}<(x)\leq\lambda_{34}\\2 & f(x)\leq\lambda_{23}\end{cases}$$
where $$$f(x)$$$ is the output of ResNet-50 and $$$x$$$ is the concatenated input, and $$$\lambda_{ij}$$$ is the threshold value separating PI-RADS $$$i$$$ and PI-RADS $$$j$$$. The parameter $$$\lambda_{ij}$$$ was also learnt during the training. The loss function was as follows:
$$l = -\frac{1}{N}\sum_\ ^\ \left[ 1\ \left\{y=5\right\}log(1-P_{45}(x)) +1\ \left\{y=4\right\}log(P_{45}-P_{34}(x)) +1\ \left\{y=3\right\}log(P_{34}-P_{23}(x)) +1\ \left\{y=2\right\}log(P_{23}(x))\right]$$
where $$$P_{ij}$$$ denoted the distance between the output of ResNet-50 and the threshold parameter:
$$P_{ij}(x) = G(\lambda_{ij}-f(x))$$
where $$$G$$$ stands for sigmoid function.
Finally, F1 score was used to evaluate the performance of the model and Wilcoxon signed-rank test was used for statistical analysis.
Results
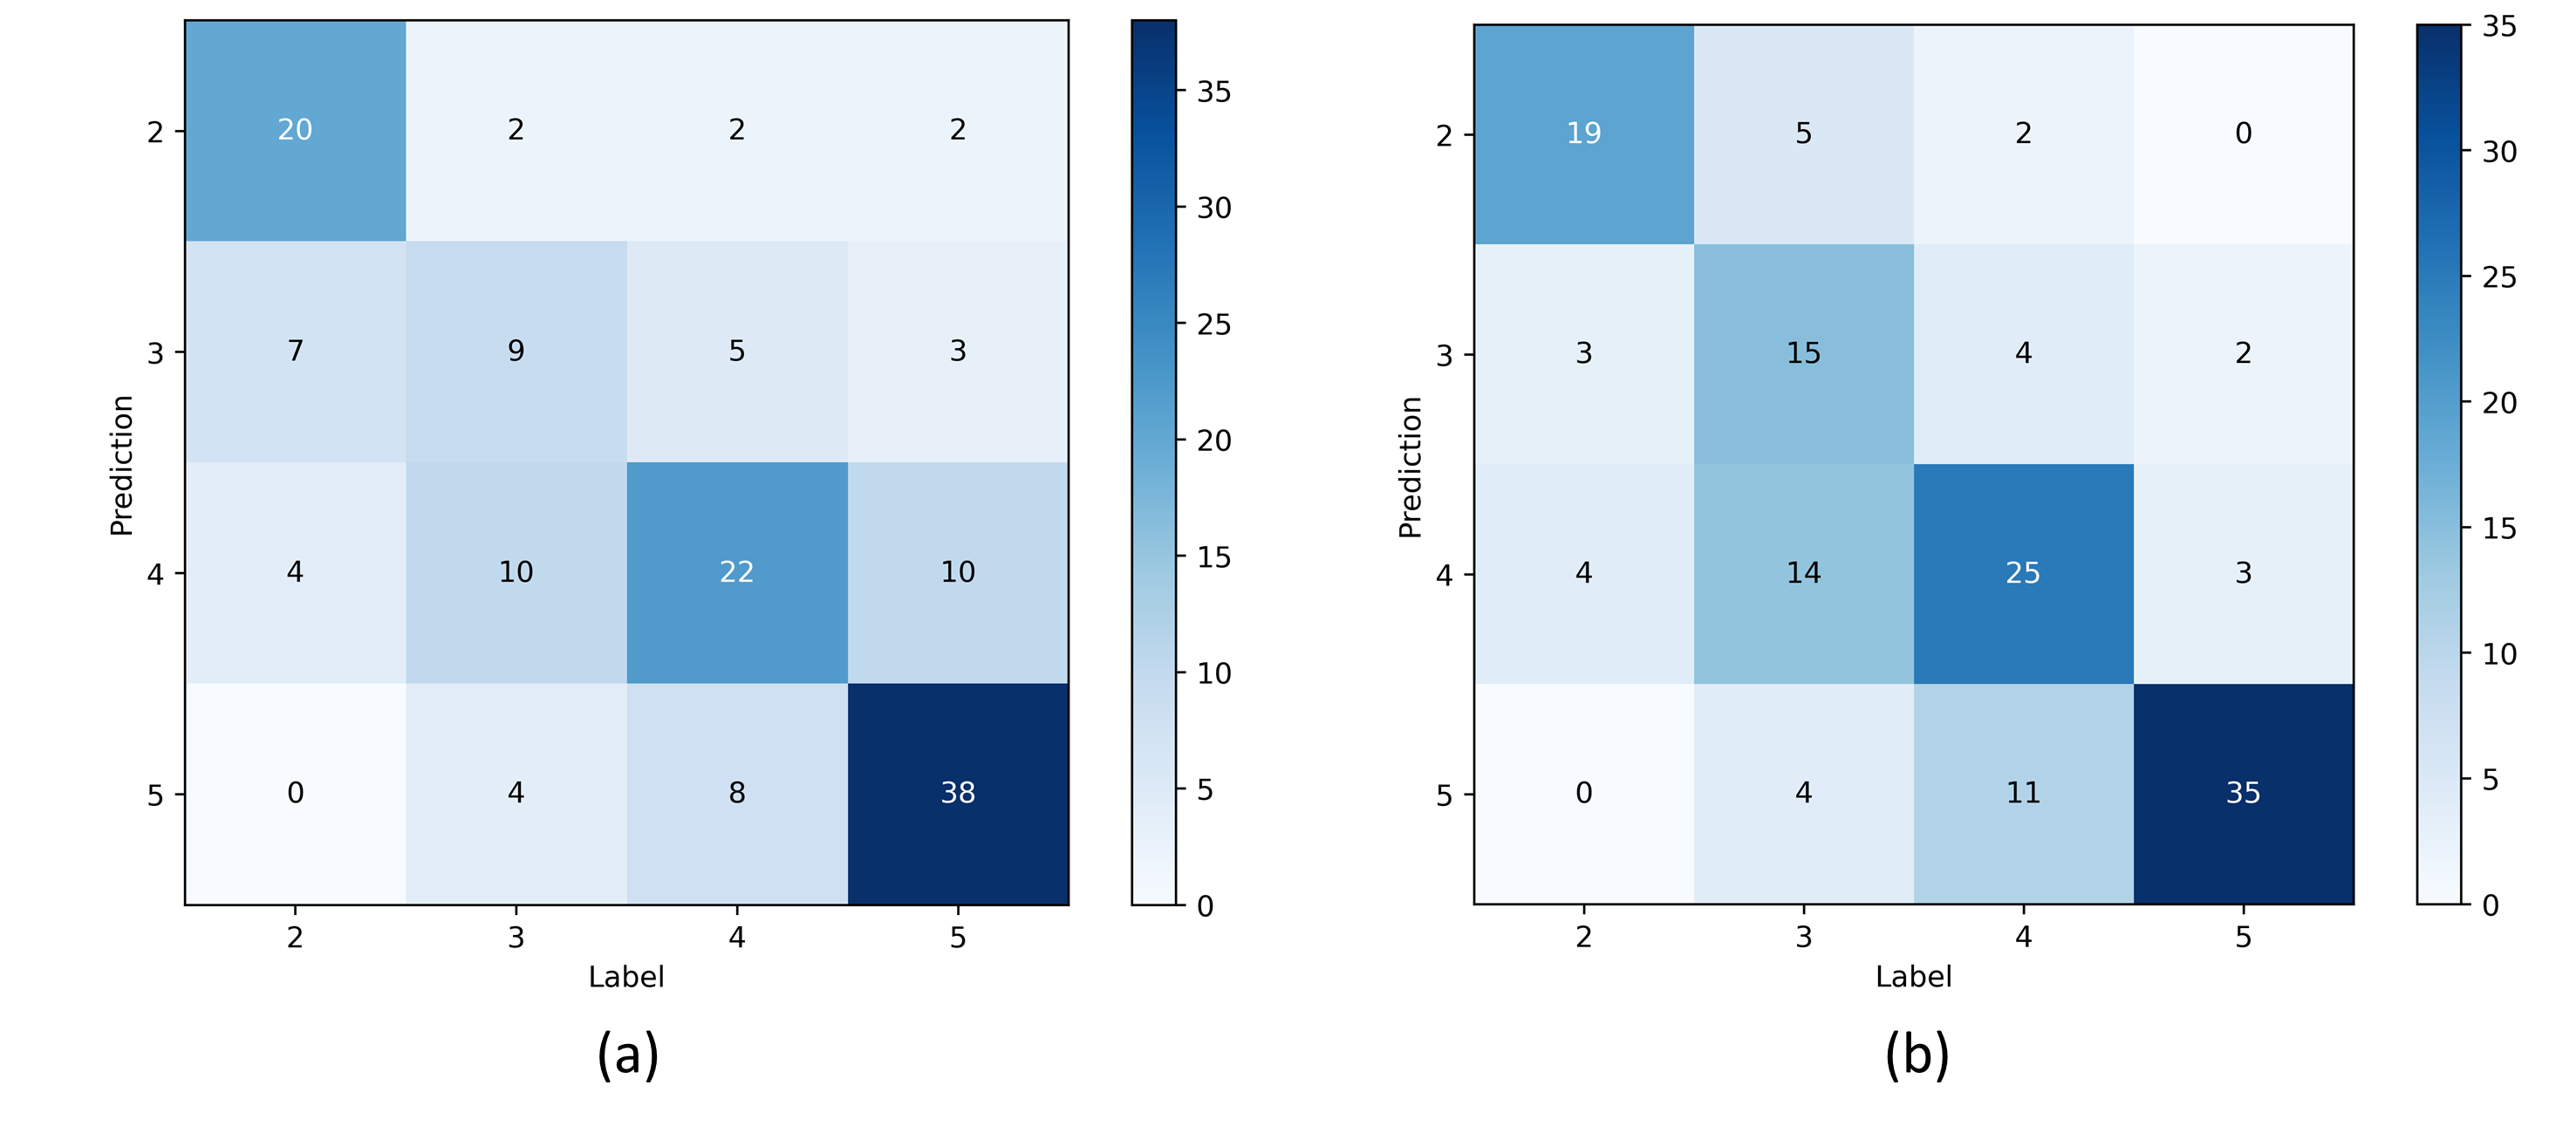
ResNet-UDM and ResNet-50 achieved an AUC of 0.640 and 0.584, respectively. The confusion matrix between model prediction and radiologist-reported values were shown in Figure 2. ResNet-UDM was found to be more consistent with the radiologist.The comparison of proposed model and a previous study3 is show in Table 1. We found that ResNet-UDM performed better than Thomas’s work in terms of PS=2/3/4. The overall accuracy of our model is 64.4%, which is higher than that of the previous work (56.0%). The ratio of the predicted results being in the range of ground truth±1 is 91.7%.
Discussion and Conclusion
We incorporated UDM into a ResNet-50 for PI-RADS classification. The proposed ResNet-UDM performed better than the baseline ResNet-50.The advantage of the UDM used in the proposed model lies in that it treated the PI-RADS classification as an ordinal classification instead of a simple multi-class classification. The ResNet-50 network output a higher value for a lesion with a higher probability of being clinically significant cancer. The threshold values were also learnt, which makes the discretization process self-learnt and adaptive.
Our study also has its limitations. The model was trained using PI-RADS classification by one radiologist, thus it might have label-specific bias. A dataset labelled by several experts may help train a more robust model. Further, pathological results, such as Gleason grade can be used to improve the performance of the model.
In conclusion, we extended UDM method for PI-RADS classification on mp-MRI. Our model yielded a better prediction than the baseline ResNet-50.
Acknowledgements
No acknowledgement found.References
1. Smith CP, Harmon SA, Barrett T, et al. Intra‐and interreader reproducibility of PI‐RADSv2: A multireader study. Journal of Magnetic Resonance Imaging. 2019;49(6):1694-703.
2. Shen D, Wu G, Suk HI. Deep learning in medical image analysis. Annual review of biomedical engineering. 2017;19:221-248.
3. Sanford T, Harmon SA, Turkbey EB, et al. Deep‐Learning‐Based Artificial Intelligence for PI‐RADS Classification to Assist Multiparametric Prostate MRI Interpretation: A Development Study. Journal of Magnetic Resonance Imaging. 2020;52(5):1508-1509.
4. Wu B, Sun X, Hu L, et al. Learning with unsure data for medical image diagnosis. Proceedings of the IEEE International Conference on Computer Vision. 2019: 10590-10599.
Figures