0817
Texture-Based Deep Learning for Prostate Cancer Classification with Multiparametric MRI1Department of Radiological Sciences, University of California, Los Angeles, Los Angeles, CA, United States, 2Physics and Biology in Medicine IDP, University of California, Los Angeles, Los Angeles, CA, United States, 3Departments of Radiology and Biomedical Engineering, Stony Brook University, Stony Brook, New York, NY, United States, 4Department of Urology, University of California, Los Angeles, Los Angeles, CA, United States, 5National Heart and Lung Institute, Imperial College London, London, United Kingdom
Synopsis
Accurate classification of prostate cancer (PCa) enables better prognosis and selection of treatment plans. We presented a textured-based deep learning method to enhance prostate cancer classification performance by enriching deep learning with prostate cancer texture information.
Introduction
Prostate cancer (PCa) is the second common cause of cancer-related deaths in men worldwide [1]. Classification of prostate cancer allows improved prognosis and treatment plans and thus minimizing prostate cancer mortality [2]. The current standardized method: Prostate Imaging Reporting and Data System version (PIRADS) [3], to interpret mpMRI is limited in assessing a PIRADS 3 lesion. It is reported by several studies that out of all PIRADS 3 lesions, only 16% and 35% were biopsy positive [4, 5].Convolutional neural networks (CNNs) have achieved great success in various non-medical and medical imaging tasks [6, 7]. Yet, large datasets are usually required to train a CNN model to reach satisfactory model performance and generalizability. This is one of the main challenges that limits the comprehensive translation and application of CNN-based models to medical imaging. Texture analysis, which explores the texture features within a region of interest, is commonly regarded as a footprint and ecology of tumor evolution [8]. The gray-level co-occurrence matrix (GLCM) descriptor examines the texture features by considering the pixel's spatial dependence and arrangement from the raw image [9]. The texture analysis may overcome the current challenges associated with large training datasets but commonly requires the tedious designing process, including handcrafted feature engineering.In this study, we proposed a texture-based deep learning (textured-DL) model for the automated PCa classification. Our underlying assumption is that the GLCM matrix can provide defined anatomical and functional features within the tumor lesion, and CNN via being trained on the texture features would enhance the ability to differentiate clinically significant PCa (csPCa) without requiring large datasets for training. The proposed texture-DL model was trained for the classification of csPCa, where all lesion findings were verified by histopathology. We compared the classification performance of textured-DL with that of conventional deep learning and PIRADS-based prediction.Materials and Methods
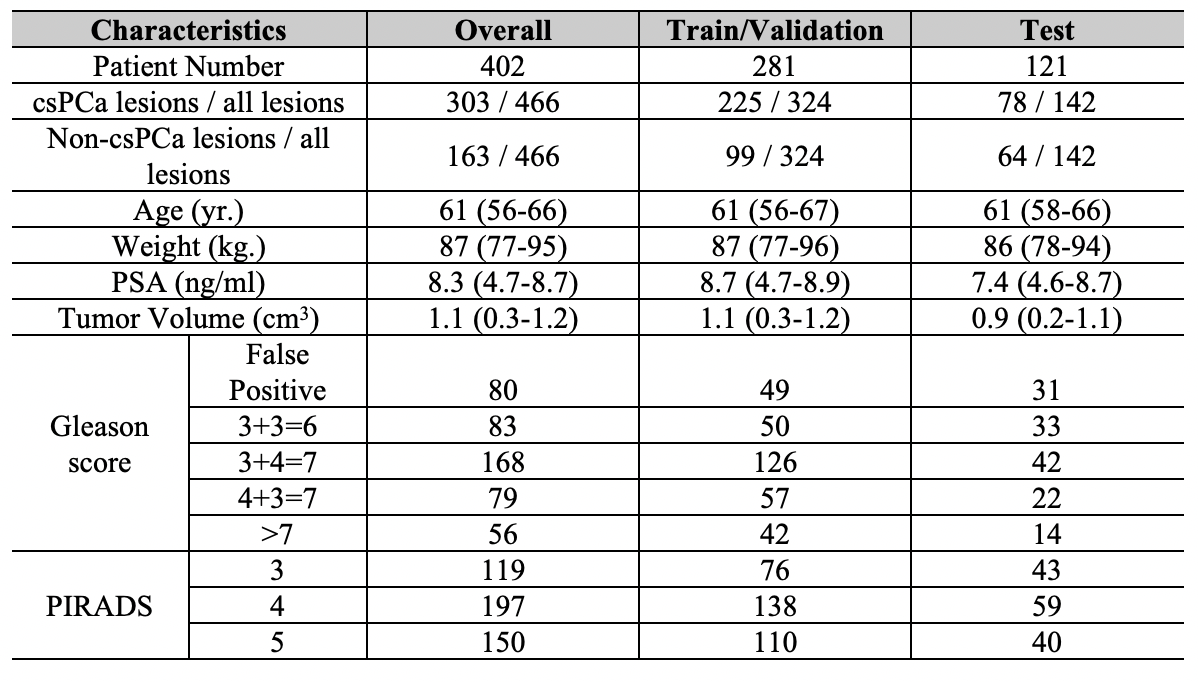
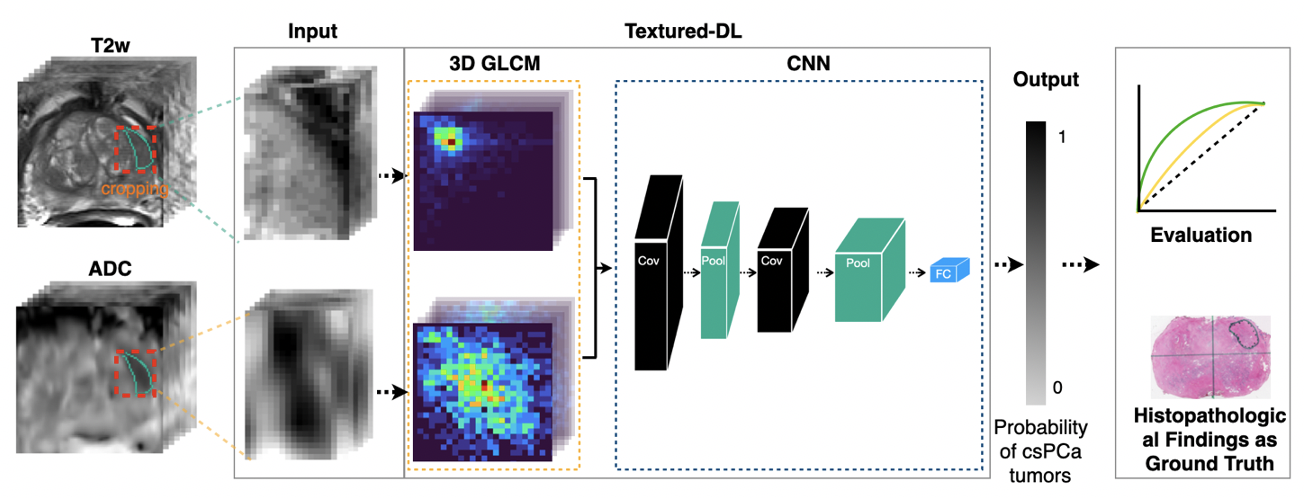
A total of 402 patients, who underwent 3T mpMRI prior to radical prostatectomy [10], were included in this study. Three genitourinary radiologists (10+ years of prostate MRI experience) identified positive MRI findings (PIRADS≥3). All identified lesions, matched with whole-mount histopathology (WMHP), categorized by csPCa with GS≥3+4, indolent PCa with GS=3+3, and false positives. Table 1 shows the patients' and tumors' detailed characteristics, stratified by Gleason score and PIRADS.Figure 1 showed the proposed texture-based deep learning (textured-DL) model workflow, which consisted of a 3D GLCM extractor and a CNN. The 3D rectangular patches that closely surround a given PCa lesion on T2-weighted (T2w) and apparent diffusion coefficient (ADC) images were firstly cropped and normalized to 0-255, which then was fed into the textured-DL. In the textured-DL, 3D GLCM extractors were used to extract the 3D GLCMs from each volumetric patch (T2w and ADC). Unlike the 2D GLCM, which only considers the in-plane pixel adjacency, 3D GLCM included the through-plane voxel adjacency. Concatenation of two GLCMs was served as an input to CNN. In the end, the textured-DL outputted the probability of being a csPCa lesion for a given positive MRI finding (PIRADS≥3).We implemented a conventional deep learning model as the baseline method, where the 3D rectangular patches were directly fed into CNN excluding the 3D GLCM. The PIRADS-based classification (PIRADS≥4) was also used as an expert-based baseline in comparison with textured-DL. The patient cohort was randomly split into three sub-datasets, including training (n=239; 60%), validation (n=42; 10%) and testing (n=121; 30%) datasets. Area under the ROC (AUC) curve, sensitivity, and specificity were used to evaluate all models (PIRADS, CNN, and textured-DL). The 95% Confident Interval (CI) of the AUC was calculated by bootstrapping. 95% CI of the sensitivity and specificity were calculated by the Wald method [11], and the model sensitivity and specificity were selected by the Youden index [12]. Statistical significance was defined as a p-value <0.05. AUC comparisons between the methods and PIRADS were performed by DeLong test [13]. Comparisons of sensitivity and specificity were performed by Mcnemar's test [14].Results
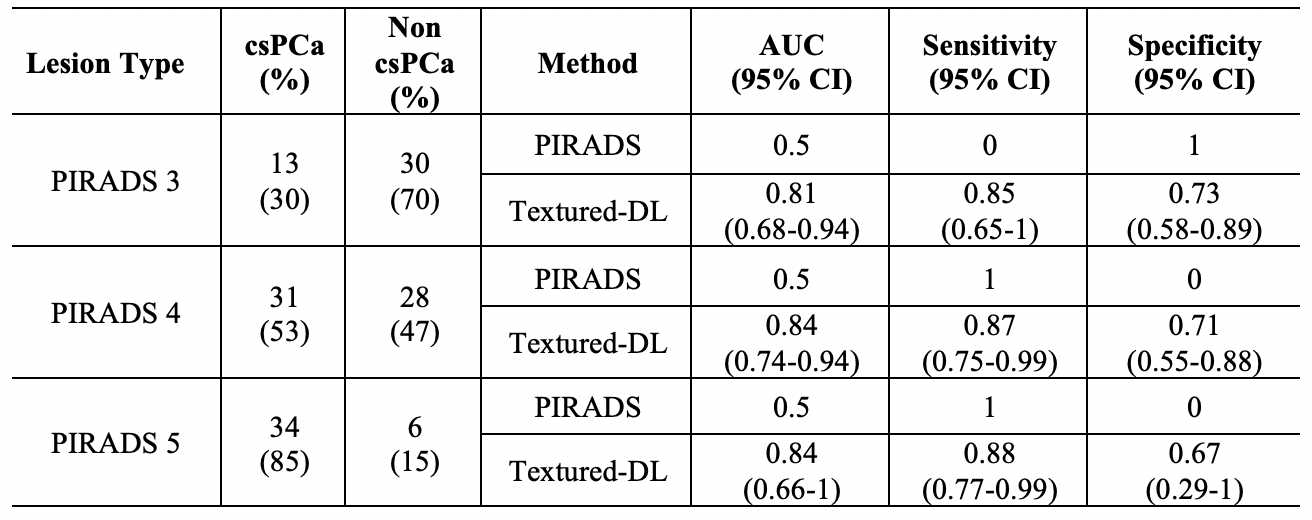
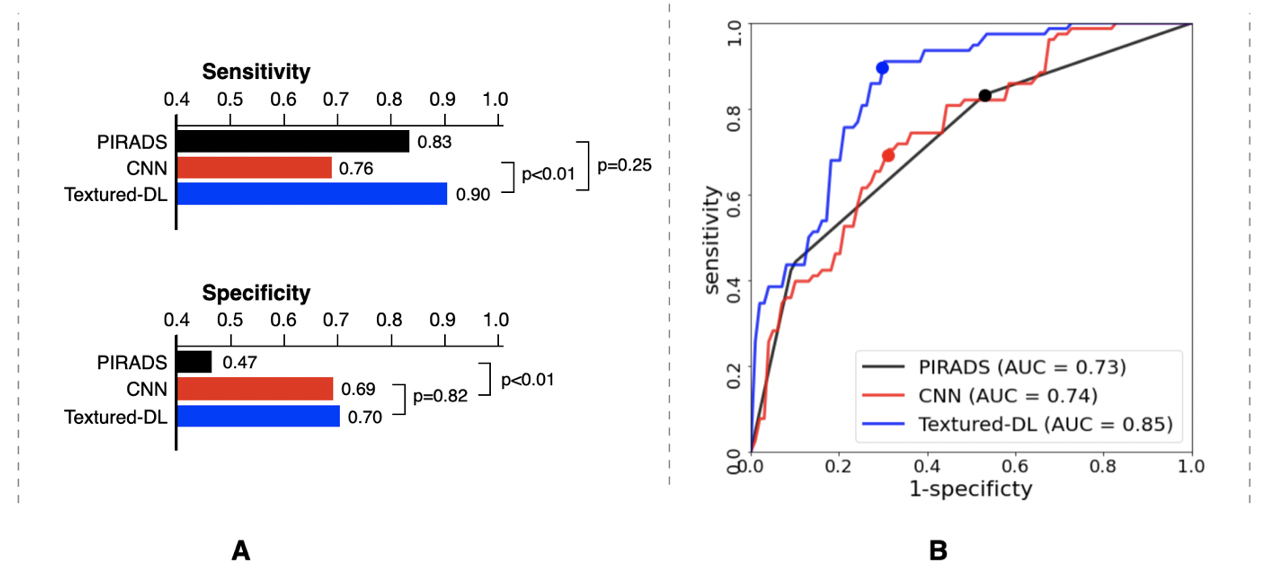
Figure 2 shows the classification performance among PIRADS, CNN and textured-DL. The textured-DL model demonstrated an AUC of 0.85, significantly higher than both CNN (AUC of 0.74; p<0.01) and PIRADS (AUC of 0.73; p<0.01). The textured-DL also achieved higher sensitivity and specificity (0.90 and 0.70) than both CNN and PIRADS, significantly different between CNN and textured-DL in sensitivity (p<0.01) and between PIRADS and textured-DL in specificity (p<0.01).We also conducted the sub-analysis on the classification performance difference between PIRADS and textured-DL in lesions with PIRADS categories 3, 4, and 5 (Table 2). We found that textured-DL performed better across all lesions with different PIRADS categories. There exist 13 PIRADS 3 lesions that were csPCa, and textured-DL correctly classified 11 of those as csPCa. Besides, 28 PIRADS 4 lesions were non-csPCa, and 20 were correctly classified by textured-DL.
Conclusion
We proposed a new texture-based deep learning (textured-DL) method for the automated prostate cancer classification using 3T mpMRI. The proposed textured-DL was superior to PIRADS and conventional CNN in the classification of clinically significant prostate cancer. We believe that our proposed deep learning can serve as a useful tool to help reduce unnecessary biopsies.Acknowledgements
This research was supported by the National Institutes of Health (NIH), grant number R01- CA248506 and funds from the Integrated Diagnostics Program, Department of Radiological Sciences & Pathology, David Geffen School of Medicine at UCLA.References
1. Ghafoori M, Alavi M, Aliyari Ghasabeh M (2013) MRI in Prostate Cancer. Iran Red Crescent Med J. doi: 10.5812/ircmj.16620
2. Ahmed HU, Akin O, Coleman JA, Crane S, Emberton M, Goldenberg L, Hricak H, Kattan MW, Kurhanewicz J, Moore CM, others (2012) Transatlantic Consensus Group on active surveillance and focal therapy for prostate cancer. BJU Int 109:1636–1647.
3. Turkbey B, Rosenkrantz AB, Haider MA, Padhani AR, Villeirs G, Macura KJ, Tempany CM, Choyke PL, Cornud F, Margolis DJ, others, Thoeny HC, Verma S, Barentsz J, Weinreb JC (2019) Prostate Imaging Reporting and Data System Version 2.1: 2019 Update of Prostate Imaging Reporting and Data System Version 2. Eur Urol. doi: 10.1016/j.eururo.2019.02.033
4. Ahmed HU, Bosaily AE-S, Brown LC, Gabe R, Kaplan R, Parmar MK, Collaco-Moraes Y, Ward K, Hindley RG, Freeman A, others (2017) Diagnostic accuracy of multi-parametric MRI and TRUS biopsy in prostate cancer (PROMIS): a paired validating confirmatory study. Lancet 389:815–822.
5. van der Leest M, Cornel E, Israël B, Hendriks R, Padhani AR, Hoogenboom M, Zamecnik P, Bakker D, Setiasti AY, Veltman J, van den Hout H, van der Lelij H, van Oort I, Klaver S, Debruyne F, Sedelaar M, Hannink G, Rovers M, Hulsbergen-van de Kaa C, Barentsz JO (2019) Head-to-head Comparison of Transrectal Ultrasound-guided Prostate Biopsy Versus Multiparametric Prostate Resonance Imaging with Subsequent Magnetic Resonance-guided Biopsy in Biopsy-naïve Men with Elevated Prostate-specific Antigen: A Large Prospective M. Eur Urol 75:570–578.
6. Esteva A, Kuprel B, Novoa RA, Ko J, Swetter SM, Blau HM, Thrun S (2017) Dermatologist-level classification of skin cancer with deep neural networks. Nature 542:115–118.
7. Liu Y, Yang G, Mirak SA, Hosseiny M, Azadikhah A, Zhong X, Reiter RE, Lee Y, Raman SS, Sung K (2019) Automatic Prostate Zonal Segmentation Using Fully Convolutional Network With Feature Pyramid Attention. IEEE Access 7:163626–163632.
8. Gatenby RA, Grove O, Gillies RJ (2013) Quantitative imaging in cancer evolution and ecology. Radiology 269:8–14. 9. Tan J, Gao Y, Liang Z, Cao W, Pomeroy MJ, Huo Y, Li L, Barish MA, Abbasi AF, Pickhardt PJ (2019) 3D-GLCM CNN: A 3-Dimensional Gray-Level Co-Occurrence Matrix-Based CNN Model for Polyp Classification via CT Colonography. IEEE Trans Med Imaging 39:2013–2024.
10. Vaché T, Bratan F, Mège-Lechevallier F, Roche S, Rabilloud M, Rouvière O (2014) Characterization of prostate lesions as benign or malignant at multiparametric MR imaging: comparison of three scoring systems in patients treated with radical prostatectomy. Radiology 272:446–455.
11. Agresti A, Coull BA (1998) Approximate is better than “exact” for interval estimation of binomial proportions. Am Stat 52:119–126. 12. Fluss R, Faraggi D, Reiser B (2005) Estimation of the Youden Index and its associated cutoff point. Biometrical J J Math Methods Biosci 47:458–472.
13. DeLong ER, DeLong DM, Clarke-Pearson DL (1988) Comparing the areas under two or more correlated receiver operating characteristic curves: a nonparametric approach. Biometrics 837–845.
14. Eliasziw M, Donner A (1991) Application of the McNemar test to non-independent matched pair data. Stat Med 10:1981–1991.
Figures