0809
Generalizability of Deep-Learning Segmentation Algorithms for Measuring Cartilage and Meniscus Morphology and T2 Relaxation Times1Radiology, Stanford University, Stanford, CA, United States, 2Bioengineering, Stanford University, Stanford, CA, United States, 3Mechanical Engineering, Stanford University, Stanford, CA, United States, 4Philips Healthcare North America, Gainesville, FL, United States, 5Electrical Engineering, Stanford University, Stanford, CA, United States, 6Biomedical Data Science, Stanford University, Stanford, CA, United States
Synopsis
Automated segmentation using deep-learning can expedite segmentation tasks, but algorithm generalizability to unseen datasets is unknown. Here, we used two knee segmentation algorithms, each trained separately on Osteoarthritis Initiative double-echo steady-state (DESS) scans and quantitative DESS (qDESS) scans, to segment cartilage and meniscus from qDESS datasets from four independent studies. We compared manual-vs-automatic segmentation accuracy for morphology and T2 map variations. We show that OAI-DESS-trained models may be suitable for quantifying relaxometry parameters in qDESS datasets but likely require fine-tuning to accurately quantify cartilage morphology. In contrast, qDESS-trained models generalize well to additional qDESS datasets for both morphology and T2.
Introduction
Cartilage morphology and T2 relaxation times have shown potential for detecting changes during early osteoarthritis (OA)1-3. Methods such as the quantitative double-echo in steady-state (qDESS) sequence allow for rapid generation of accurate T2 relaxometry maps and morphometry measurements4,5, but require manual tissue segmentation, a time-consuming, error-prone process6. qDESS is a multi-echo sequence with separate echoes that can be combined using root-sum-of-squares to mimic the single-echo DESS sequence contrast. Deep-learning (DL) based automatic segmentation can expedite this segmentation process7,8, and previous algorithms trained and tested on Osteoarthritis Initiative (OAI) DESS scans have achieved high segmentation accuracies9,10. However, generalizability of these techniques to sequence variations and different datasets, such as qDESS, has not been assessed.In this study, we compare the generalizability of automated cartilage and meniscus segmentation on four separate qDESS datasets using two DL segmentation models: one trained on the OAI-DESS dataset and another on a domain-specific qDESS dataset. We investigate model generalizability by evaluating the accuracy of cartilage and meniscus T2 values and morphology.
Methods
The evaluation dataset of sagittal qDESS scans was acquired from four studies, with varying participant health and image acquisition parameters for 56 total subjects (75 knees). Studies 1 and 2 consisted of healthy subjects, study 3 consisted of OA subjects with Kellgren-Lawrence (KL) grades of 1-3, and study 4 consisted of clinical patients who subsequently underwent arthroscopic surgery following internal derangement. All scan parameters are shown in Figure 1. Trained readers segmented femoral cartilage in studies 1-4 along with tibial cartilage and meniscus in study 4.For all studies, the OAI-trained and qDESS-trained models (trained on 120 and 86 scans, respectively) were used to automatically segment femoral cartilage, and tibial cartilage and meniscus for study 4. An open-source software (DOSMA) was used to automatically generate T2 maps for all segmentations. All cartilage was sub-divided into deep and superficial zones, with the femoral cartilage also divided into anterior, central, and posterior zones, and the tibial cartilage into anterior and posterior zones11,12.
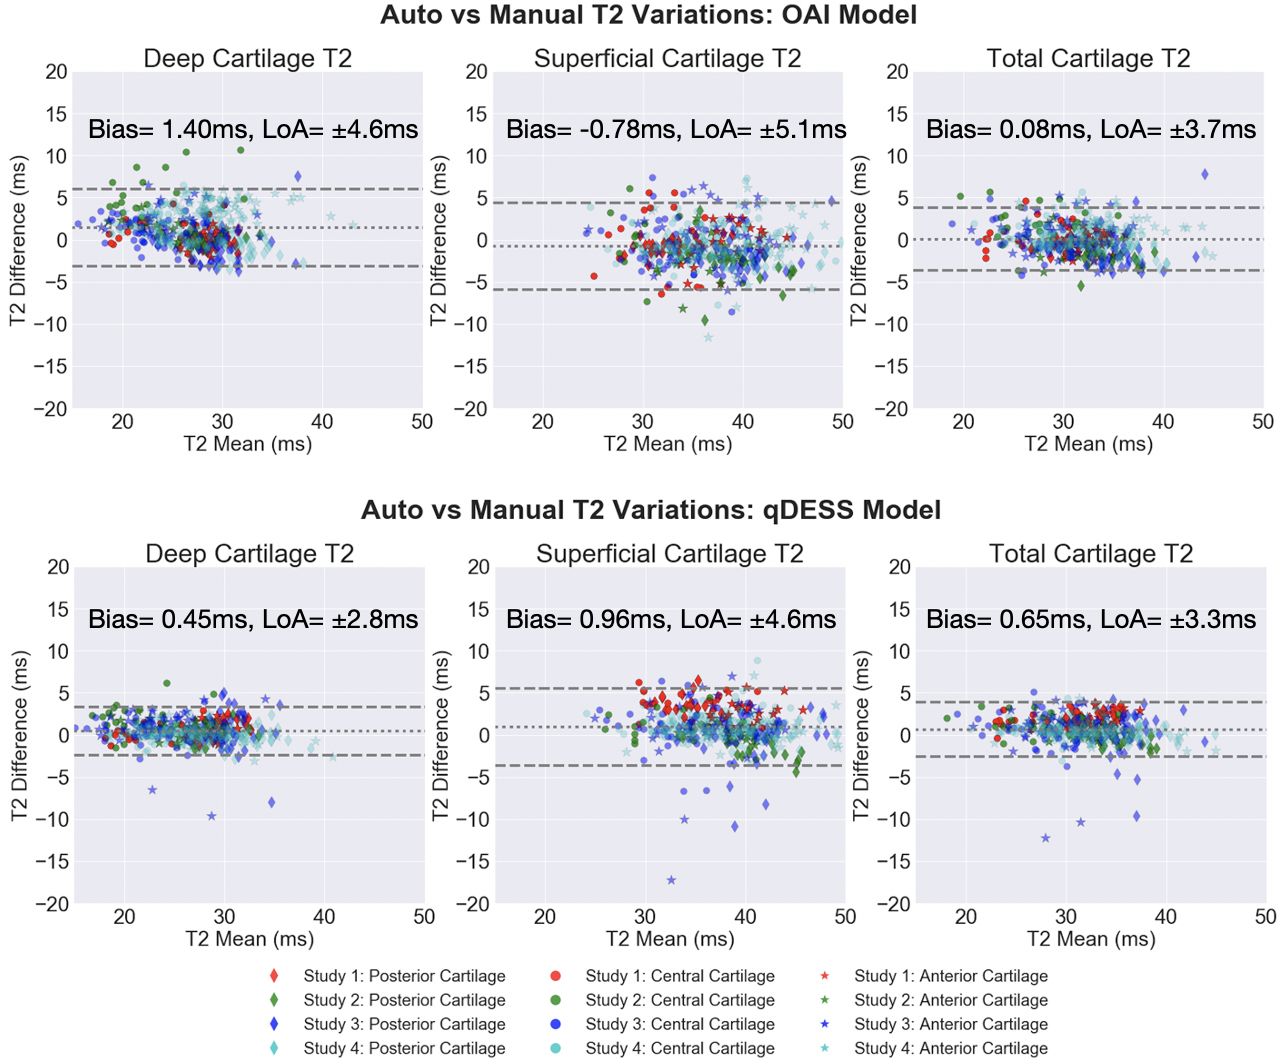
The volumetric Dice similarity coefficient (DSC) and tissue volumes were used to assess pixel-wise accuracy between manual and automatic segmentations and were tested with Wilcoxon rank-sum tests. Variations in estimated T2 and tissue volume between manual and automatic segmentations were quantified with Lin’s Concordance Correlation Coefficient (CCC), root-mean-squared error coefficient of variation (RMSE-CV%), and Wilcoxon rank-sum tests. Bland-Altman plots were used to visualize manual-automatic T2 variations.
Results
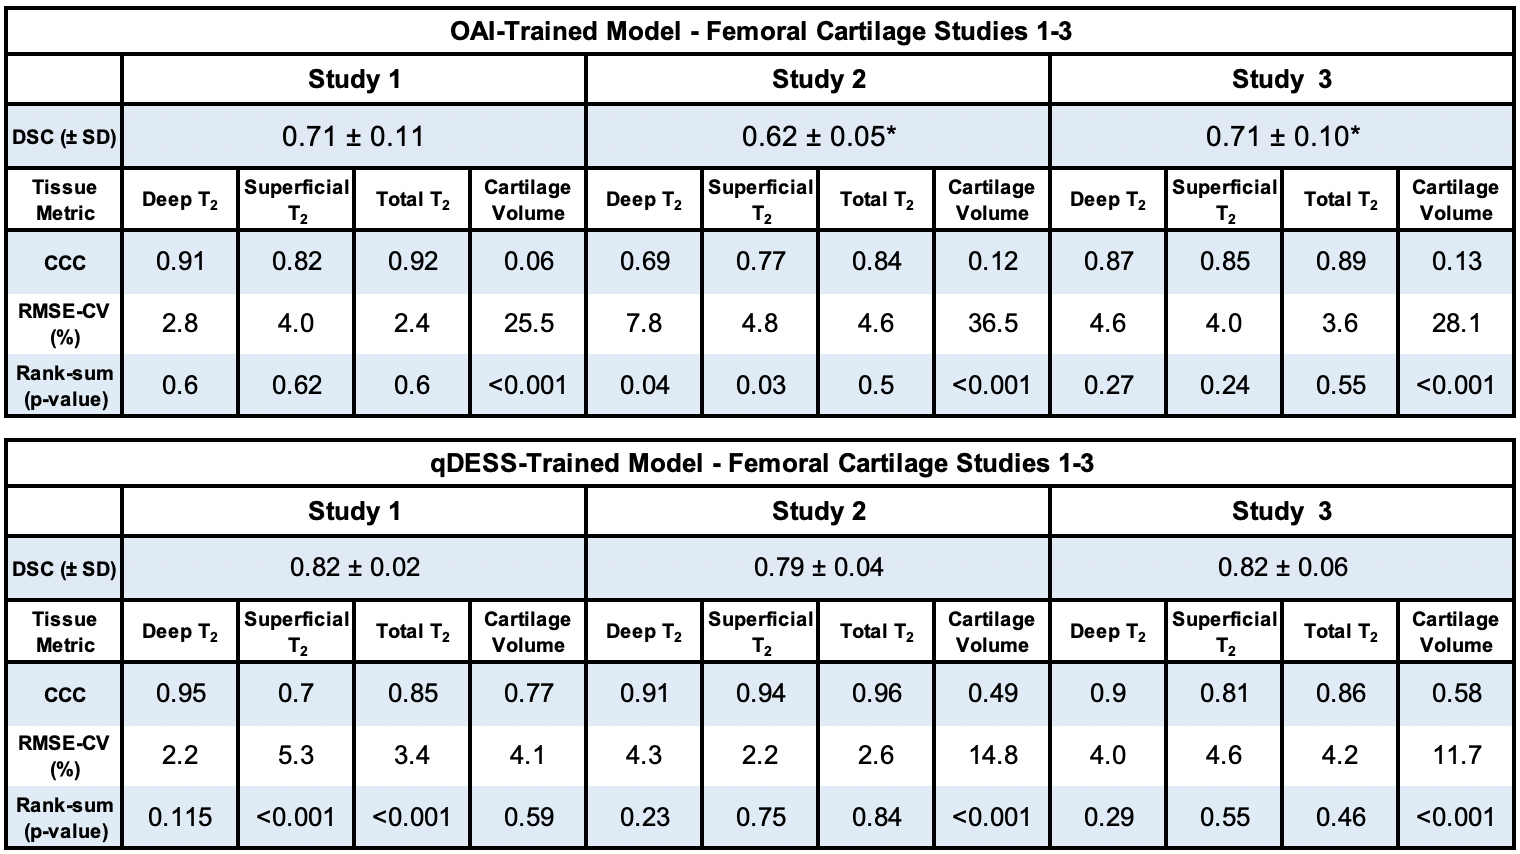
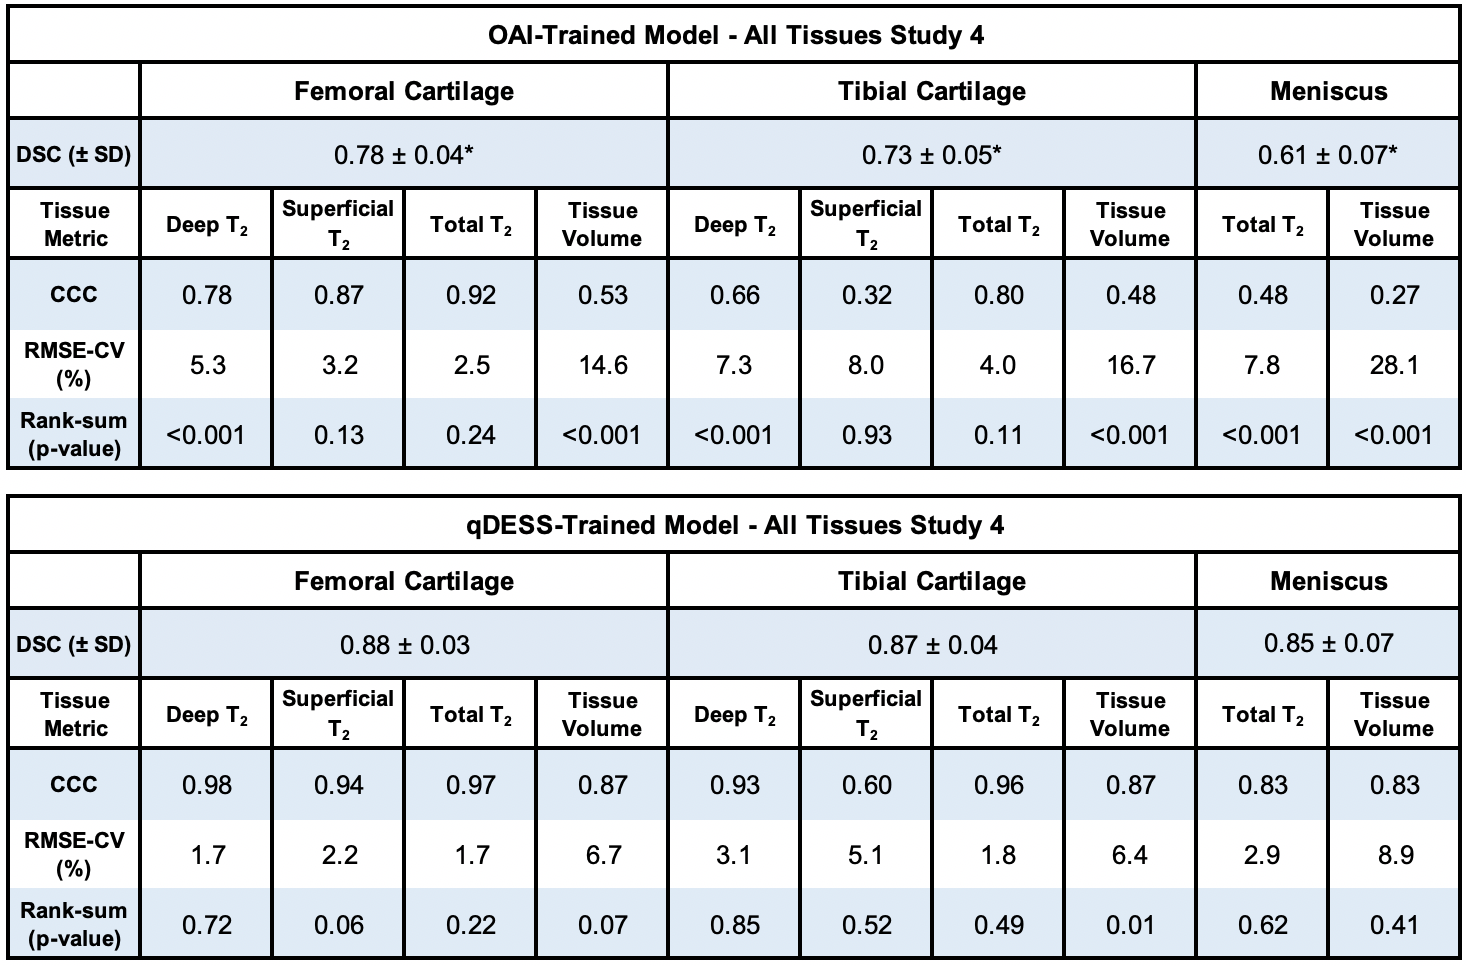
DSCs for the qDESS-trained model ranged from 0.79-0.88 and were significantly higher (p<0.001, for all studies except study 1 [p=0.054]) than DSCs for the OAI-trained model, which ranged from 0.61-0.78 (all values shown in figures 3 and 4). Tissue volume CCC values for the qDESS-trained model were higher than the OAI-trained model values.Bland-Altman plots showed slightly reduced 95% limits of agreement (LoA) for manual-automatic T2 variations for all layers of femoral cartilage for the qDESS-trained model compared to the OAI-trained model. Femoral cartilage T2 CCC values were high, with the qDESS-trained model having higher values than the OAI-trained model. In study 4, tibial cartilage and meniscus T2 CCC values were moderate to high for the qDESS-trained model and low to moderate for the OAI-trained model.
The most significant manual-automatic T2 variations were seen in the deep and total femoral cartilage of study 1 for the qDESS-trained model and in the deep tibial and femoral cartilage and meniscus of study 4 for the OAI-trained model (p<0.001). For both models no consistent trends were evident in variations between deep and superficial cartilage regions or between anatomical sub-regions.
Discussion
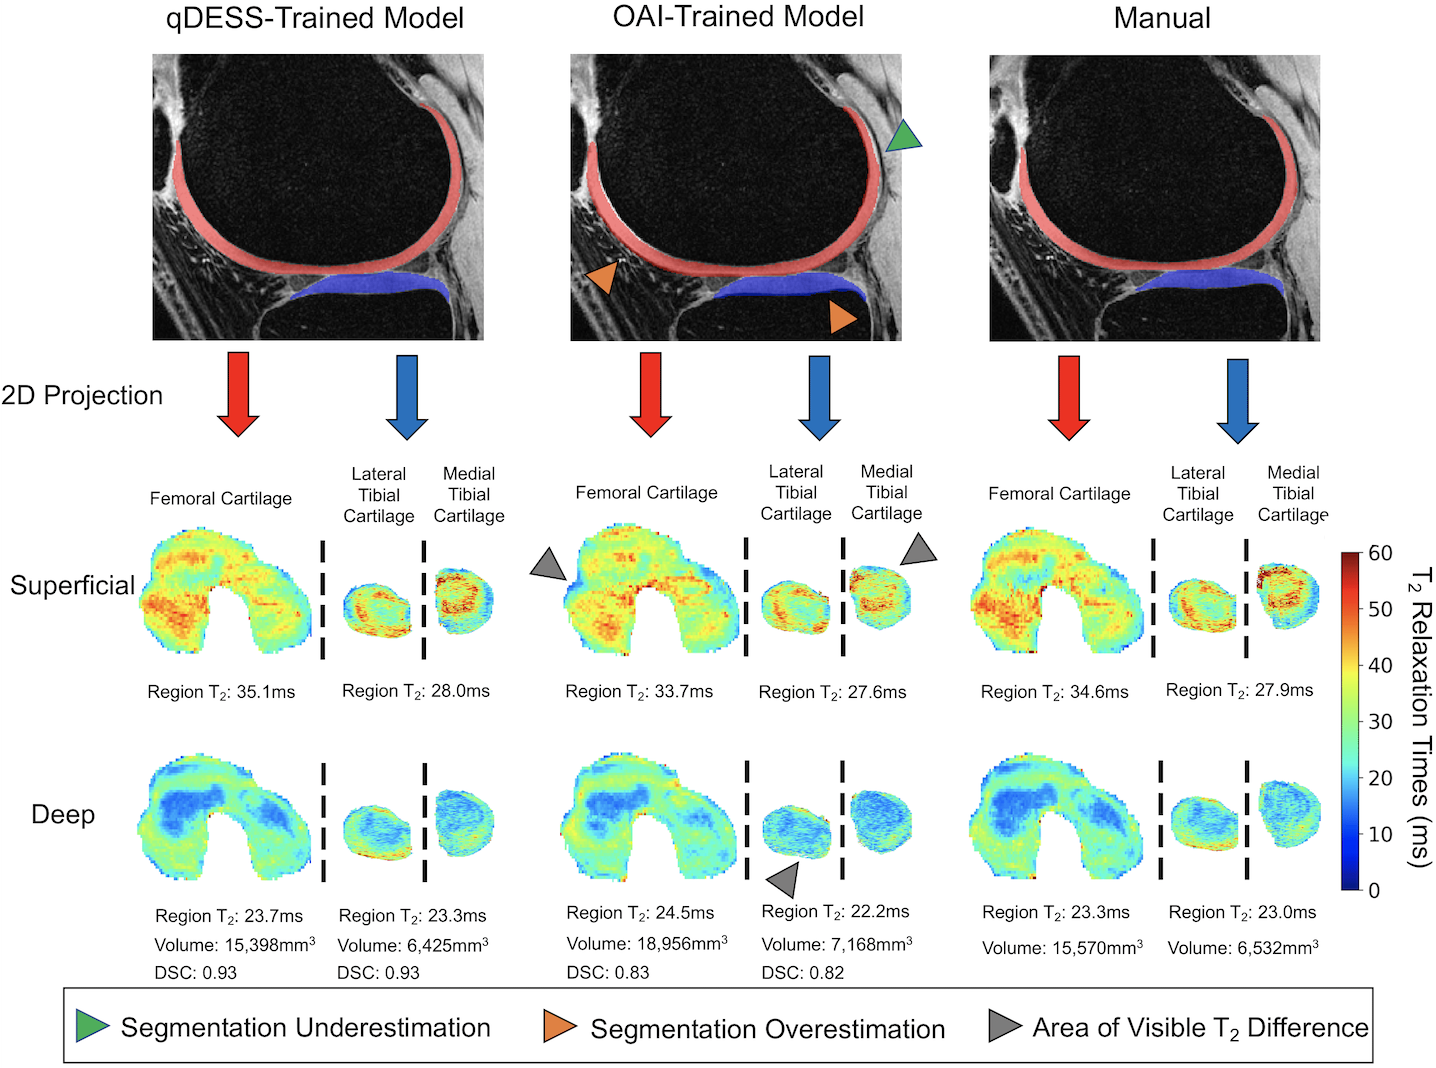
The segmentation accuracy of the qDESS-trained model across all studies and tissues was comparable to manual segmentations across the four studies10. The OAI-trained model consistently overestimated tissue volume, which resulted in considerably lower segmentation accuracy for all studies and tissues. Overall, despite similar contrast and resolution, DESS and qDESS data have sufficiently different data distributions, resulting in lower generalizability of OAI-trained models to unseen qDESS image sets.For both models, the LoA for manual-automatic T2 variations was similar to the current state-of-the-art quantitative MRI segmentation models13. Despite a lower segmentation accuracy, the OAI-trained model had similar manual-automatic T2 variations to the qDESS-trained model. The discordance between volume and T2 performance may be explained by the fact that T2 is averaged across a sub-region with multiple pixels. This suggests low DSC may not be indicative of manual-automatic T2 variations. Furthermore, existing pre-trained models may be suitable for quantifying relaxometry parameters but not morphology parameters.
Compared to the OAI-trained model, the qDESS-trained model performed consistently better across datasets and tissues, suggesting improved generalizability to variations in patient characteristics and imaging parameters. Prevalence and severity of OA varied between studies, but no consistent trends were evident based on disease status for either model, which suggests potential generalizability to datasets with varied subject health including mixed clinical populations.
Conclusion
Using data from four different studies and two segmentation models, we demonstrate that OAI-DESS-trained models may be suitable for quantifying relaxometry parameters in qDESS datasets but likely require fine-tuning to quantify morphology. Further, qDESS-trained models generalize well to additional research and clinical qDESS datasets with varying pathology for both cartilage and meniscus morphology and T2.Acknowledgements
We would like to acknowledge our funding sources: National Institutes of Health (NIH) grant numbers, NIH R01-AR077604, R00 EB022634, R01 EB002524, R01-AR074492, K24 AR062068, and P41 EB015891. GE Healthcare, Philips, and Stanford Medicine Precision Health and Integrated Diagnostics.References
1. Dardzinski BJ, Mosher TJ, Li S, Van Slyke MA, Smith MB: Spatial variation of T2 in human articular cartilage. Radiology 1997; 205:546–550.
2. Mosher TJ, Dardzinski BJ, Smith MB: Human articular cartilage: influence of aging and early symptomatic degeneration on the spatial variation of T2--preliminary findings at 3 T. Radiology 2000; 214:259–266.
3. David-Vaudey E, Ghosh S, Ries M, Majumdar S: T2 relaxation time measurements in osteoarthritis. Magn Reson Imaging 2004; 22:673–682.
4. Matzat SJ, McWalter EJ, Kogan F, Chen W, Gold GE: T2 Relaxation time quantitation differs between pulse sequences in articular cartilage. J Magn Reson Imaging 2014; 00:105–113.
5. Chaudhari AS, Black MS, Eijgenraam S, et al.: Five-minute knee MRI for simultaneous morphometry and T 2 relaxometry of cartilage and meniscus and for semiquantitative radiological assessment using double-echo in steady-state at 3T. J Magn Reson Imaging 2018; 1328–1341.
6. Eckstein, F., Kwoh, C. K., & Link, T. M. (2014). Imaging research results from the Osteoarthritis Initiative (OAI): A review and lessons learned 10 years after start of enrolment. Annals of the Rheumatic Diseases. 2014; 73:1289-1300.
7. Liu F, Zhou Z, Jang H, Samsonov A, Zhao G, Kijowski R. Deep convolutional neural network and 3D deformable approach for tissue segmentation in musculoskeletal magnetic resonance imaging. Magn Reson Med. 2018.
8. Pedoia V, Norman B, Mehany SN, Bucknor MD, Link TM, Majumdar S: 3D convolutional neural networks for detection and severity staging of meniscus and PFJ cartilage morphological degenerative changes in osteoarthritis and anterior cruciate ligament subjects. J Magn Reson Imaging 2019; 49:400–410.
9. Peterfy, C. G., Schneider, E. & Nevitt, M. The osteoarthritis initiative: report on the design rationale for the magnetic resonance imaging protocol for the knee. Osteoarthr. Cartil. 16, 1433–1441 (2008).
10. Desai, A. D., Caliva, F., Iriondo, C., Khosravan, N., Mortazi, A., Jambawalikar, S., ... & Chaudhari A.S (2020). The International Workshop on Osteoarthritis Imaging Knee MRI Segmentation Challenge: A Multi-Institute Evaluation and Analysis Framework on a Standardized Dataset. arXiv preprint arXiv:2004.14003.
11. Desai, A. D., Barbieri, M., Mazzoli, V., Rubin, E., Black, M. S., Watkins, L., … Chaudhari, A. S. (2019). DOSMA: A deep-learning, open-source framework for musculoskeletal MRI analysis. Proc. International Society for Magnetic Resonance in Medicine, Montreal, 1135.
12. Monu UD, Jordan CD, Samuelson BL, Hargreaves BA, Gold GE, McWalter EJ. Cluster analysis of quantitative MRI T2 and T1ρ relaxation times of cartilage identifies differences between healthy and ACL-injured individuals at 3T. Osteoarthritis and cartilage 2017;25(4):513-520.
13. Norman B, Pedoia V, Majumdar S: Use of 2D U-Net Convolutional Neural Networks for Automated Cartilage and Meniscus Segmentation of Knee MR Imaging Data to Determine Relaxometry and Morphometry. Radiology 2018; 000:172322.
Figures
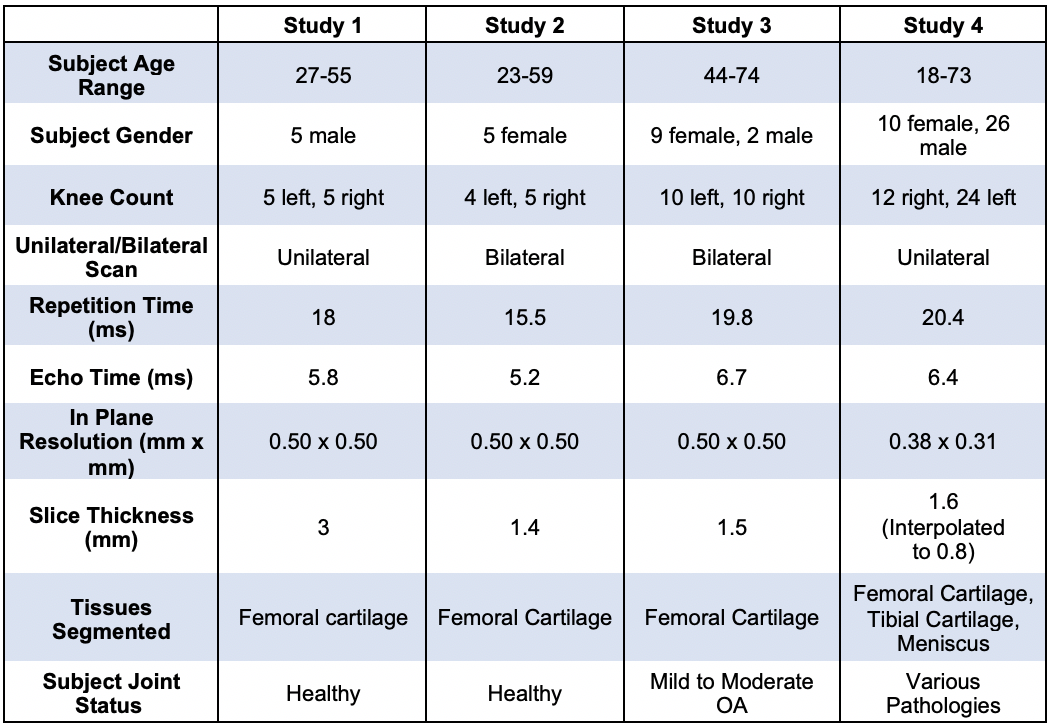
Data characteristics of the subjects and scan sequences for all studies in evaluation dataset.