0804
Feasibility of deep learning–based automated rotator cuff tear measurements on shoulder MRI
Dana Lin1, Michael Schwier2, Bernhard Geiger2, Esther Raithel3, and Michael Recht1
1NYU Grossman School of Medicine, New York, NY, United States, 2Siemens Medical Solutions USA, Princeton, NJ, United States, 3Siemens Healthcare GmbH, Erlangen, Germany
1NYU Grossman School of Medicine, New York, NY, United States, 2Siemens Medical Solutions USA, Princeton, NJ, United States, 3Siemens Healthcare GmbH, Erlangen, Germany
Synopsis
Rotator cuff tear size is a critical determinant of patient prognosis and surgical outcomes. Radiologists routinely make rotator cuff measurements as part of their MRI interpretation, which can be tedious and subject to variation among readers. This lends itself to a potential application for deep learning to increase efficiency and decrease variability in this task. In this study, we developed a DL model to generate measurements for full-thickness supraspinatus tendon tears.
Introduction
Rotator cuff disease is one of the most common musculoskeletal conditions, affecting up to 17 million people in the United States.1 When tendon tears lead to surgery, the total direct annual expenditure estimates for rotator cuff repair range from US$3 billion to US$12 billion.1 Rotator cuff tear size plays a critical role in surgical planning and is directly related to patient prognosis and surgical outcomes.2,3 For this reason, radiologists routinely provide rotator cuff tear measurements in their MRI interpretations. These measurements can be tedious and variable among readers, serving as a potential target for an automated solution. Building on our prior work demonstrating the feasibility of deep learning (DL) diagnosis of rotator cuff tears,4 the purpose of this study was to develop a DL model prototype that can generate automated rotator cuff tear measurements on shoulder MRI.Methods
A total of 730 supraspinatus full-thickness tear cases were annotated and subsequently verified by a musculoskeletal radiologist. The annotations comprised mediolateral (ML) and anteroposterior (AP) measurements as well as segmentation masks of the tear areas on coronal oblique and sagittal oblique fluid-sensitive fat-suppressed sequences. Training/validation/testing split was 552/74/104.Measurements were extracted via 2 steps:
- Segment the area of the tear in 3d.
- Extract a 2d (in-slice) distance from the segmentation.
The segmentation stage was implemented using a 3D U-Net convolutional neural network architecture.5 Independent models were trained for ML and AP measurements. Training was set up with Adam optimization and a learning rate of 0.0001. We employed and customized the Dice-Loss6 by introducing a Euclidean-distance-weighting, which penalizes misclassified voxels far away from the target mask stronger than voxels closer to it. This approach helps to stabilize the training and yields a focused segmentation of the tear area. Training was stopped when for 200 consecutive epochs no decrease of loss was observed on the validation data. The model with the lowest validation loss was selected.
In step 2, the resulting probability map was turned into a binary segmentation by thresholding at 0.5. The 3d mask was split into 2d-per-slice connected components. The final measurement was extracted as the largest diameter of the largest 2d component.
Results
Example concordant and discordant measurements by the algorithm and reference are shown in Figure 1. The mean length differences and measurement location distances between algorithm and reference were approximately 5 and 7 mm, respectively, with mean slice offset of around 1 (Figure 2). The distributions of measurement location differences between algorithm and reference showed that most location differences were < 5 mm (Figure 3), although outliers ranged up to 3 cm. Slice offset histogram demonstrated offset of mostly 0-1 slice (Figure 4). Bland Altman plot of length differences between algorithm and reference showed no systematic or proportional bias for ML measurements (Figure 5). The same was true for the Bland Altman plot of AP measurements (not shown).Discussion
We developed a DL model prototype to generate rotator cuff measurements for full-thickness supraspinatus tendon tears, information that is critical for surgical planning. Algorithm performance was compared to reference annotation by determining differences in measurement length, measurement location distances, and slice offset.The mean absolute length differences for ML and AP measurements were just below and above 5 mm, respectively. The clinical significance of these differences is currently unclear. A 5 mm difference for a large tear may not change surgical management, but a 5 mm difference for a small tear that upgrades the size to a medium tear may have management implications.
Mean slice offset was approximately 1 for both ML and AP but slightly greater for ML measurements. Although clinical reader measurements can also typically vary by 1 slice, the algorithm ML measurements in some cases were up to 6-7 slices off from reference. Similarly, histogram analysis demonstrates that while location distances between algorithm and reference were generally less than or equal to 5 mm, there remain significant outlier measurements 1-3 cm from the reference location. Location distances, which are computed in 3d space, account for both in-plane x, y differences in measurement location as well as slice offset, if present. More data is needed to improve the algorithm and further analysis of outlier cases may clarify possible reasons for these larger differences.
The Bland Altman plots do not demonstrate a pattern to suggest systematic or proportional bias. The algorithm does not consistently overmeasure or undermeasure compared to the reference. The length differences do not correlate with tear size; i.e. the algorithm does not make larger deviations from the reference measurement depending on whether the tear is small or large. However, this means the relative length differences are greater for small tears, where the length variations are proportionally greater by percentage relative to the overall size of smaller tears.
Conclusion
Deep learning–based rotator cuff measurement on shoulder MRI is feasible. Further work is needed to improve algorithm performance and to illustrate the clinical implications of these measurement differences.Acknowledgements
No acknowledgement found.References
- McElvany MD, McGoldrick E, Gee AO, Neradilek MB, Matsen FA. Rotator cuff repair: Published evidence on factors associated with repair integrity and clinical outcome. Am J Sports Med. 2015. doi:10.1177/03635465145296442.
- Cho NS, Rhee YG. The factors affecting the clinical outcome and integrity of arthroscopically repaired rotator cuff tears of the shoulder. Clin Orthop Surg. 2009. doi:10.4055/cios.2009.1.2.963.
- Davidson J, Burkhart SS. The Geometric Classification of Rotator Cuff Tears: A System Linking Tear Pattern to Treatment and Prognosis. Arthrosc - J Arthrosc Relat Surg. 2010. doi:10.1016/j.arthro.2009.07.0094.
- Lin DJ, Park J, Schwier M, Geiger B, Raithel E, Recht MP. Deep-learning Diagnosis of Supraspinatus Tendon Tears: Comparison of Multi-sequence versus Single Sequence Input. In: International Society for Magnetic Resonance in Medicine Virtual Conference and Exhibition, August 8-14, 2020.
- Ronneberger O, Fischer P, Brox T. U-net: Convolutional networks for biomedical image segmentation. In: Lecture Notes in Computer Science (Including Subseries Lecture Notes in Artificial Intelligence and Lecture Notes in Bioinformatics). ; 2015. doi:10.1007/978-3-319-24574-4_286.
- Milletari F, Navab N, Ahmadi SA. V-Net: Fully convolutional neural networks for volumetric medical image segmentation. In: Proceedings - 2016 4th International Conference on 3D Vision, 3DV 2016. ; 2016. doi:10.1109/3DV.2016.79
Figures
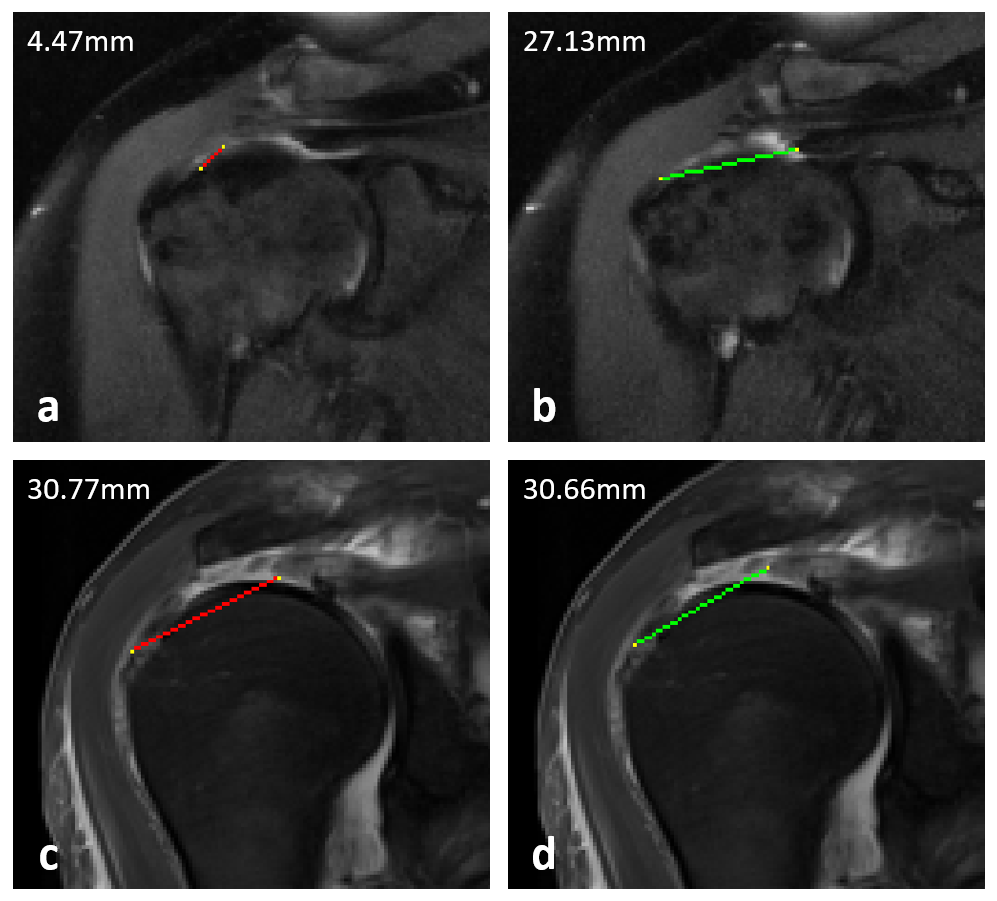
Figure 1. Example mediolateral measurements of full-thickness supraspinatus tendon tears made by the algorithm (red) and the reference annotator (green). (a) and (b) demonstrate a case where the algorithm vastly undermeasured the tear due to slice offset and segmentation failure. (c) and (d) demonstrate a different case where the measurements were concordant with similar measurements taken on the same slice.
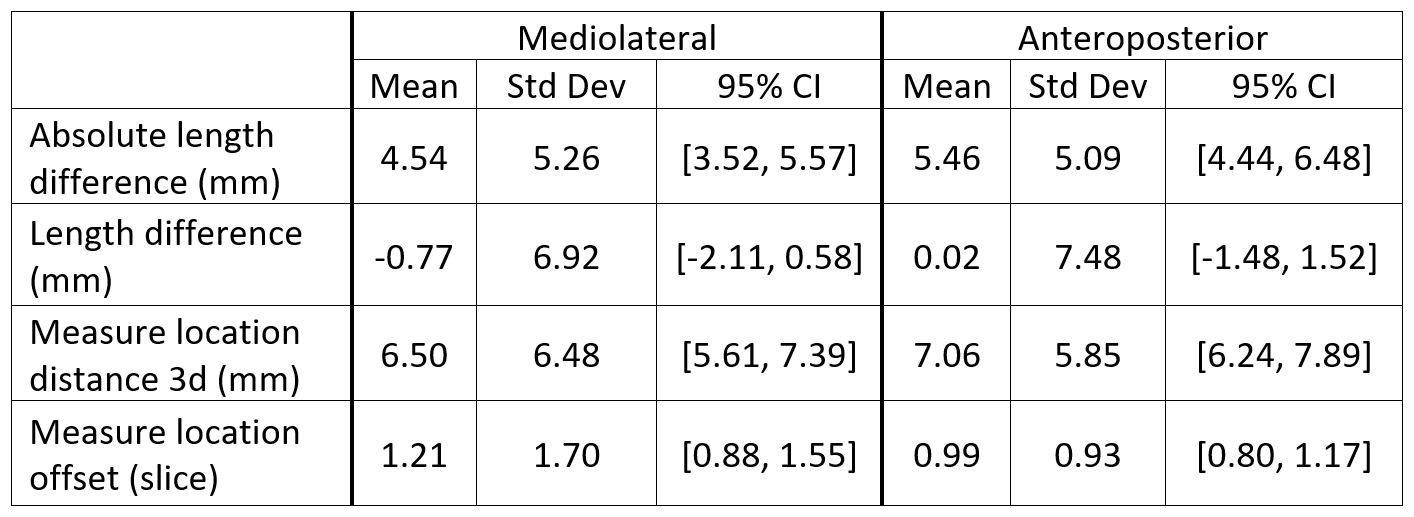
Figure 2. Length and location differences between algorithm vs reference. “Absolute” length difference describes the magnitude difference in length between algorithm and reference, whereas “length difference” accounts for positive and negative differences from the reference. Measurement location distances are computed as the distance in 3d space between corresponding endpoints of algorithm and reference. Location offset is the slice offset of algorithm and reference measurements.
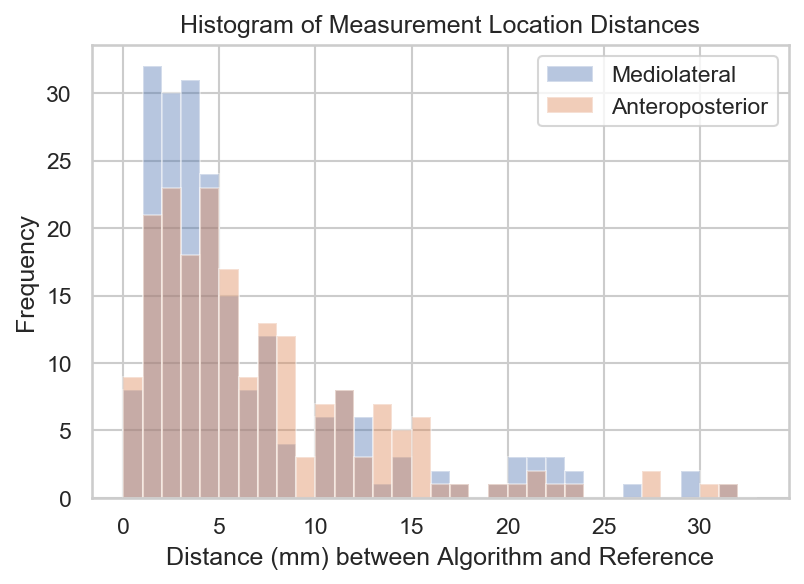
Figure 3. Histogram of measurement location distances for ML and AP measurements. Measurement location distances are computed (and recorded) as the two distinct distances between corresponding endpoints of algorithm and reference measurements.
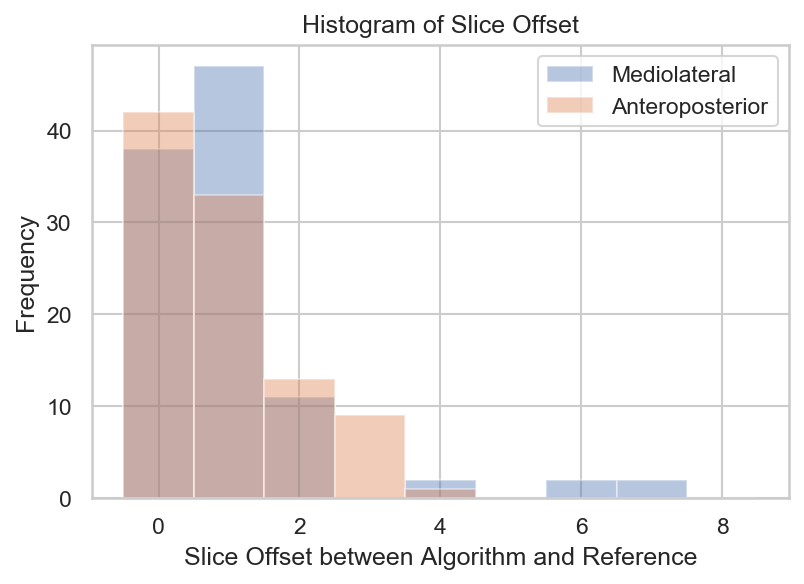
Figure 4. Histogram of slice offset for ML and AP measurements. Generally, slice offset was either 0 or 1 for both ML and AP measurements. Algorithm ML measurements were more often 1 slice off from reference than AP measurements. In particular, there were a few significant outliers for the ML measurements that were up to 6-7 slices off from reference.
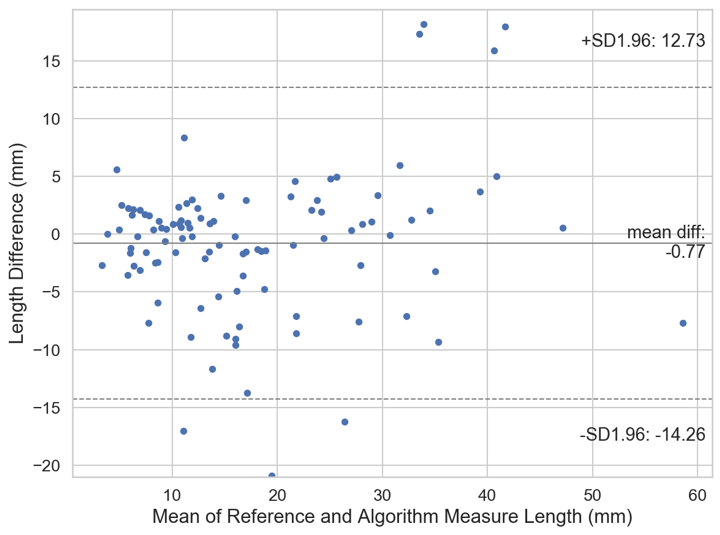
Figure 5. Bland Altman Plot of length difference between algorithm and reference (annotator) mediolateral measurements. The solid line represents the mean length difference between the algorithm and reference measurements. The dashed lines represent the lower and upper 95% limits of agreement.