0800
Spectroscopic MRI Guided Radiation Dose Escalation in Glioblastoma Patients1Radiology, University of Miami School of Medicine, Miami, FL, United States, 2Radiation Oncology, University of Miami School of Medicine, Miami, FL, United States, 3Emory University, Atlanta, GA, United States, 4Radiology, Emory University, Atlanta, GA, United States, 5Radiation Oncology, Johns Hopkins University, Baltimore, MD, United States, 6Radiology, Johns Hopkins University, Baltimore, MD, United States, 7Radiation Oncology, Emory University, Atlanta, GA, United States, 8Radiology, University of Miami, School of Medicine, Miami, FL, United States
Synopsis
To improve localization of tumor tissue for radiation treatment planning a volumetric MR spectroscopic imaging acquisition was used to identify regions of metabolic abnormality. These regions were then integrated into the clinical treatment plan to target increased radiation dose for the identified volume. In a 3-site clinical trial of 30 patients with newly-diagnosed glioblastoma, the escalated dose resulted in a median overall survival of 23 months, which compares favorably with standard of care, without severe adverse events. This study demonstrates considerable potential for incorporating volumetric spectroscopic imaging into radiation treatment planning protocols.
Introduction
The standard of care for glioblastoma is neurosurgical resection followed by radiation therapy (RT) and chemotherapy, with RT planning based on contrast-enhanced T1 and T2 weighted MRI to target the resection cavity, enhancing tumor, and surrounding edema. However, MRI alone may not accurately predict areas at highest recurrence risk and despite aggressive treatment the length of progression-free survival remains poor. To improve detection of active tumor regions, this study examined supplementation of the RT planning with volumetric high-resolution spectroscopic imaging (sMRI) to identify actively proliferating tumor beyond areas of T1-enhancement for targeting with an escalated dose. This was done as part of a multisite trial (NCT03137888; Emory University, Johns Hopkins University, University of Miami). The main goal of this study was to assess feasibility and safety of sMRI guided dose escalation RT and to demonstrate and evaluate the infrastructure developed to support future national level clinical trials.Methods
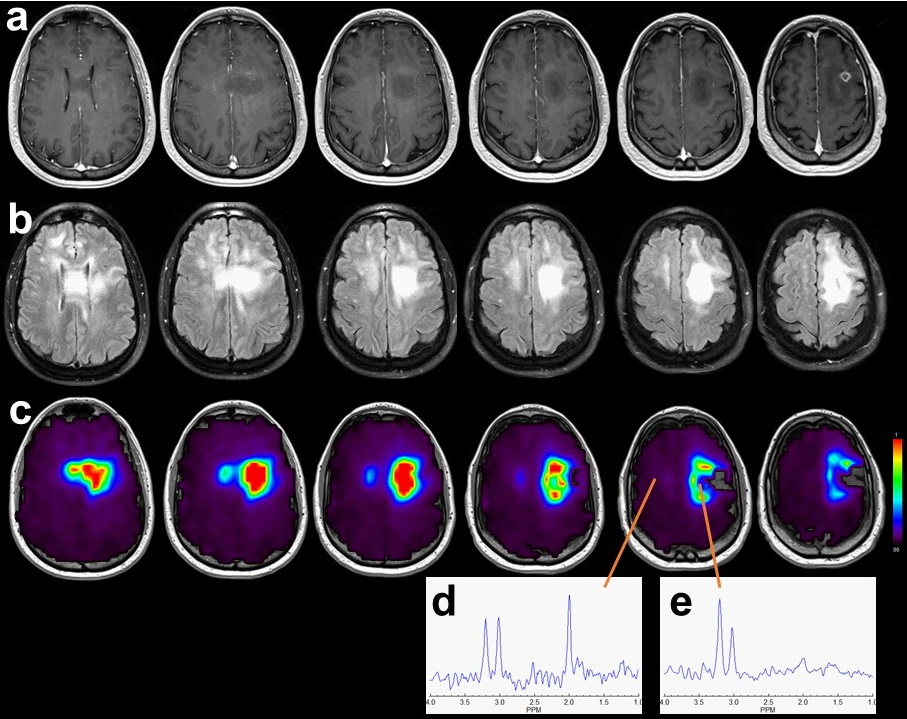
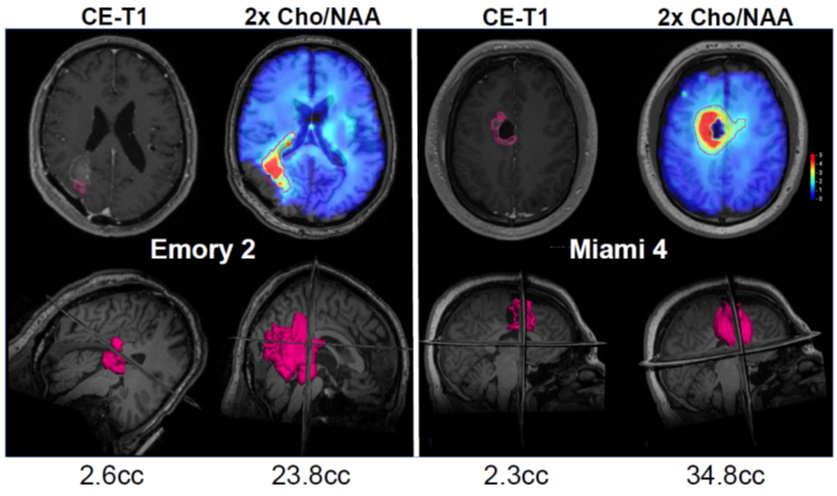
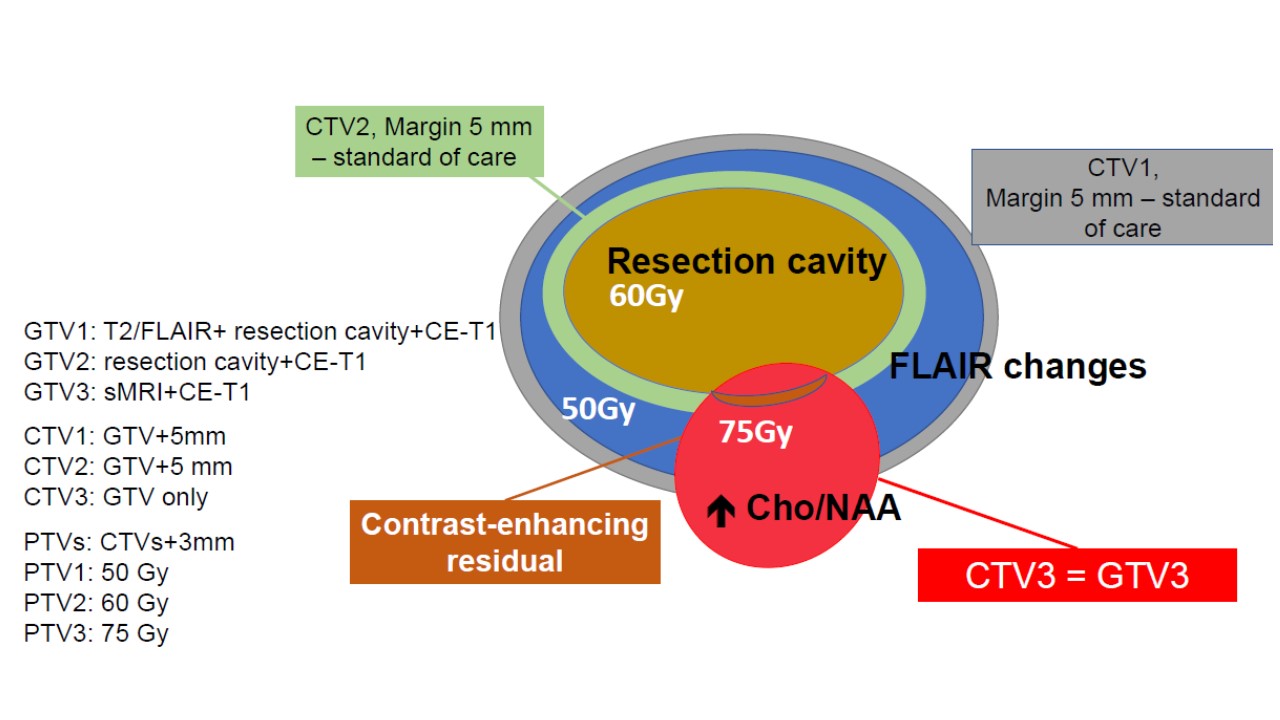
Previous studies have demonstrated that the choline to N-acetylaspartate ratio (Cho/NAA) best correlates with tumor cellularity in surgically resected tissue (ρ=0.82, p< 0.001) and that areas of metabolic abnormalities predate disease recurrence 1. Maps of Cho/NAA were obtained following surgical resection and prior to RT in a group of 30 patients (median age 58, min 20 and max 72) with newly-diagnosed glioblastoma using a whole-brain volumetric sMRI method with echo-planar readout. Parameters included 50x50x18 k-space measurements over a FOV of 280x280x180 mm, TR 1.5s, TE 50 ms, and inversion-recovery lipid suppression with TI=198 ms, sMRI was reconstructed using MIDAS 2 and maps of individual metabolite distributions were derived by spectral fitting. Voxels with a fitted linewidth >13 Hz or outlying spectral intensities (of 4x the value of the mean+standard deviation of all included voxels) were removed. Example Cho/NAA maps and spectra are shown in Fig. 1. sMRI visualization, intensity thresholding and removal of any outlying voxels remote from the tumor volume were performed using a web-based imaging platform, BrICS 3. Regions with significant tumor content were identified using Cho/NAA>2.0, as illustrated in Fig. 2. The resultant sMRI volume was then exported using DICOM-RT and incorporated into the clinical RT planning workflow to create a RT plan as illustrated in Fig. 3, that included an increased dose of 75 Gy in the region of metabolic abnormality and any residual regions of contrast enhancement.Results
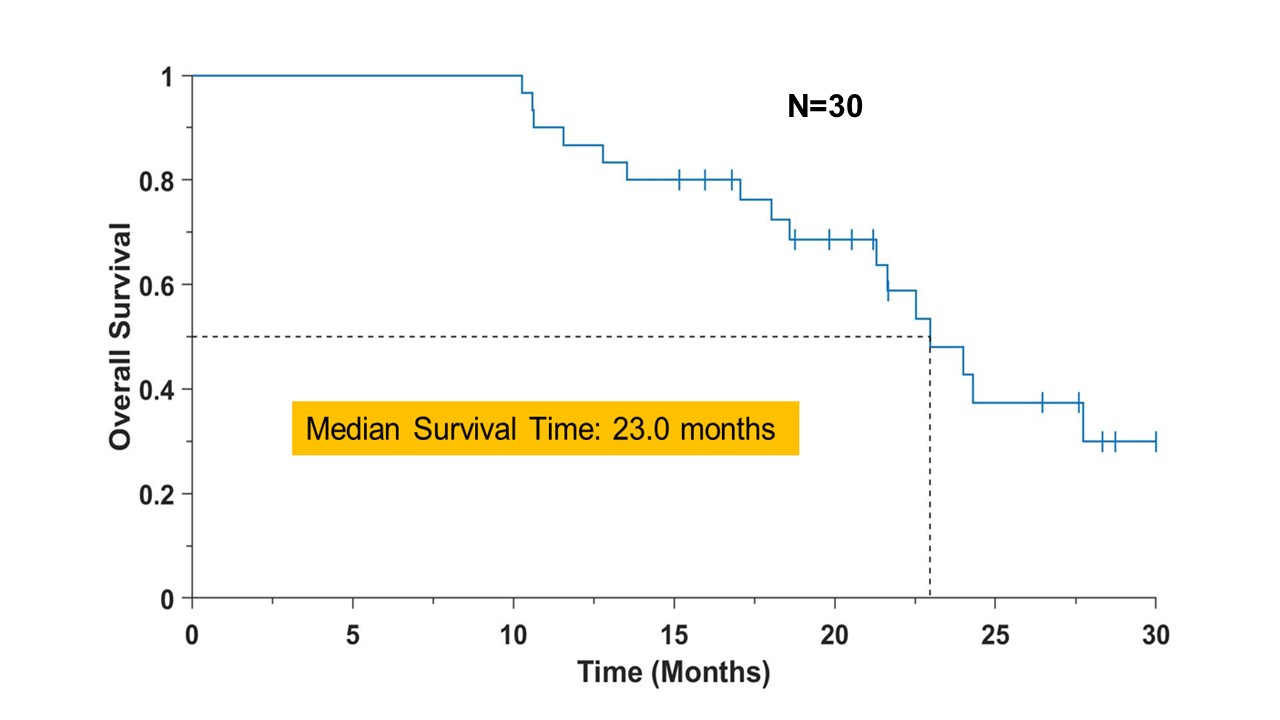
The volumetric sMRI sequence was successfully implemented at three institutions, with centralized image reconstruction and analysis. Genetic analysis revealed 7 patients with MGMT methylation and 2 with IDH mutation. No cases of excessive or unexpected acute toxicity were observed. Late pseudoprogression was observed in 7 patients requiring surgical assessment (necrosis vs progressive tumor), which were found in 4 to be predominantly necrosis. The median dose escalation volumes for the CE T1w was 1.6 cc (range 0 to 15.4 cc), while that from the Cho/NAA>2 (GTV3/CTV3) was 19.7 cc (0.9 to 66.5 cc). Interim analysis (14 patients still surviving) shows a median overall survival (OS) of 23 months, Fig. 4, which compares favorably with standard of care (16 months). Median follow-up of patients that were still alive at last follow-up was 21.4 months. Our cohort included four patients with multifocal distant recurrence and one patient with breast cancer metastases, and a sub-analysis excluding these subjects resulted in an OS of 27.7 months.Conclusion
This study completed enrollment of 30 patients treated with sMRI-guided dose escalated RT across three institutions. This demonstrated successful integration of sMRI into the RT planning workflow and delivered sMRI-guided dose escalated RT plans to glioblastoma patients without severe adverse events. The overall survival showed considerable improvement relative to the comparative standard of care. Based on the demonstrated feasibility and safety it is proposed to further expand the use of sMRI-guided dose-escalated RT to examine the impact on patient outcomes in a future national level, randomized clinical trial.Acknowledgements
Support from National Institutes of Health grants R01CA214557 and F30CA206291. Support for the EPSI sequence and MIDAS processing was provided by R01EB016064.References
1. Cordova JS, et al. Whole-brain spectroscopic MRI biomarkers identify infiltrating margins in glioblastoma patients. Neuro Oncol. 2016;18(8):1180-9.
2. http://mrir.med.miami.edu:8000/midas
3. Gurbani S et al. The brain imaging collaboration suite (BrICS). Tomography. 2019; 5: 184-191.
Figures