0798
Deep learning-based 4D synthetic CT for lung radiotherapy
Matteo Maspero1,2, Kirsten M. Kerkering2,3, Tom Bruijnen1,2, Mark H. F. Savenije1,2, Joost J. C. Verhoeff1, Christoph Kolbitsch3, and Cornelis A. T. van den Berg1,2
1Radiotherapy, Division of Imaging & Oncology, UMC Utrecht, Utrecht, Netherlands, 2Center for Computational imaging group for MR diagnostic & therapy, Center for Image Sciences, UMC Utrecht, Utrecht, Netherlands, 3Physikalisch-Technische Bundesanstalt (PTB), Braunschweig and Berlin, Germany
1Radiotherapy, Division of Imaging & Oncology, UMC Utrecht, Utrecht, Netherlands, 2Center for Computational imaging group for MR diagnostic & therapy, Center for Image Sciences, UMC Utrecht, Utrecht, Netherlands, 3Physikalisch-Technische Bundesanstalt (PTB), Braunschweig and Berlin, Germany
Synopsis
The feasibility of generating synthetic CT for lung tumours from 4D MRI was investigated. A combination of multi-view 2D networks proved to be robust against image artefact and generated sCTs that enabled dose calculation on midposition sCTs. The proposed approach facilitates adaptive MR-guided radiotherapy reducing the time from patient positioning to irradiation and enables quality assurance with dose accumulation based on 4D MRI.
Background & objectives
Synthetic-computed tomography (sCT) generation is crucial to enable MR-only radiotherapy (RT) and accurate MR-based dose calculations1. To date, sCT generation was scarcely performed in the thoracic area2,3; however, obtaining sCT in a region strongly affected by breathing motion is crucial to facilitate adaptive MR-guided radiotherapy (MRgRT), possibly reducing the time from patient positioning to irradiation and enabling dose accumulation based on 4D MRI. This also requires fast sCT generation (<1min)4,5.Recently, convolutional neural networks (CNNs) were able to generate sCTs (<20s) quickly6,7. However, no previous work focused on the generations of sCT for anatomies affected by respiratory motion.
This work aims at assessing: the feasibility of sCT generation for patients diagnosed with cancer in the thoracic region on 4D MRI sorted according to the respiratory phase, and investigate the dosimetric accuracy of MR-based calculation with these sCTs.
Materials and methods
Twenty-six patients undergoing lung (n=24) and liver (n=2) radiotherapy were considered in this study. Patients underwent:- free-breathing CT (Brilliance Big Bore, Philips Healthcare) in the supine treatment position (arms up, except for 3 cases) sampling the respiratory cycle with an external belt. Amplitude-sorted 4D CTs were reconstructed in ten respiratory phases, and a phase-averaged midposition was calculated and used for treatment planning, as performed in our clinic;
- free-breathing 3D fat-suppressed golden angle stack-of-stars T1-w GRE sequence with imaging parameters specified in Tab1 acquired at a 1.5T MRI (Ingenia MR-RT, Philips Healthcare) with arms up (n=14) or down (n=12) during Gadolinium administration. 4D MRI reconstruction was performed retrospectively by sorting the data into ten respiratory phases using a self-navigator obtained from low pass-filtered k-space centre signal (1Hz). Each respiratory phase contained the same number of radial lines with 30% view sharing, corresponding to undersampling=4.9. Non-uniform FFT was used for image reconstruction after signal pre-whitening. The first 150 radial spokes were excluded because they corresponded to strong signal changes due to the contrast agent injection. Also, a phase-averaged midposition was obtained.
Local hyperintense spots (Fig1-right) were observed after MRI reconstruction for n=6, probably due to insufficient fat-suppression. Train (n=12)/validation (n=5)/test (n=9) sets were split by excluding from the training set any patients with MRI affected by hyperintense signal or having different arm positions between CT and MRI. The validation set was used for hyperparameter optimisation, e.g. choosing the epoch for early stopping, generator architecture, loss functions, while within the test set the quality of the sCT was evaluated.
For the test set, final sCTs were compared to single view networks calculating mean absolute error (MAE), and dice coefficient of the bones (DiceBone) against the planning CT. Also, non-parametric Wilcoxon signed-rank tests were conducted. For a subset of five patients in the test set, dosimetric comparison was performed in terms of dose differences (DD), gamma-pass rate recalculating the clinical plan on sCT rigidly registered to planning CT.
Results & discussion
Applying the trained revGANs to the three planes of a single patient required about 30s on GPU. An MAE of 89±21HU (mean±1σ, range:68-140) was obtained in the intersection of the body contours between CT and sCT (Fig2). When comparing the results to adult populations of patients affected by lung tumours, one can observe that MAE is on average slightly higher but comparable to the literature2,3. On the contrary, the DiceBone is lower (<0.31) compared to literature, meaning that bony structures are not well depicted on sCTs; this is visible, for example, in Fig3 were the ribs are missing. The combined-view sCT performed significantly better (p<0.001) than sCTs from networks trained in single planes: sagittal and coronal planes had the lowest MAE, followed by transverse plane. We observed that combining the single view sCT increased the quality of sCT mostly for MRIs affected by hyperintense signal.A dose difference of 0.3±0.4% was obtained on the D>90% of the prescribed dose. γ3%,3mm was >99% for the three patients with same arm position on MR and CT (Tab2), while for the two patients with different arm set-up, dose differences were not acceptable. The results are in line with the previous works2,3.
To our knowledge, this is the first time that sCTs are generated using CNNs for a lung population using 4D MRI on each phase; the highly undersampled MRI acquisition used was challenging due to the presence of hyperintense spots. Future work will focus on increasing the quality of the sCT, especially in the bony structure of the sCTs, and an evaluation is expected on a larger cohort investigating dose accumulation.
Conclusion
Accurate MRI-based dose calculation using a combination of three orthogonal planes for CNN-based sCT generation was feasible for lung patients based on 4D MRI acquisitions on a challenging sequence.Acknowledgements
We gratefully acknowledge the support of NVIDIA Corporation with the donation of the Titan Xp GPU used for prototyping this research.References
- Edmund JM, Nyholm T. A review of substitute CT generation for MRI-only radiation therapy. Radiat Oncol. 2017;12(1):28.
- Prior P, Chen X, Gore E, Johnstone C and Li X A. Is bulk electron density assignment appropriate for MRI-only based treatment planning for lung cancer? Med. Phys 2017;44 3437–43
- Freedman JN, Bainbridge HE, Nill S, Collins DJ, Kachelrieß M, Leach MO, McDonald F, Oelfke U, Wetscherek A. Synthetic 4D-CT of the thorax for treatment plan adaptation on MR-guided radiotherapy systems. Phys Med Biol. 2019; 23;64(11):115005.
- Winkel D, Bol GH, Kroon PS, van Asselen B, Hackett SS, Werensteijn-Honingh AM, Intven MP, Eppinga WS, Tijssen RH, Kerkmeijer LG, de Boer HC. Adaptive radiotherapy: the Elekta Unity MR-linac concept. Clinical and translational radiation oncology. 2019 Sep 1;18:54-9.
- Paulson ES, Ahunbay E, Chen X, Mickevicius NJ, Chen GP, Schultz C, Erickson B, Straza M, Hall WA, Li XA. 4D-MRI driven MR-guided online adaptive radiotherapy for abdominal stereotactic body radiation therapy on a high field MR-Linac: Implementation and initial clinical experience. Clinical and Translational Radiation Oncology. 2020 May 15.
- Maspero M, Savenije MH, Dinkla AM, Seevinck PR, Intven MP, Jurgenliemk-Schulz IM, Kerkmeijer LG, van den Berg CA. Dose evaluation of fast synthetic-CT generation using a generative adversarial network for general pelvis MR-only radiotherapy. Phys Med Biol. 2018;63(18):185001.
- Dinkla AM, Wolterink JM, Maspero M, Savenije MH, Verhoeff JJ, Seravalli E, Išgum I, Seevinck PR, van den Berg CA. MR-only brain radiation therapy: Dosimetric evaluation of synthetic CTs generated by a dilated convolutional neural network. Int J Radiat Oncol Biol Phys. 2018;102(4):801-12.\
- van der Ouderaa TF, Worrall DE. Reversible gans for memory-efficient image-to-image translation. InProceedings of the IEEE Conference on Computer Vision and Pattern Recognition 2019 (pp. 4720-4728).
- Maspero M, Bentvelzen LG, Savenije MHF, Guerreiro F, Seravalli E, Janssens GO, van den Berg CAT, Philippens MEP. Deep learning-based synthetic CT generation for paediatric brain MR-only photon and proton radiotherapy. Radiother Oncol. 2020 Sep 23:S0167-8140(20)30804-5.
Figures
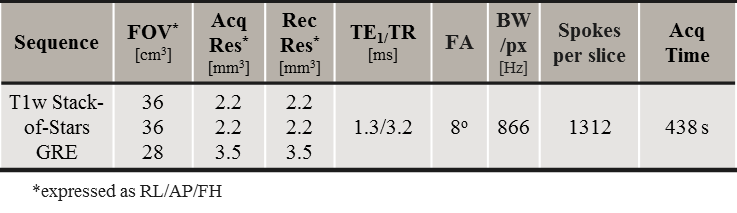
Tab1
MRI protocols of the T1-weighted
GRE sequence with a golden-angle radial stack-of-stars readout
sequence
used for sCT generation.
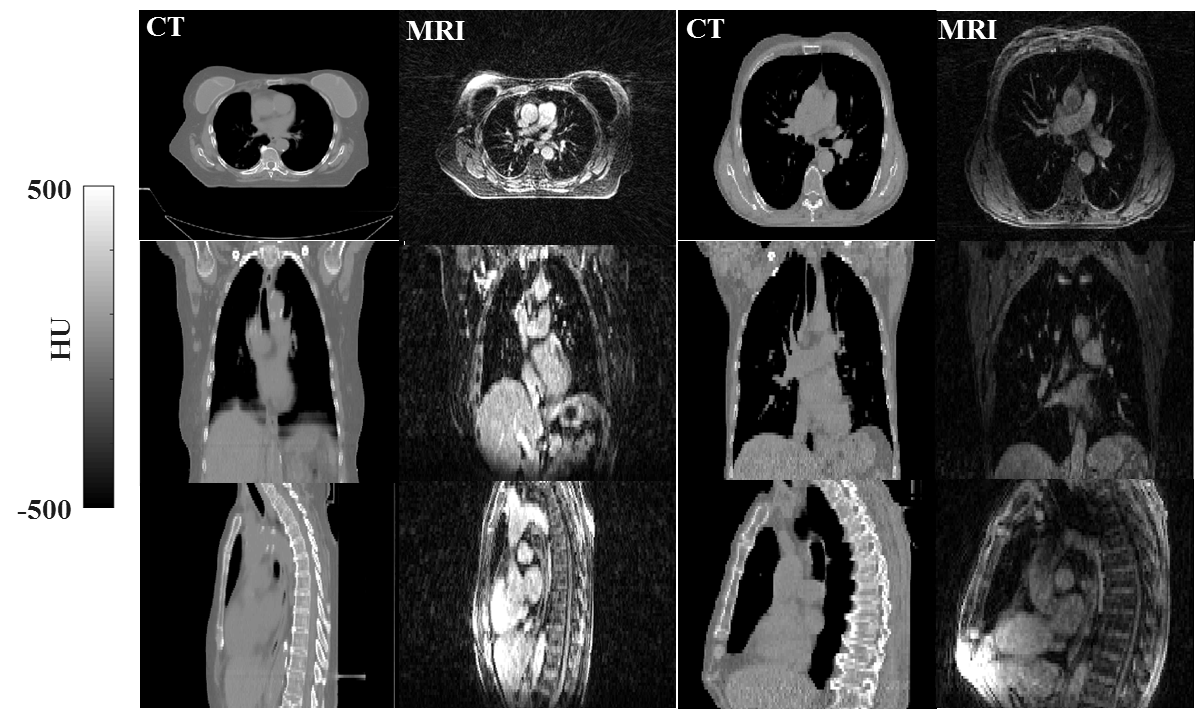
Fig1
Example
of CT and MRI for lung patients presenting (right case) hyperintense
signal in correspondence of fat tissue on MRI that were excluded from
the training set along with the patients with different arm positions
(Fig3,
patient 5)
between CT and MRI.
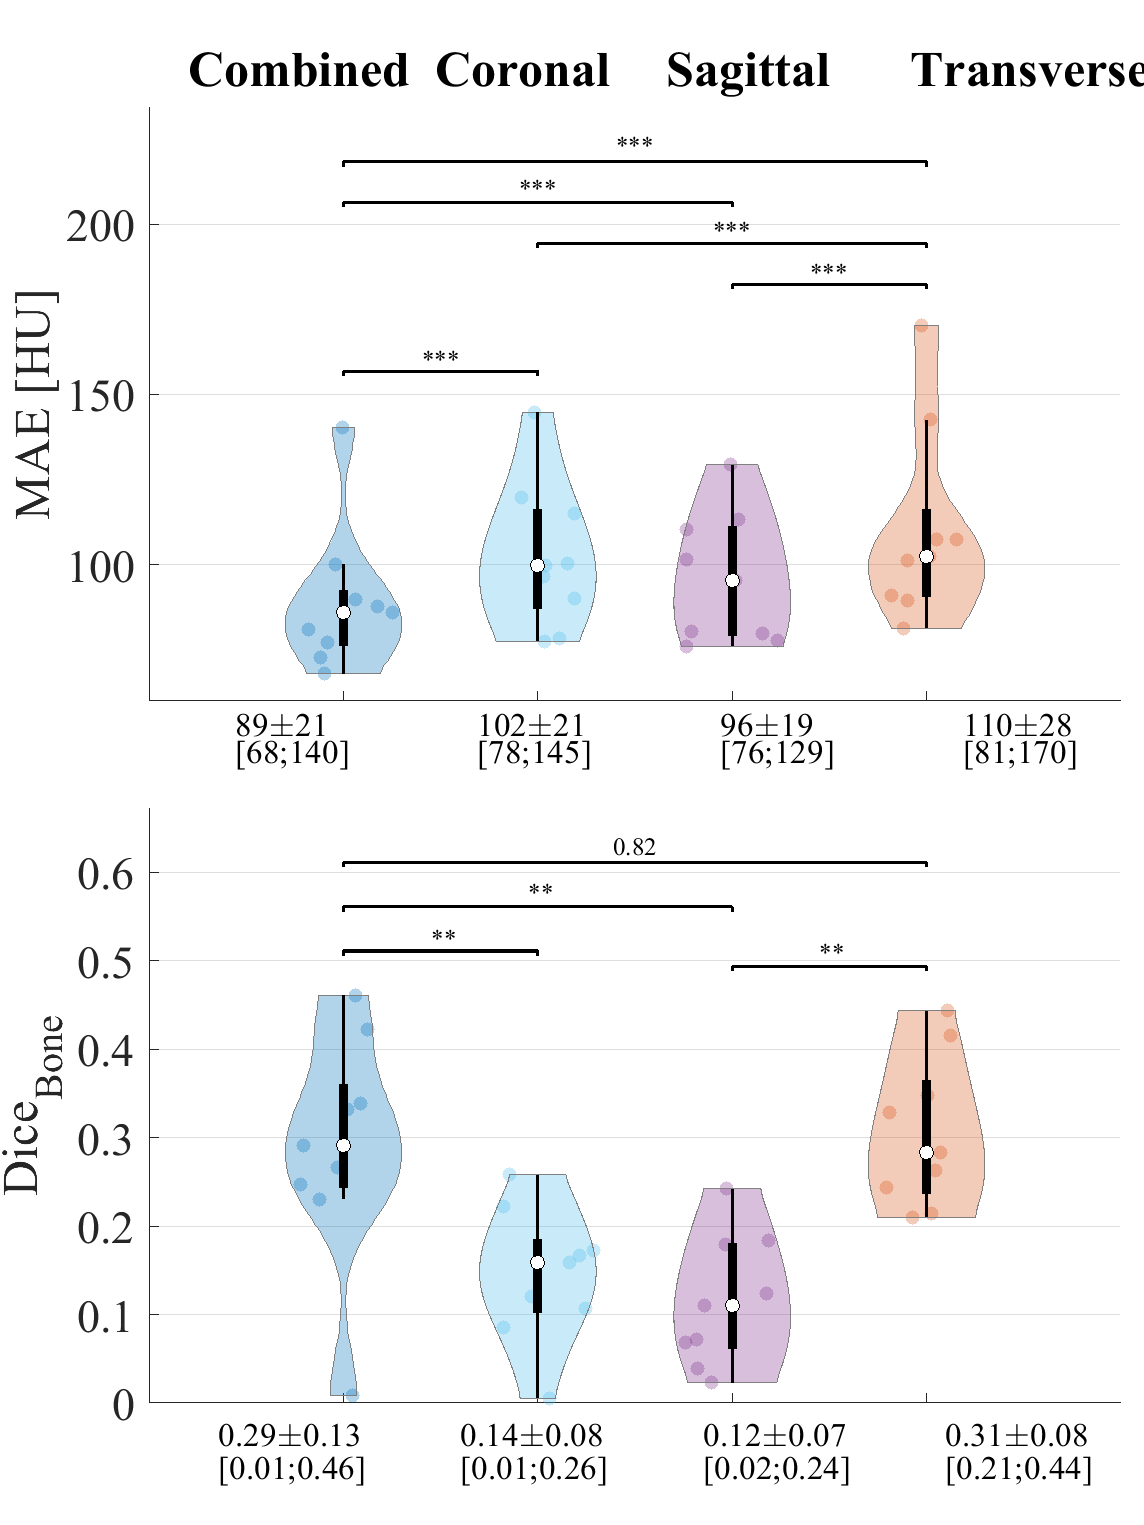
Fig2 Violin and boxplots of MAE (top) in the body contour and the Dice coefficient on the bony structures (DiceBone) of sCT against CT for single-view models and their combinations over the 9 patients in the test set. The violin width indicates the distribution of the metrics, while the boxplots indicate the median (white circle), standard deviation (thick black box) and 95-percentile of the distribution (thin black box). The p-values of the Wilcoxon signed-rank tests are reported. If p-value was <0.001 is indicated by ***, if it was <0.01 by **.
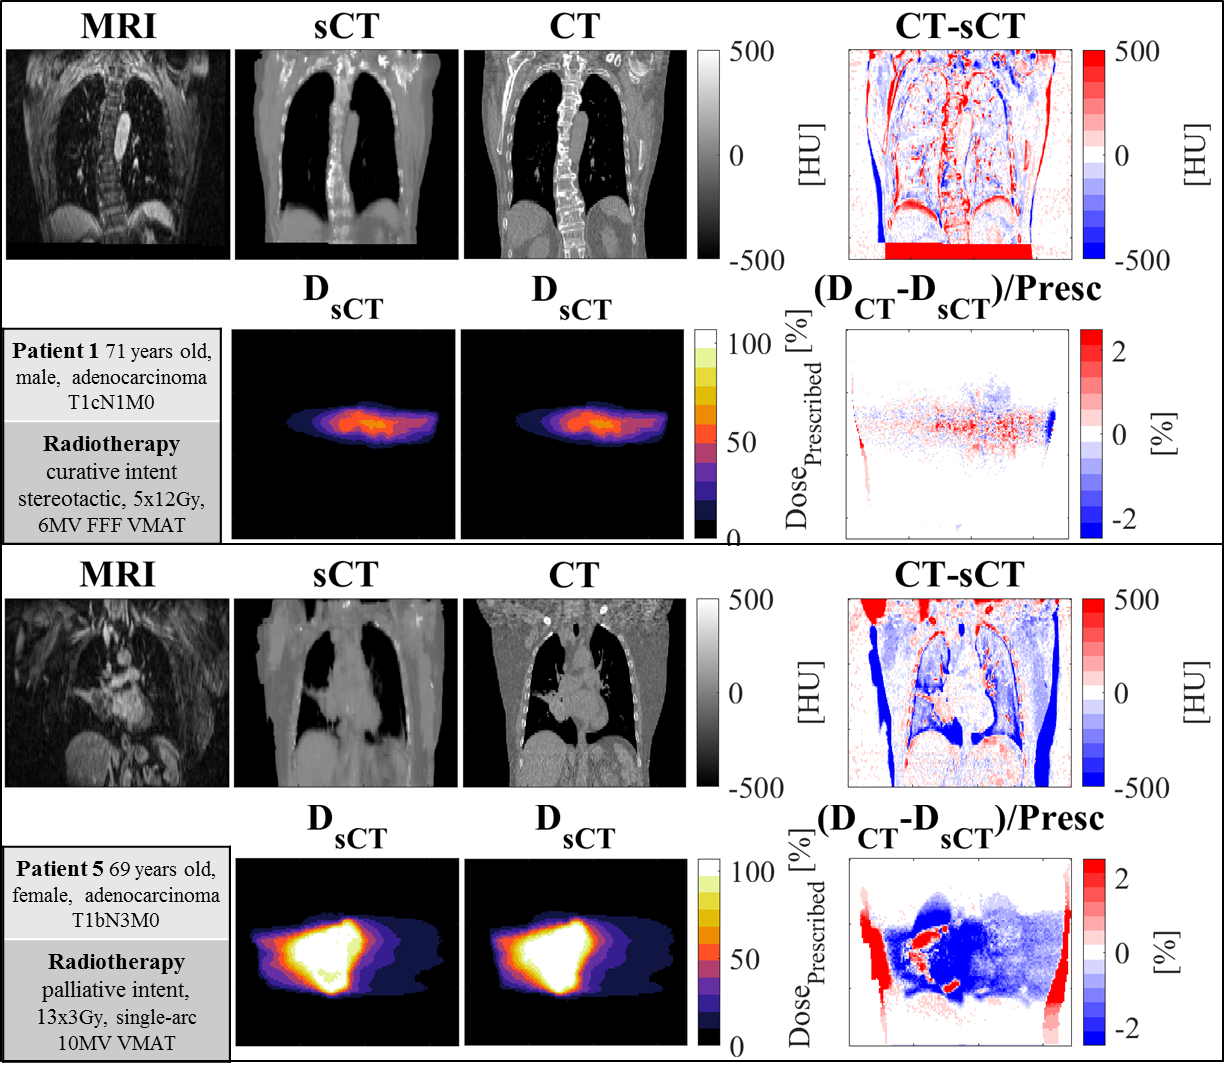
Fig3
Images
example for an average (top) and worst (bottom) patient. For each
patient: (Top) MR, sCT, CT, difference
in sCT and CT, and
(bottom) doses along with their differences. Patient 1 resulted in
having acceptable dose differences and gamma pass rate, while patient
5 did not pass the gamma criterion. For patient 5, dose
differences can be observed due
to different set-up position between CT and MR (arm up/down).
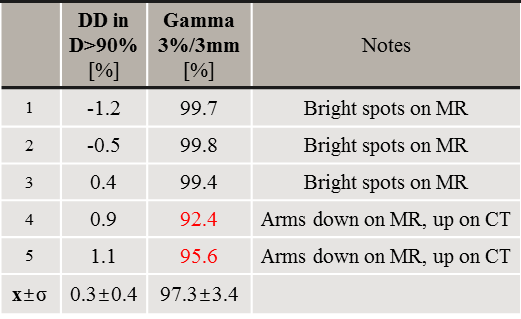
Tab2 Dose comparison between sCT and CT reported for each patient and
calculated as mean (±1σ) of relative dose difference
(DD=(DsCT-DCT)/DCT) and gamma pass rate on D>50% of the prescribed
dose. In red is indicated for which patients the gamma criterion is
not achieved (>99%).