0797
Native Contrast Visualization of Myocardial Radiofrequency Ablation and Acetic Acid Chemoablation Lesions at 0.55 T1NHLBI, Division of Intramural Research, National Institutes of Health, Bethesda, MD, United States, 2Department of Cardiology, Medstar Washington Hospital Center, Washington, DC, United States, 3Biophysics and Biochemistry Branch, Division of Intramural Research, National Institutes of Health, Bethesda, MD, United States, 4Division of Cardiology, Department of Medicine, Johns Hopkins University School of Medicine, Baltimore, MD, United States
Synopsis
This work determined feasibility of visualizing cardiac radiofrequency (RF) ablation lesions at low field (0.55 T) as well as a novel alternative method for targeted tissue destruction: acetic acid chemoablation. Native contrast T1-W imaging and T1 mapping and were carried out in vivo in swine on the day of ablation. Ex vivo high-resolution imaging and histology were used as references. T1 drop was higher for chemoablation (40%) than for RF ablation (19%) relative to myocardium, resulting in significantly higher SNR and CNRs. The visualization of coagulation necrosis from cardiac ablation is feasible using native-contrast low-field MRI.
Introduction
Low-field (0.55 T) MRI is an attractive platform for MR-guided interventions, including cardiac ablation and electrophysiology procedures, as RF-induced device heating is reduced by approximately 7.5-fold compared to 1.5T. (1-3) Recently, techniques using the native T1 contrast created at the core of cardiac RF ablation lesions have demonstrated excellent correlation with extent of necrosis, without any use of exogenous contrast agent.(4-6). This work explores the feasibility of RF ablation lesion assessment at lower field strength as well as single-shot diastolic imaging as a potential method for real-time procedure guidance. In addition, we introduce and explore a novel alternative method for targeted tissue destruction: chemoablation by transcatheter injection of acetic acid.Methods
Left ventricular ablation in swine (N=10) was approved by the local IACUC. First, 6-7 RF ablations were performed using an irrigated tip catheter (40-50 W for 30-60 sec). Second, 2-3 chemoablations were performed using a prototype injection catheter or a commercially available catheter with extendable needle-like tip. 1 ml of either 50% or 100% glacial acetic acid was injected manually over 1-2 min.Animals underwent in-vivo native contrast MRI in a 0.55 T system (prototype MAGNETOM Aera, Siemens Healthineers). Imaging post-ablation visualized edema (T2-W 3D T2-prep imaging), necrotic lesion extent (T1-W 3D inversion recovery imaging with long TI and 2RR triggering (4, 5)) and changes in T1 via mapping (saturation recovery single-shot acquisition,(7)). Single-shot T1-W 2D acquisitions with 2RR triggering were used to visualize lesions in near-real-time. N=6 hearts underwent ex vivo native contrast imaging with 3D T1-W spoiled gradient echo as a high-resolution reference. N=3 hearts were processed for histological analysis.
T1, SNRs and CNRs were measured via ROIs for each lesion and averaged within animals first, and across animals second. Statistical comparisons utilized paired t-tests with Bonferroni correction where needed.
Results
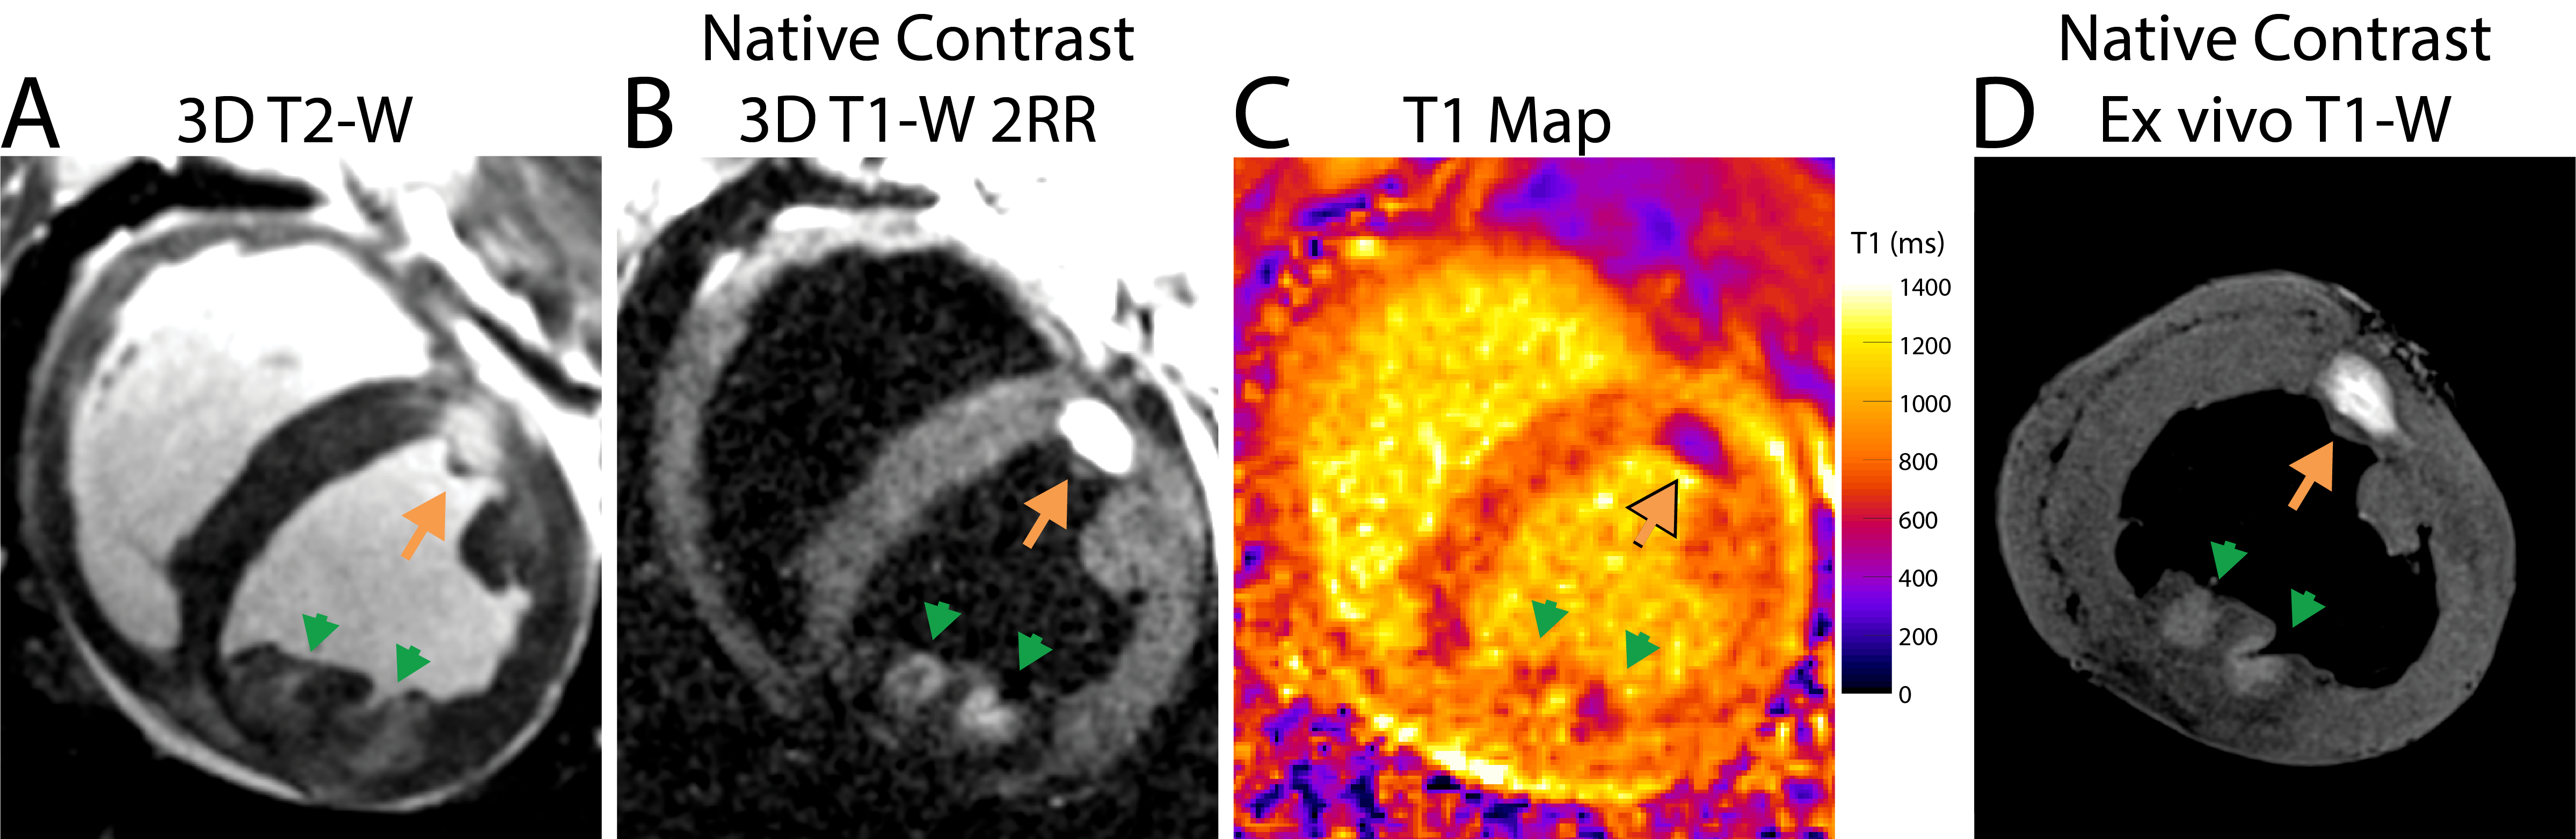
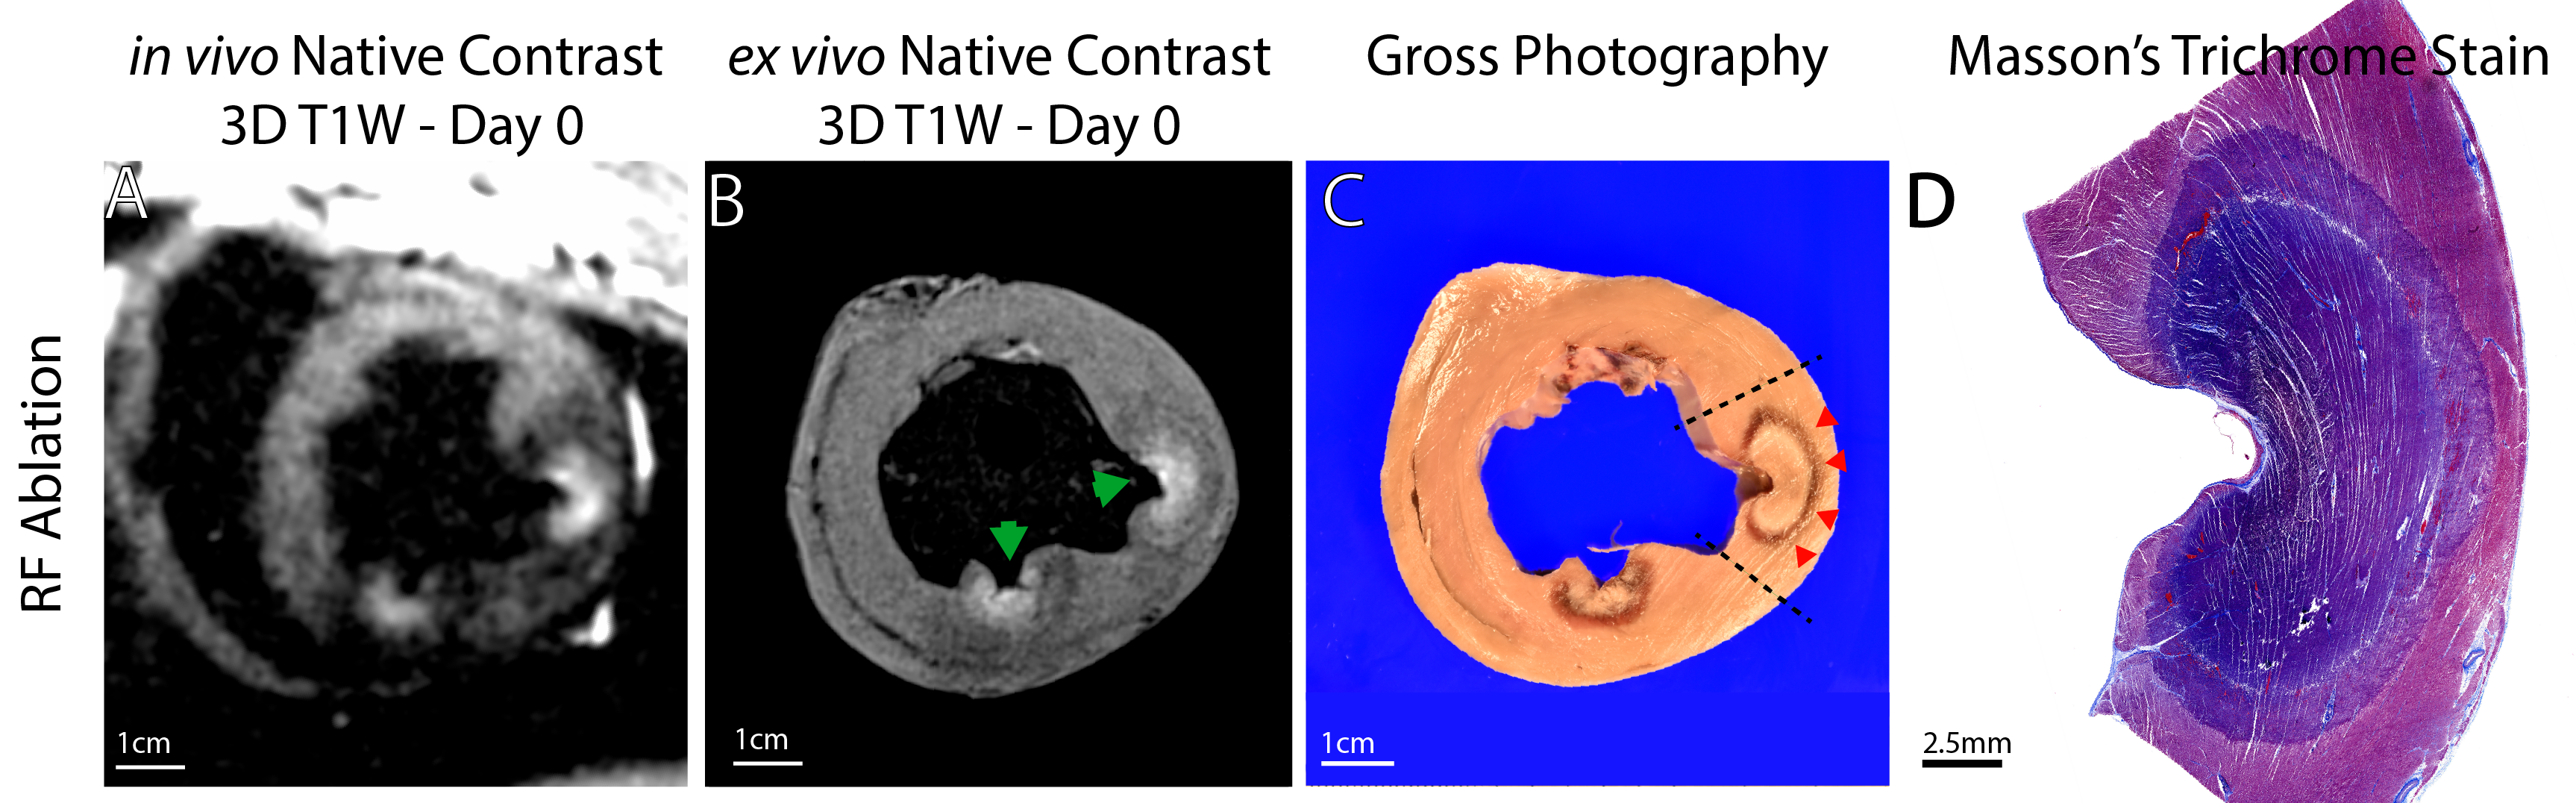
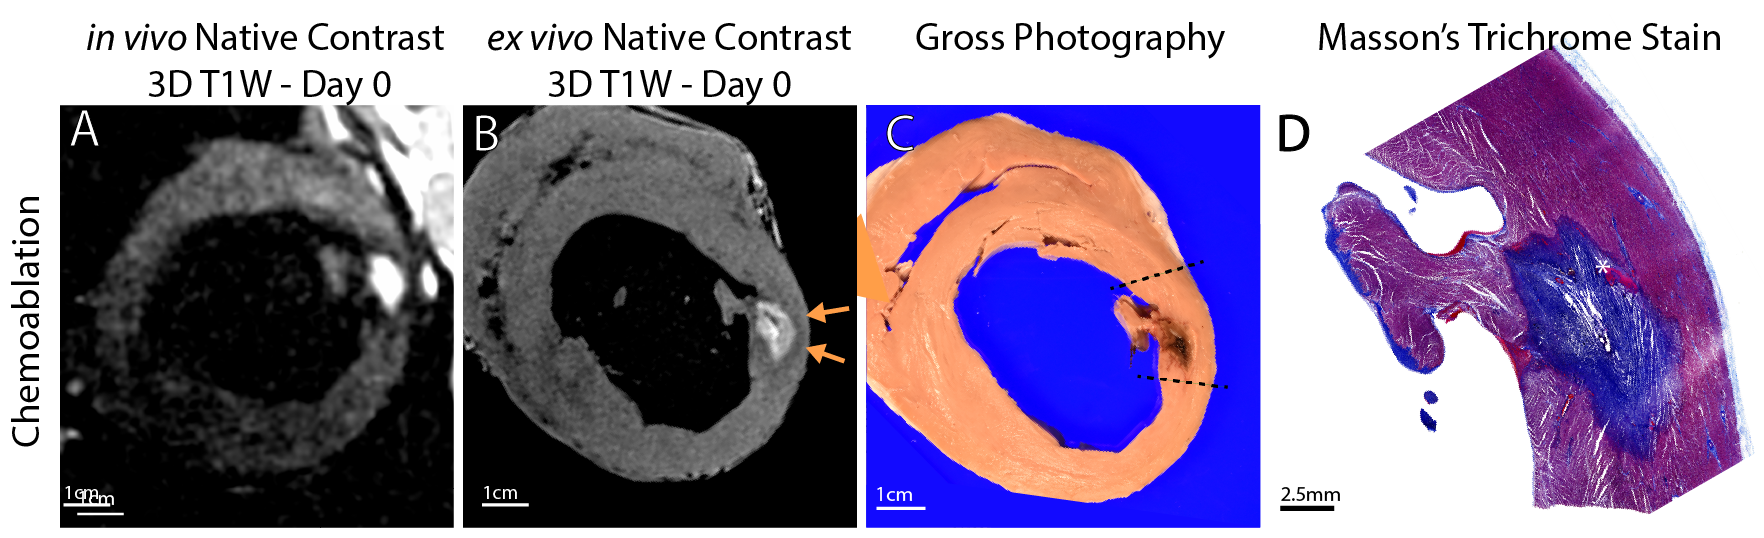
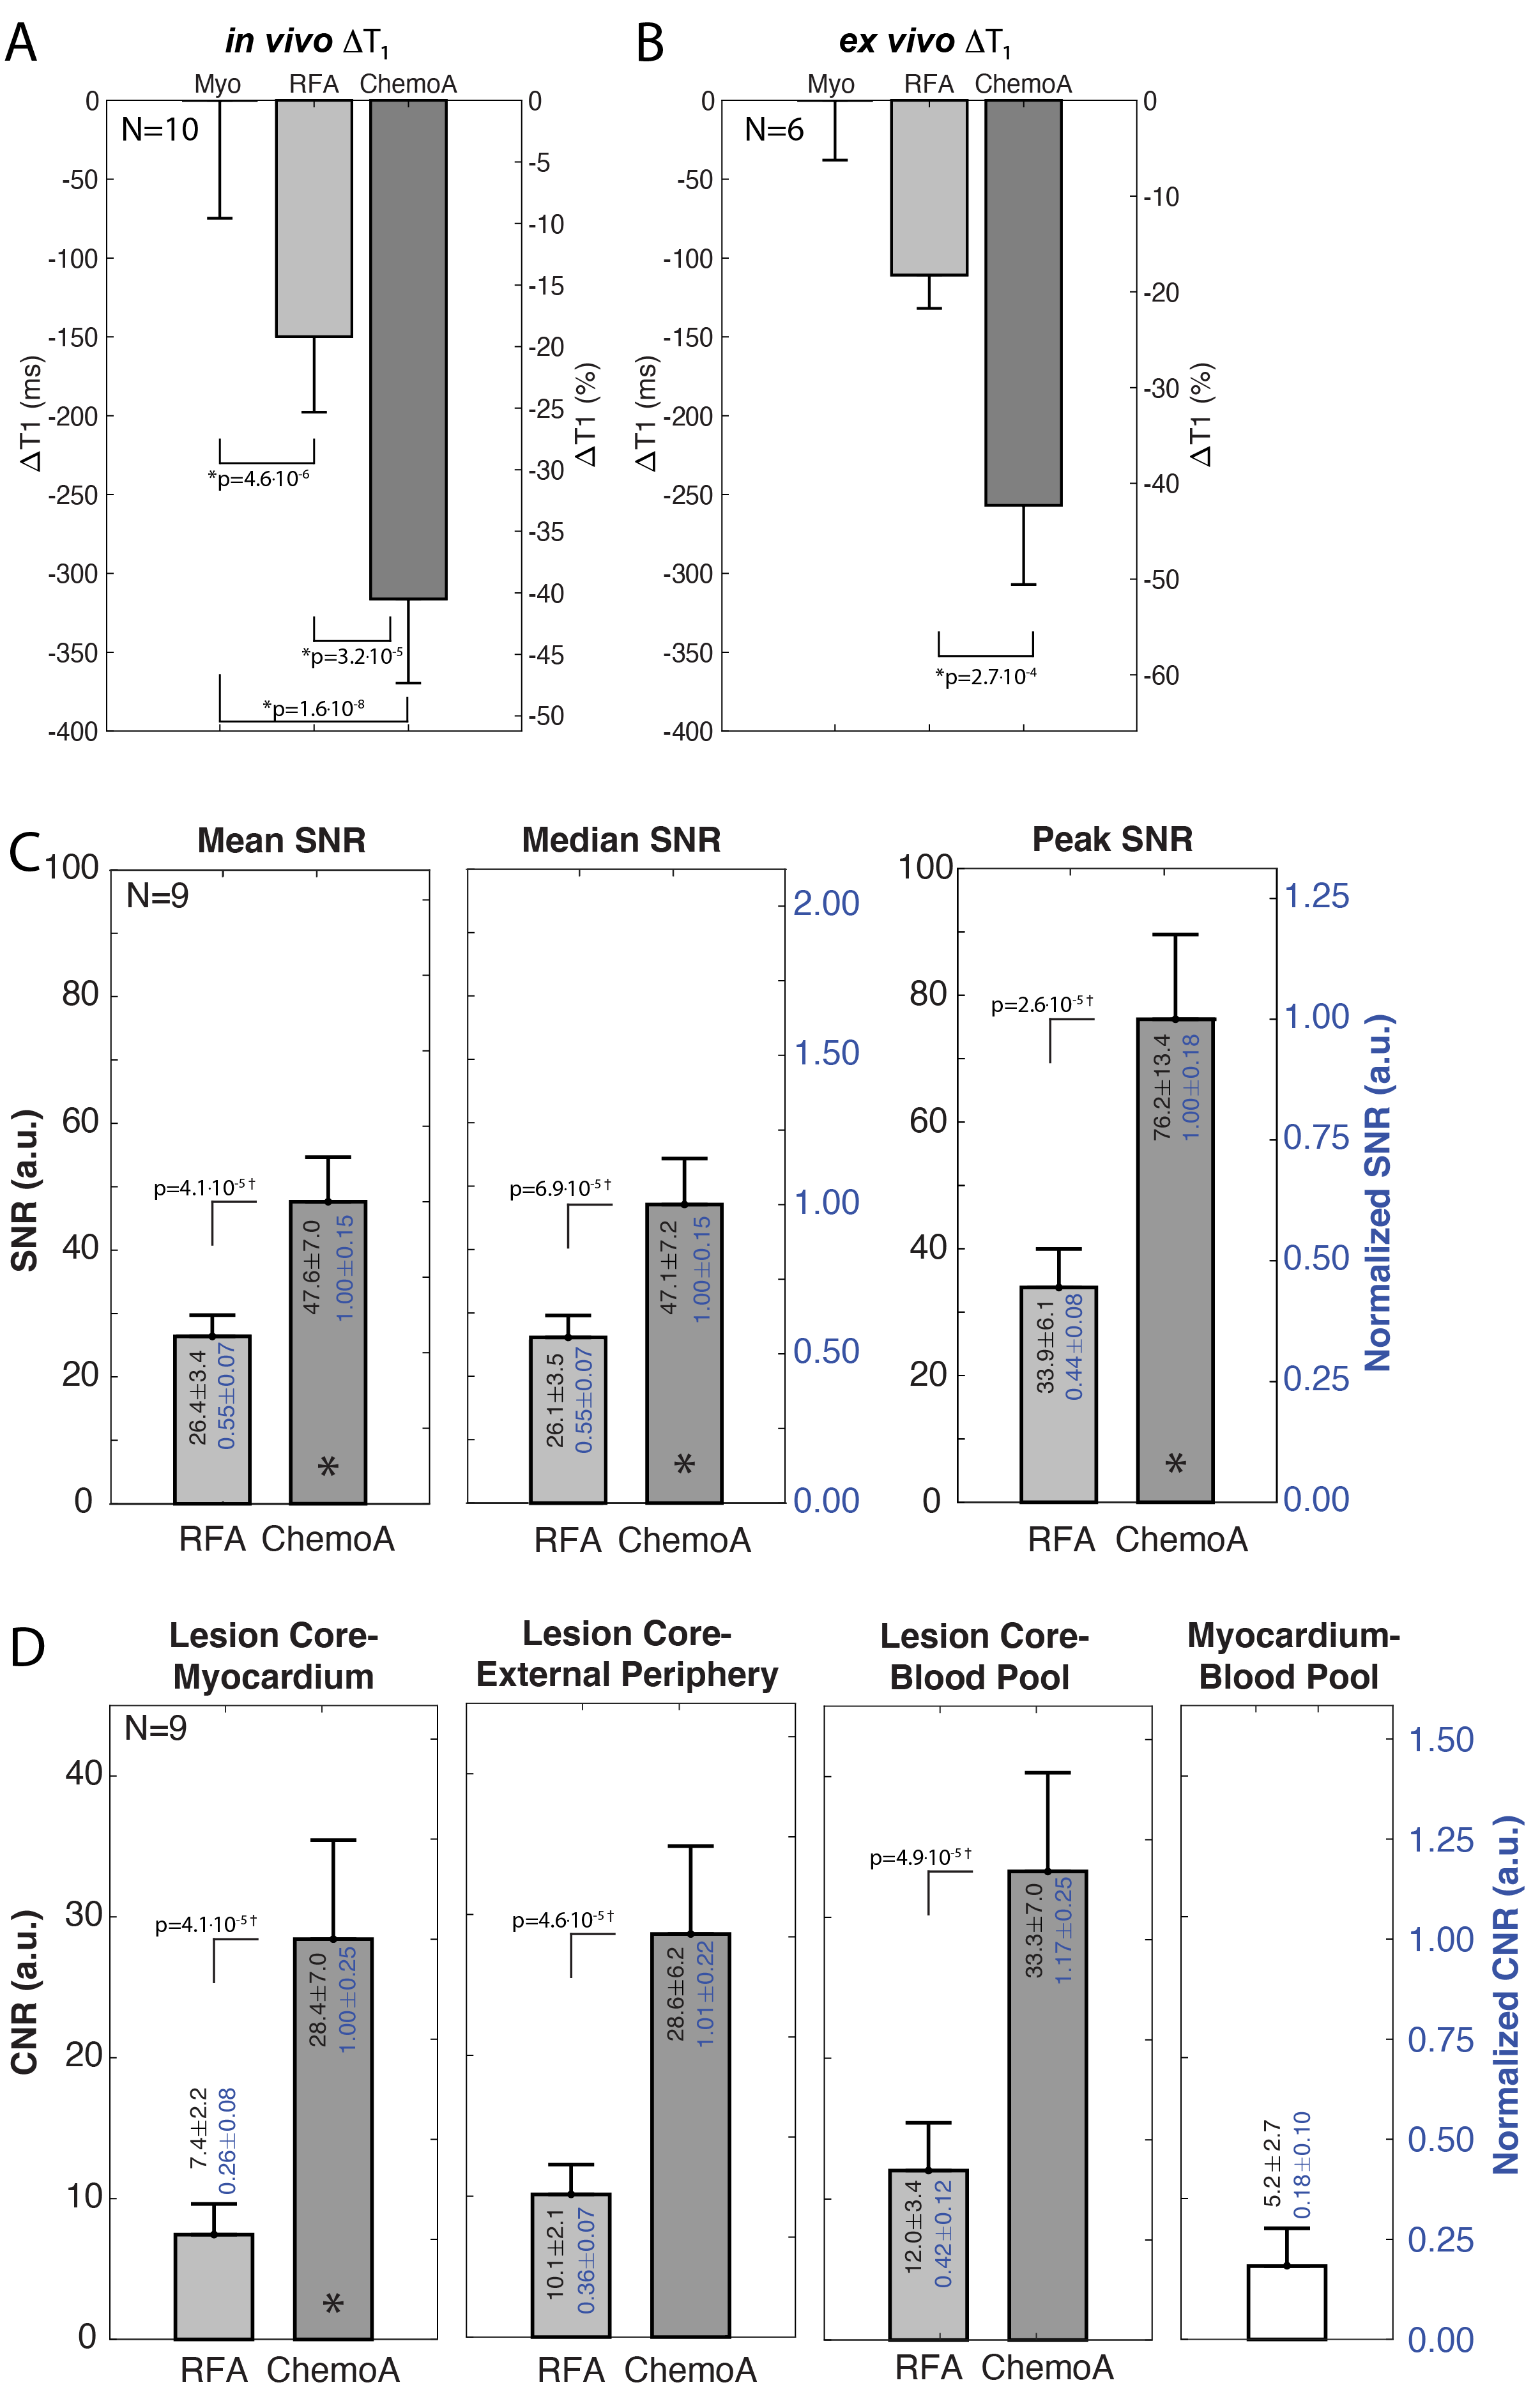
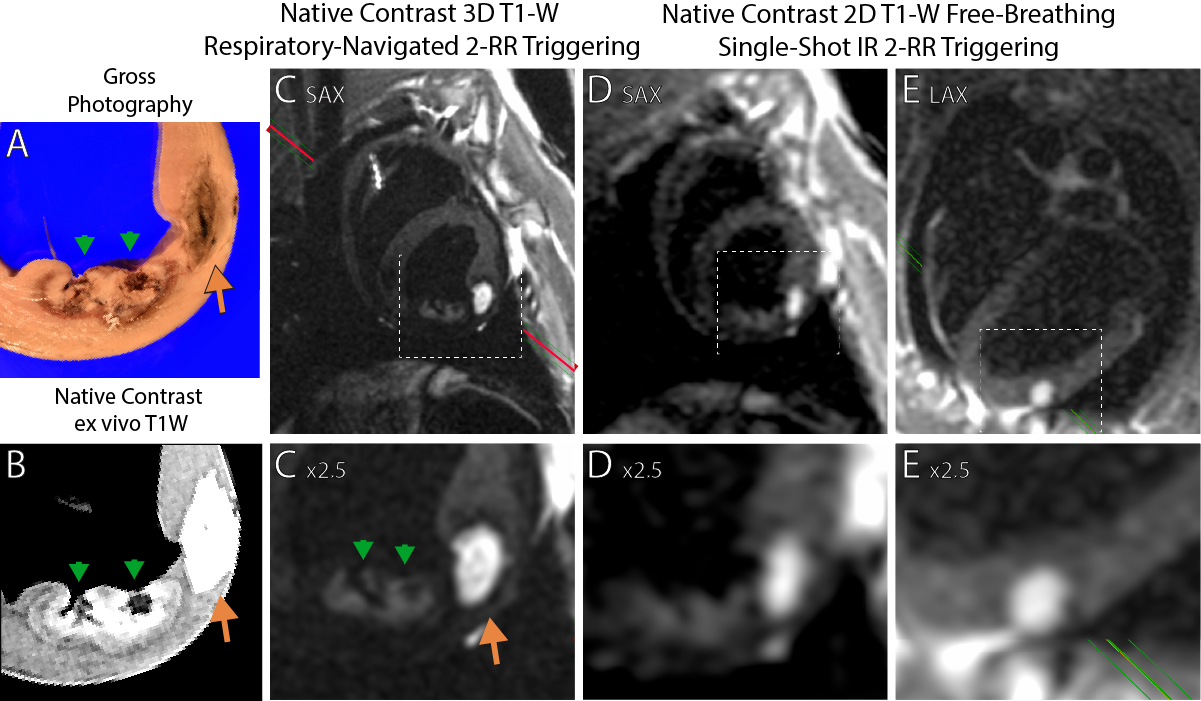
50 RF and 23 chemoablation lesions were analyzed. Figure 1 displays native contrast MRI of RF and chemoablation lesions. Figures 2 and 3 highlight the correlation between native contrast T1-W imaging and histology. Figure 4A summarizes the changes in T1 observed in-vivo and ex vivo after ablation. T1 decreased by 19% for RF and 40% for chemoablation lesion cores relative to myocardium. Figures 4B,C summarize the measured SNRs and CNRs after ablation. Mean, median and peak SNR were all significantly greater with chemoablation than RF ablation (p<10-4 for all comparisons). CNR between lesion cores and normal myocardium, lesion periphery (edema), and the LV blood pool were also significantly greater for chemoablation (p<10-4 for all). Figure 5 demonstrates single-shot imaging suitable for monitoring lesion formation.Discussion
This work shows that native contrast T1-W MRI at 0.55 T can assess acute ablation lesions in the heart. Native contrast imaging can visualize morphological characteristics of myocardial RF ablation lesions but is limited by SNR. Acetic acid chemoablation by direct intramyocardial injection is an attractive experimental therapy producing lesions that can be accurately assessed at low field. Native contrast imaging of ablation lesions offers the ability to assess delivered therapy without the use of Gd-based agents which limit intraprocedural feedback as they can only be used once or twice during intervention and tend to overestimate the extent of necrosis.(5, 8)Ablation lesion imaging at low field could simplify clinical translation of MRI guided cardiac electrophysiology procedures by reducing the concern for RF heating of interventional devices. Because RF heating is proportional to the square of field strength, the ability to perform lesion assessment 0.55 T compared to standard 1.5 or 3 T enables use of some commercially available guidewires and simplifies heating-safe design requirements for other electrophysiology catheters and sheaths.(3, 9) However, lower field results in lower polarization and reduced image SNR. SNR from ECG and respiratory navigator gated 3D imaging and ECG gated 2D imaging over 2 heartbeats were sufficient to permit lesion visualization. This was particularly true for acetic acid chemo-ablation which exhibited around ~3.7 fold greater contrast.
The dominant mechanism of native T1 contrast generated by RF ablation is thought to be oxidation of ferrous to ferric iron in myoglobin and hemoglobin within the zone of thermal necrosis.(4, 10-12) As shown pictorially in this work, the zone of native T1 contrast on in-vivo and ex vivo imaging does not encompass the entire necrotic lesion observed on histology. The peripheral zone included coagulation necrosis and significant presence of intact red blood cells (Fig. 2). Likely, the temperature rise in the periphery was sufficient to cause necrosis but insufficient to trigger changes in T1 contrast. This mismatch of underlying mechanisms merits further study.
The mechanism for T1 contrast after acetic acid chemoablation is as of yet undetermined, though likely similar in nature to that of RF ablation. However, for chemoablation the entire lesion exhibits T1 changes, making MR-based lesion assessment worth further exploration.
Conclusion
This work demonstrates that native contrast T1-W imaging allows for visualization of myocardial necrosis produced by both RF ablation and acetic acid chemoablation at low-field. The larger decrease in T1 with chemoablation improved visualization of necrosis. Transcatheter chemoablation represents an attractive method for targeted cardiac tissue destruction, particularly when using low-field MRI.Acknowledgements
We are grateful to Katherine Lucas and Victoria Haley from the NHLBI Division of Intramural Research Animal Surgery and Resources Core for their talented assistance with in vivo experiments. We would like to acknowledge the assistance of Siemens Healthcare in the modification of the MRI system for operation at 0.55T under an existing cooperative research agreement between NHLBI and Siemens Healthcare.References
1. Konings MK, Bartels LW, Smits HF, Bakker CJ. Heating around intravascular guidewires by resonating RF waves. J Magn Reson Imaging. 2000;12(1):79-85.
2. Yeung CJ, Karmarkar P, McVeigh ER. Minimizing RF heating of conducting wires in MRI. Magn Reson Med. 2007;58(5):1028-34.
3. Campbell-Washburn AE, Ramasawmy R, Restivo MC, Bhattacharya I, Basar B, Herzka DA, et al. Opportunities in Interventional and Diagnostic Imaging by Using High-Performance Low-Field-Strength MRI. Radiology. 2019;293(2):384-93.
4. Guttman MA, Tao S, Fink S, Kolandaivelu A, Halperin HR, Herzka DA. Non-contrast-enhanced T1 -weighted MRI of myocardial radiofrequency ablation lesions. Magn Reson Med. 2018;79(2):879-89.
5. Tao S, Guttman MA, Fink S, Elahi H, Patil KD, Ashikaga H, et al. Ablation Lesion Characterization in Scarred Substrate Assessed Using Cardiac Magnetic Resonance. JACC Clin Electrophysiol. 2019;5(1):91-100.
6. Guttman MA, Tao S, Fink S, Tunin R, Schmidt EJ, Herzka DA, et al. Acute enhancement of necrotic radio-frequency ablation lesions in left atrium and pulmonary vein ostia in swine model with non-contrast-enhanced T1 -weighted MRI. Magn Reson Med. 2020;83(4):1368-79.
7. Chow K, Flewitt JA, Green JD, Pagano JJ, Friedrich MG, Thompson RB. Saturation recovery single-shot acquisition (SASHA) for myocardial T(1) mapping. Magn Reson Med. 2014;71(6):2082-95.
8. Badger TJ, Oakes RS, Daccarett M, Burgon NS, Akoum N, Fish EN, et al. Temporal left atrial lesion formation after ablation of atrial fibrillation. Heart Rhythm. 2009;6(2):161-8.
9. Campbell-Washburn AE, Rogers T, Stine AM, Khan JM, Ramasawmy R, Schenke WH, et al. Right heart catheterization using metallic guidewires and low SAR cardiovascular magnetic resonance fluoroscopy at 1.5 Tesla: first in human experience. J Cardiovasc Magn Reson. 2018;20(1):41.
10. Farahani K, Saxton RE, Yoon HC, De Salles AA, Black KL, Lufkin RB. MRI of thermally denatured blood: methemoglobin formation and relaxation effects. Magn Reson Imaging. 1999;17(10):1489-94.
11. Celik H, Ramanan V, Barry J, Ghate S, Leber V, Oduneye S, et al. Intrinsic contrast for characterization of acute radiofrequency ablation lesions. Circ Arrhythm Electrophysiol. 2014;7(4):718-27.
12. Krahn PRP, Singh SM, Ramanan V, Biswas L, Yak N, Anderson KJT, et al. Cardiovascular magnetic resonance guided ablation and intra-procedural visualization of evolving radiofrequency lesions in the left ventricle. J Cardiovasc Magn Reson. 2018;20(1):20.
Figures