0795
QSM of the head-and-neck at 7T using simultaneous fat-water imaging with SMURF
Beata Bachrata1,2, Korbinian Eckstein1, Siegfried Trattnig1,2, and Simon Daniel Robinson1,3,4
1High Field MR Centre, Department of Biomedical Imaging and Image-Guided Therapy, Medical University of Vienna, Vienna, Austria, 2Christian Doppler Laboratory for Clinical Molecular MR Imaging, Vienna, Austria, 3Centre of Advanced Imaging, University of Queensland, Brisbane, Australia, 4Department of Neurology, Medical University of Graz, Graz, Austria
1High Field MR Centre, Department of Biomedical Imaging and Image-Guided Therapy, Medical University of Vienna, Vienna, Austria, 2Christian Doppler Laboratory for Clinical Molecular MR Imaging, Vienna, Austria, 3Centre of Advanced Imaging, University of Queensland, Brisbane, Australia, 4Department of Neurology, Medical University of Graz, Graz, Austria
Synopsis
We address the challenges of QSM in regions outside of the brain which contain disconnected structures - leading to difficulty in masking - and significant amounts of fat with chemical shift and relaxation differences relative to water - leading to errors in susceptibility estimates. We propose a mask generation approach based on signal phase and show that the errors in susceptibility estimates can be eliminated using simultaneous fat-water imaging with SMURF. Using multi-echo acquisition and inverse-variance-weighted echo combination, we generate high CNR, chemical shift and relaxation effects-free susceptibility maps of the head-and-neck at 7T.
Introduction
There has been an increase of interest in Quantitative Susceptibility Mapping (QSM) outside the brain, including the head-and-neck1, liver2, breasts3, knee4, prostate5 and spine6. The presence of fat in these regions results in errors in estimated susceptibilities, which stem from chemical shift and relaxation differences between fat and water. The circa 3.4 ppm chemical shift difference between their resonance frequencies results in so-called Type 1 (displacement) and Type 2 (phase discrepancy) chemical shift artefacts (CSA) and the differences in T1 and T2* relaxation times lead to disparate signal weighting, skewing susceptibility values in mixed voxels. Simultaneous separate fat-water imaging based on dual-band excitation in combination with CAIPIRINHA, SMURF8, has been shown to correct for these effects at 3T9.QSM generally benefits from the use of ultra-high field strength10, but in fatty tissues outside the brain, the increased fat-water chemical shift difference leads to increased Type 1 CSA. QSM also benefits from a multi-echo acquisition, enabling high CNR across tissues with different T2* values11, however, the acquisition of later echoes also causes a stronger bias due to fat-water T2* relaxation differences. Additionally, in areas such as the head-and-neck, comprising tissues with very different T2*, an efficient echo combination approach is required. Finally, QSM imaging outside the brain also raises a challenge of masking, as – in contrast to the brain – there are no reliable segmentation tools and simple magnitude thresholding generally includes some voxels with unreliable phase, giving rise to streaking artefacts.
We address these challenges and generate chemical shift and relaxation effects-free, high CNR susceptibility maps of the head-and-neck using SMURF imaging at 7T.
Methods
3D SMURF RF pulses were optimized for 7T. The larger fat-water chemical shift difference at 7T compared to 3T9 allowed the use of broader, shorter minimum-phase Shinar-Le-Roux12,13 pulses with a duration of 8ms, allowing a first echo time of about 3.5-4ms.Sagittal head-and-neck images of a healthy volunteer were acquired using a 7T Siemens MAGNETOM scanner and 32-channel head coil. Multi-echo 3D GRE images were acquired using: i) SMURF and, for comparison, ii) conventional (broadband excitation) GRE, both with “random” echo times (i.e. selected without consideration of the fat-water phase relationship) of TE={3.85,7.70,11.55,15.40,19.25}ms and iii) conventional (broadband excitation) GRE with “in-phase” echo times of TE={4,8,12,16,20}ms, all with TR=30ms, resolution=0.95x0.95x0.95mm, matrix=224x224x176, rBW/pixel=370Hz, FA=14°, phase-encoding anterior-posterior and with parallel imaging acceleration of R=3 and PF=7/8 resulting in TA=5min45s.
SMURF images were corrected for chemical shift artefacts and for differences in relaxation times. Literature values of 550ms14 and 1700ms15 for fat and water respectively were used for T1 correction. For T2* correction, separate T2* maps of water and fat were calculated from the multi-echo information and used for correction in mixed voxels (0.1<FF<0.8).
A head-and-neck mask was generated by calculating and thresholding separate fat and water maps of phase gradient coherence and phase combination quality, i.e. Q-metric16, which were then combined (Figure 1).
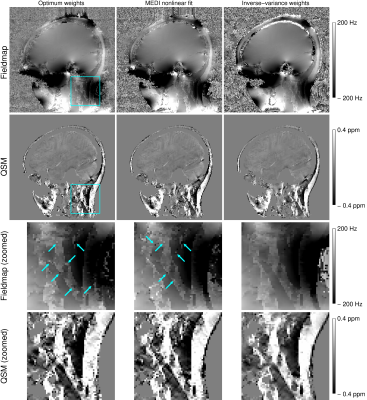
Susceptibility maps were generated using coil-combination with ASPIRE17, phase unwrapping with ROMEO18; and, using Sepia toolbox19, background-field correction with PDF20 and susceptibility calculation with STAR21. Susceptibility maps estimated from individual echoes were compared with those from all echoes combined using i) Optimum weights22, ii) non-linear fitting by MEDI23 (using the implementations in Sepia19), and iii) Inverse-variance-weighted frequency combination24. While with iii) the echoes were first unwrapped, using temporal unwrapping, and then combined, with i) and ii) vice versa.)
Results
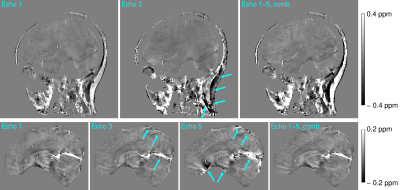
The mask generated using signal phase effectively filtered out noisy phase voxels, resulting in QSMs with very little streaking artefacts but containing most of the anatomy of interest (Figures 2-5).The susceptibility map generated from the first echo provided good tissue contrast in the areas of short T2*; the neck and around the sinuses but in the brain, with longer T2* values, the later echoes were required for sufficient CNR (Figure 2). The quality of susceptibility maps was also strongly influenced by the echo combination approach (Figure 3) – Inverse-variance-weighted frequency combination resulted in QSMs with the least amount of noise and artefacts.
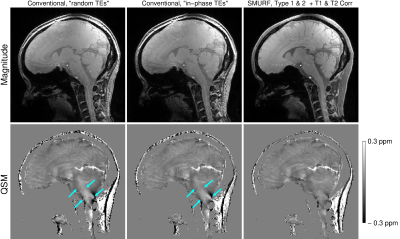
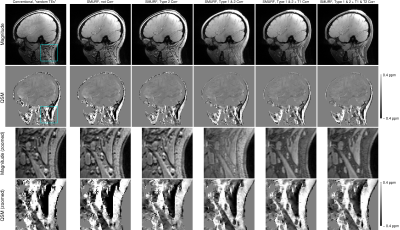
There was good agreement between i) conventional “random TEs” and uncorrected SMURF and ii) conventional “in-phase TEs” and Type 2 CSA-corrected SMURF images, demonstrating that SMURF introduced no additional artefacts. All of them generated blurred QSMs with overestimated susceptibilities, with errors stemming from the fatty tissues and extending to surrounding areas (Figure 4). With SMURF, Type 1 CSA and the effects of fat-water relaxation differences could also be corrected, resulting in chemical shift and relaxation effects-free images and susceptibility maps (Figure 5).
Discussion and Conclusion
The challenges of QSM in regions outside of the brain which contain significant amounts of fat have been addressed and high-quality susceptibility maps of the head-and-neck at 7T were generated.The proposed masking approach, based on the signal phase, was shown to allow a simple, reliable means of generating a head-and-neck mask. To achieve susceptibility maps without gross artefacts and high CNR throughout the entire head-and-neck, multi-echo acquisition with efficient echo combination was required. Finally, it was shown that QSM of fatty regions is adversely affected by chemical shift artefacts and by the disparate T1 and T2* relaxation times of fat and water and that these effects can be corrected using SMURF.
Acknowledgements
This study was funded by the Austrian Science Fund (FWF 31452). SR was additionally supported by the Marie Skłodowska-Curie Action (MS-fMRI-QSM 794298). (Austrian Federal Ministry for Digital and Economic Affairs and the National Foundation for Research, Technology and Development).References
- Karsa A, Punwani S, Shmueli K. An optimized and highly repeatable MRI acquisition and processing pipeline for quantitative susceptibility mapping in the head-and-neck region. Magn Reson Med. 2020;84(6):3206-3222. doi:10.1002/mrm.28377
- Sharma SD, Fischer R, Schoennagel BP, et al. MRI-based quantitative susceptibility mapping (QSM) and R2* mapping of liver iron overload: Comparison with SQUID-based biomagnetic liver susceptometry. Magn Reson Med. 2017;78(1):264-270. doi:10.1002/mrm.26358
- Schweser F, Herrmann K-H, Deistung A, et al. Quantitative magnetic susceptibility mapping (QSM) in breast disease reveals additional information for MR-based characterization of carcinoma and calcification. ISMRM 2011. #1014
- Wei H, Dibb R, Decker K, et al. Investigating magnetic susceptibility of human knee joint at 7 tesla. Magn Reson Med. 2017. 78(5):1933-1943. doi:10.1002/mrm.26596
- Straub S, Laun FB, Emmerich J, et al. Potential of quantitative susceptibility mapping for detection of prostatic calcifications. J Magn Reson Imaging JMRI. 2017;45(3):889-898. doi:10.1002/jmri.25385
- Guo Y, Liu Z, Wen Y, et al. Quantitative susceptibility mapping of the spine using in-phase echoes to initialize inhomogeneous field and R2* for the nonconvex optimization problem of fat-water separation. NMR Biomed. 2019;32(11):e4156. doi:10.1002/nbm.4156
- Ren J, Dimitrov I, Sherry AD, Malloy CR. Composition of adipose tissue and marrow fat in humans by 1H NMR at 7 Tesla. J Lipid Res. 2008;49(9):2055-2062. doi:10.1194/jlr.D800010-JLR200
- Bachrata B, Strasser B, Bogner W, et al. Simultaneous Multiple Resonance Frequency imaging (SMURF): Fat-water imaging using multi-band principles. Magn Reson Med. 2021;85(3):1379-1396. doi:10.1002/mrm.28519
- Bachrata B, Strasser B, Schmid AI, Bogner W, Trattnig S, Robinson SD. Eliminating chemical shift and relaxation effects in QSM using SMURF imaging. ISMRM 2020. #154
- Spincemaille P, Anderson J, Wu G, et al. Quantitative Susceptibility Mapping: MRI at 7T versus 3T. J Neuroimaging. 2020;30(1):65-75. doi:10.1111/jon.12669
- Wu B, Li W, Avram AV, Gho SM, Liu C. Fast and tissue-optimized mapping of magnetic susceptibility and T2* with multi-echo and multi-shot spirals. Neuroimage. 2012;59(1):297-305. doi:10.1016/j.neuroimage.2011.07.019
- Shinnar M, Eleff S, Subramanian H, Leigh JS. The synthesis of pulse sequences yielding arbitrary magnetization vectors. Magn Reson Med. 1989;12(1):74-80. doi:10.1002/mrm.1910120109
- Le Roux P. Exact synthesis of radio frequency waveforms. SMRM 1988. #1049
- Jordan CD, Saranathan M, Bangerter NK, Hargreaves BA, Gold GE. Musculoskeletal MRI at 3.0T and 7.0T: A Comparison of Relaxation Times and Image Contrast. Eur J Radiol. 2013;82(5):734-739. doi:10.1016/j.ejrad.2011.09.02115.
- Rooney WD, Johnson G, Li X, et al. Magnetic field and tissue dependencies of human brain longitudinal 1H2O relaxation in vivo. Magn Reson Med. 2007;57(2):308-318. doi:10.1002/mrm.21122
- Robinson S, Grabner G, Witoszynskyj S, Trattnig S. Combining phase images from multi-channel RF coils using 3D phase offset maps derived from a dual-echo scan. Magn Reson Med. 2011;65:1638-1648. doi:10.1002/mrm.22753.
- Eckstein K, Dymerska B, Bachrata B, et al. Computationally Efficient Combination of Multi-channel Phase Data From Multi-echo Acquisitions (ASPIRE). Magn Reson Med. 2018;79(6):2996-3006. doi:10.1002/mrm.26963
- Dymerska B, Eckstein K, Bachrata B, et al. Phase unwrapping with a rapid opensource minimum spanning tree algorithm (ROMEO). Magn Reson Med. 2020. doi:10.1002/mrm.28563
- Chan K-S, Marques J. SEPIA - SuscEptibility mapping PIpeline tool for phAse images. ISMRM 2019. #4827
- Liu T, Khalidov I, de Rochefort L, et al. A novel background field removal method for MRI using projection onto dipole fields (PDF). NMR Biomed. 2011;24(9):1129-1136. doi:10.1002/nbm.1670
- Li W, Wang N, Yu F, et al. A method for estimating and removing streaking artifacts in quantitative susceptibility mapping. NeuroImage. 2015;108:111-122. doi:10.1016/j.neuroimage.2014.12.043
- Robinson SD, Bredies K, Khabipova D, Dymerska B, Marques JP, Schweser F. An illustrated comparison of processing methods for MR phase imaging and QSM: combining array coil signals and phase unwrapping. NMR Biomed. 2016. doi:10.1002/nbm.3601
- Liu T, Wisnieff C, Lou M, Chen W, Spincemaille P, Wang Y. Nonlinear formulation of the magnetic field to source relationship for robust quantitative susceptibility mapping. Magn Reson Med. 2013;69(2):467-476. doi:10.1002/mrm.24272
- Quinn MP, Gati JS, Klassen LM, et al. Comparison of Multiecho Postprocessing Schemes for SWI with Use of Linear and Nonlinear Mask Functions. Am J Neuroradiol. 2014;35(1):38-44. doi:10.3174/ajnr.A3584
Figures

Figure 1: Steps in generating a mask of the head-and-neck that excludes voxels with unreliable phase values. Maps based on phase gradient coherence (GC) and phase combination quality, i.e. Q-metric, were calculated separately for fat (top row) and water (bottom row), thresholded and then multiplied. Subsequently, the resulting fat and water masks were combined (via an OR operation). Isolated zeros within tissue were removed by smoothing and thresholding, and the mask was eroded to remove the edge voxels that had been added by smoothing.

Figure 2: Comparison of QSM maps generated from individual echo images and echo-combined images for the head-and-neck (top) and brain-only (bottom). While in the neck, the first-echo QSM map correctly depicts the paramagnetic fatty areas and provides good CNR (top left), in the brain – with long T2* – the CNR is low. This is improved for later echoes at the expense of short T2* areas, such as the neck, sinuses and veins, where errors occur (centre). In the QSM maps generated from the echo-combined images (right) these errors are reduced and high CNR is achieved over the entire head-and-neck.

Figure 3: Comparison of fieldmaps and QSM maps generated with different echo combination methods. The fieldmaps generated with Optimum weights (left) and nonlinear fitting by MEDI (middle) contained many noisy voxels in the neck (blue arrows), resulting in streaking artefacts in the susceptibility maps. The Inverse-variance-weighted frequency combination (right) generated fieldmaps and susceptibility maps with the least amount of noise and artefacts.

Figure 4: Comparison of the conventional (broadband excitation) “random TEs” (left) and “in-phase TEs” (middle) and chemical shift and relaxation effects-corrected SMURF images (right). The susceptibility maps generated from the conventional acquisitions contain errors that originate in the fatty neck areas and extend throughout the brainstem. These errors are reduced using SMURF, allowing more accurate estimation of susceptibility values.

Figure 5: Illustration of the effect of individual chemical shift and relaxation corrections. The susceptibility maps corrected for Type 1 and Type 2 CSA (column 4) clearly depict the paramagnetic fatty areas. The susceptibility maps generated from the conventional images (column 1) and from the SMURF images recombined without corrections for chemical shift effects (column 2 and 3) are more blurred and the values are visibly overestimated. Corrections for T1 and T2* relaxation differences (columns 5 and 6) remove the dominant influence of fat signal in mixed voxels.